



The situation in the oil market is turning 180 degrees after less than a month. After testing the area of $70 per barrel for Brent crude, we are currently testing the area of $78 per barrel, and much indicates that upward pressure on the oil market may be maintained in the near future. Following an Iranian attack on at least 3 commercial vessels in the Strait of Hormuz, the United States responded with an attack on dozens of Iranian positions related to, among other things, anti-aircraft defense. This all takes place during the funeral ceremonies of Iran's Supreme Leader, and Donald Trump himself says that the ceasefire agreement is essentially no longer in effect. What does the situation look like and what's next for oil prices?
The chart shows oil price changes in the current conflict and after previous tensions in the oil market
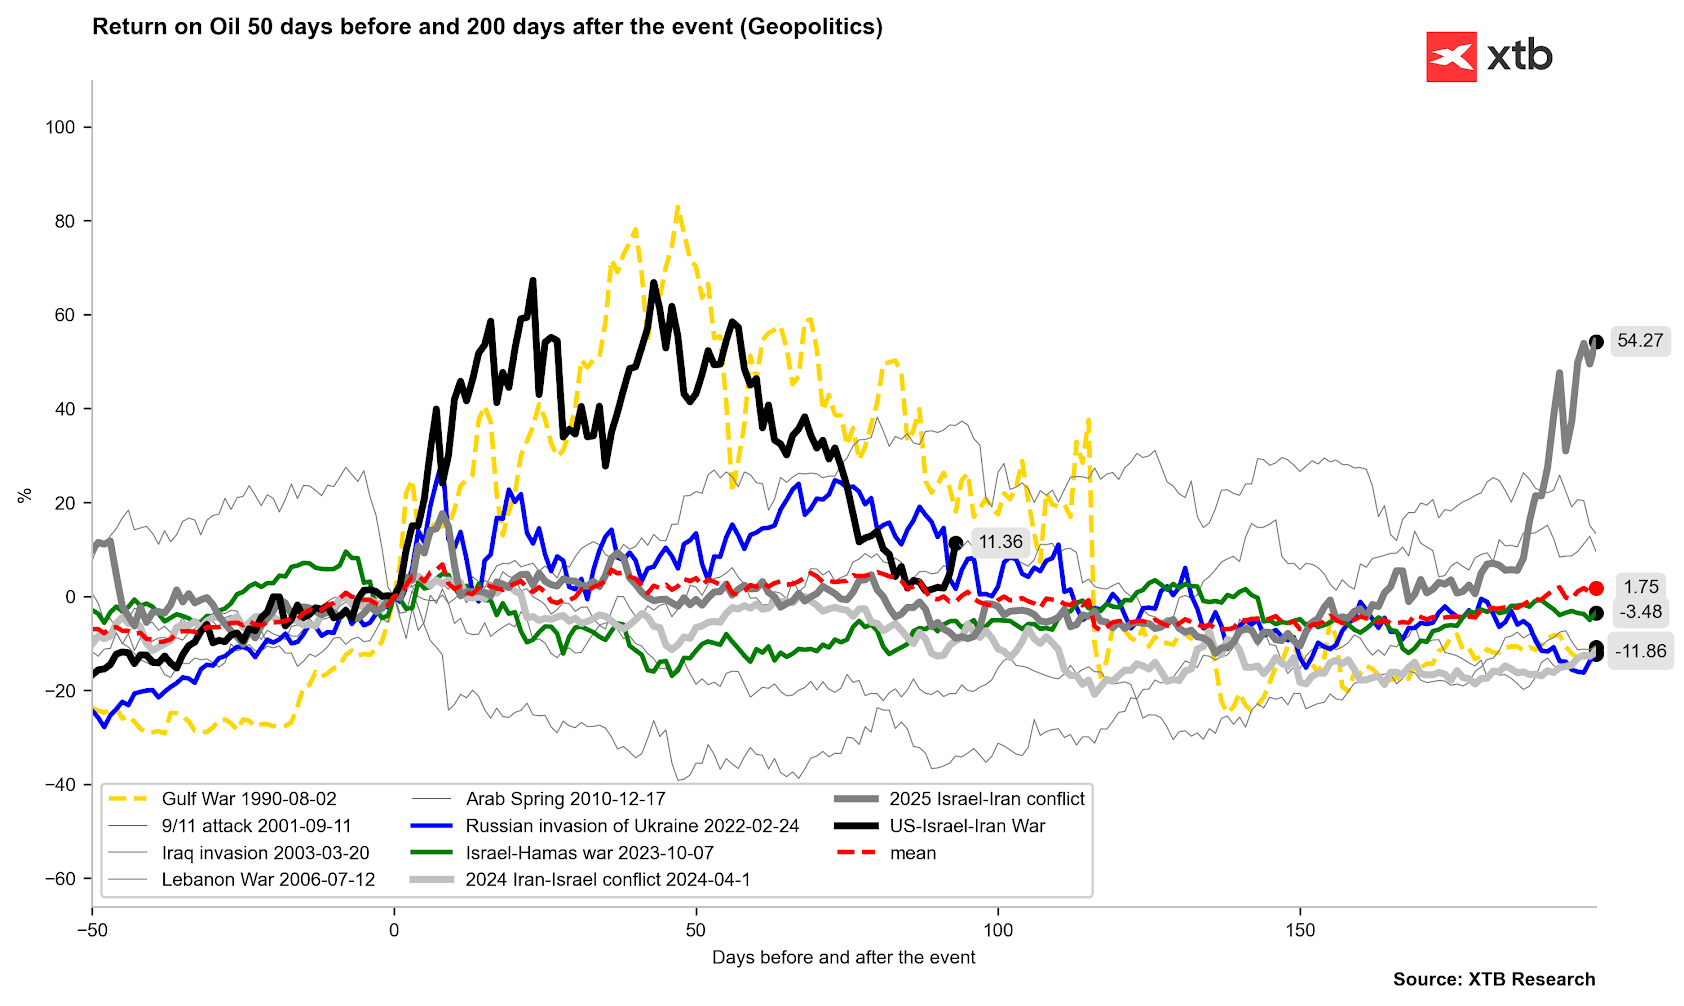 Oil is rising again. As shown by the situations from 1990 and 2022, even in the perspective of the next few months, the situation can be quite volatile, although at the same time, history does not show that in such a case we have a return to the conflict maximum. Source: Bloomberg Finance LP, XTB
Escalation Timeline: How did the break of the memorandum occur?
Here is the exact sequence of events that led to the current escalation of the conflict:
- Signing of the memorandum: Last month, the USA and Iran concluded a temporary 60-day agreement. It guaranteed safe, fee-free passage for ships through the Strait of Hormuz in exchange for a temporary suspension of US sanctions on Iranian oil and the commencement of talks on Tehran's nuclear program.
- Iranian attack on commercial vessels (start of escalation): Iran violated the terms of the agreement by targeting three commercial units passing through the Strait of Hormuz (including, among others, a tanker carrying liquefied natural gas - LNG).
- United States retaliation: In response to the aggression against commercial ships, US forces conducted a massive retaliatory strike, hitting over 80 targets on Iranian territory. Washington also immediately reinstated sanctions on the Iranian oil trade.
- Iranian counterattack: Tehran responded with another wave of strikes, this time aimed at targets in Bahrain and Kuwait.
- Official end of the truce: While at the NATO summit in Ankara, Donald Trump cut short all speculation, declaring to journalists that the ceasefire is over ("as far as I'm concerned it's over"). The President sharply criticized the Iranian authorities, calling them "scum" and "liars," which precludes chances for a quick return to diplomacy.
Market Reaction: Return of the "war factor"
The geopolitical shock immediately translated into the pricing of black gold. Brent, which had been systematically becoming cheaper in recent weeks thanks to hopes for de-escalation, recorded a powerful rebound:
- The price of a barrel of Brent oil rose today by over 3%, testing the area of $78 per barrel. Since the beginning of the current escalation, prices have risen by almost 10%
- American WTI oil went up to a similar degree, reaching even the level of $75.
Looking at the chart below, we can closely observe the anatomy of this market shock. Previous forward curves: from June 24 (orange line) and July 1 (blue line) reflected a slow decline in prices on the nearest contracts (short end of the curve), when investors were still living on hope for peace. In turn, the current curve (black line) shows a drastic, vertical upward shift in the prices of contracts with delivery dates in the coming months. We also see a clear widening of calendar spreads, although they remain below 1 dollar. Such a structure of deep backwardation clearly proves that the market is paying a huge premium for immediate delivery of the commodity in fear of a physical blockade of supplies. Interestingly, just in the last few days we often observed the formation of contango at the short end of the curve until the end of this year, due to accelerated deliveries of the commodity from the Persian Gulf.
The chart shows forward curves for the oil market from the last two weeks
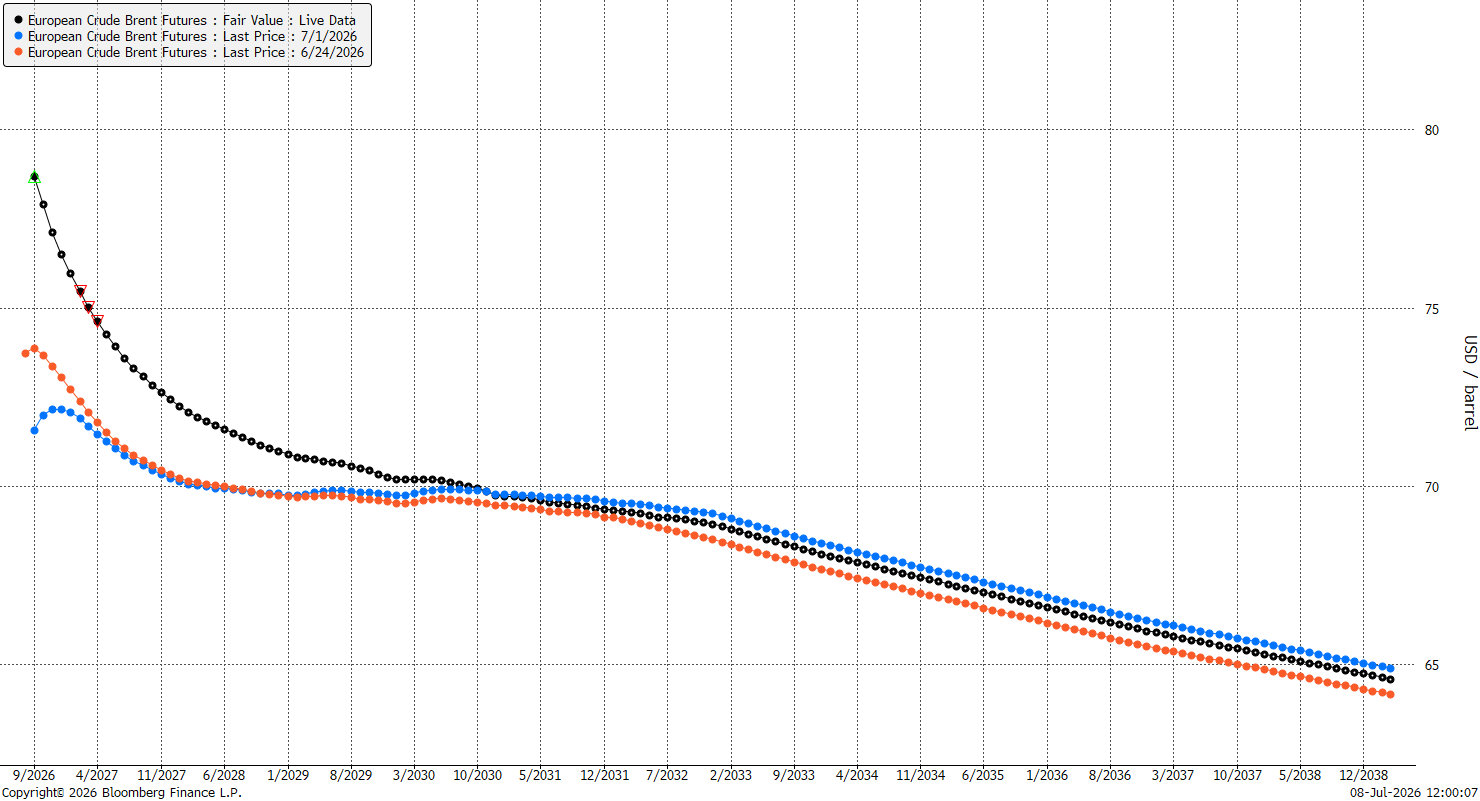
The current forward curve is again in very large backwardation, although just a week ago we even observed contango at the short end. Source: Bloomberg Finance LP
A key question now arises. Are we returning to the war factor? Definitely yes, although we can expect absolutely anything from Donald Trump. On the other hand, at this point such a significant escalation has occurred that the upward pressure can be continued, even without additional comments from both sides.
Key location: On which side were the ships attacked?
Available reports indicate that three commercial ships were attacked directly during transit through the strategic Strait of Hormuz. Although official agency dispatches do not specify detailed coordinates at this time (whether the strike occurred within the territorial waters of Oman or Iran), this division is of fundamental importance for shipping.
Geographically, the Strait of Hormuz is extremely narrow, and designated international shipping routes (both inbound and outbound lanes) pass predominantly through the territorial waters of Oman (around the Musandam exclave). The fact that Iran decided to attack in this key corridor, violating the recently signed memorandum guaranteeing safe and fee-free passage, shows that Tehran is determined to control the entire bottleneck, regardless of state borders.
What does this mean for the USA and guarantees of safe passage? Breaking the agreement drastically limits the ability of the United States to ensure the safe passage of ships using diplomatic tools. Since Iran does not respect agreements, ignores the status of trade routes, and extends the conflict to other countries in the region (Kuwait, Bahrain), the USA faces a logistical and military challenge. The only way to enforce the openness of the strait now remains permanent military protection of convoys (military escort). This, in turn, drastically increases the risk of a direct US-Iran maritime encounter with almost every incident. Such a situation is a nightmare scenario for the oil market, which threatens to return prices even to a triple-digit level.
The chart shows a comparison of WTI oil prices and the crack spread
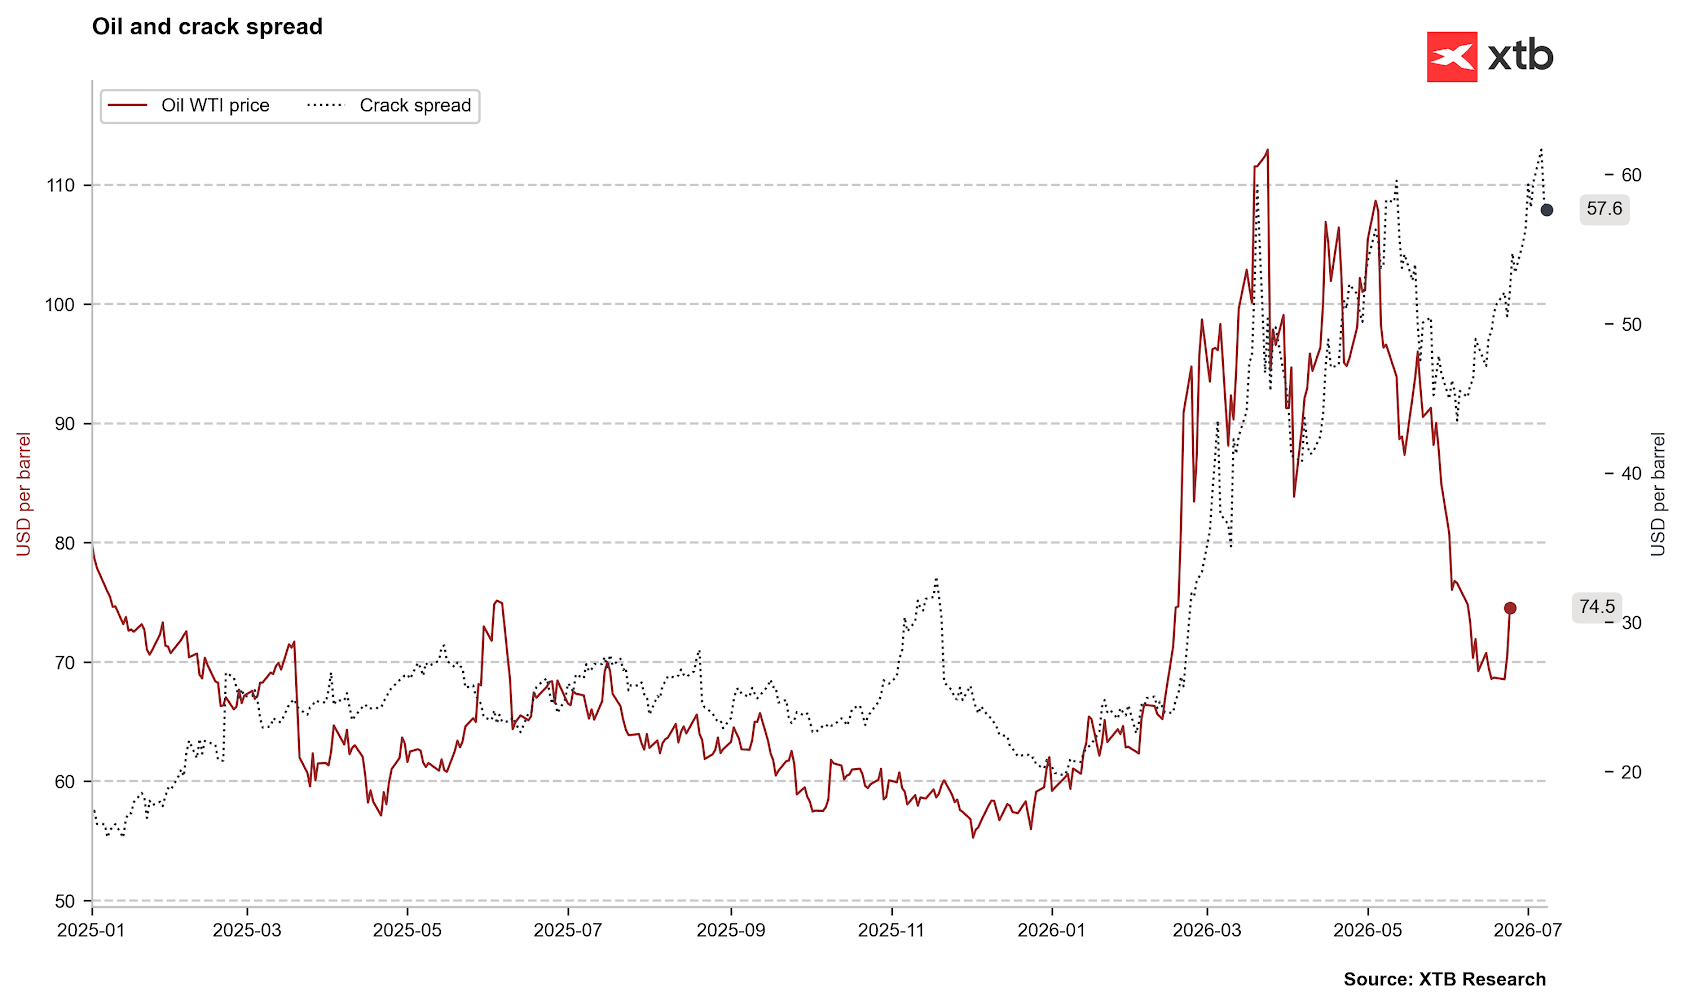 The crack spread remained at a high level, even with a massive drop in oil prices. This means that fuels have not achieved even a moment of peace after the approximately 3-month conflict. Source: Bloomberg Finance LP, XTB
How does oil look technically?
The chart shows oil price behavior and technical analysis
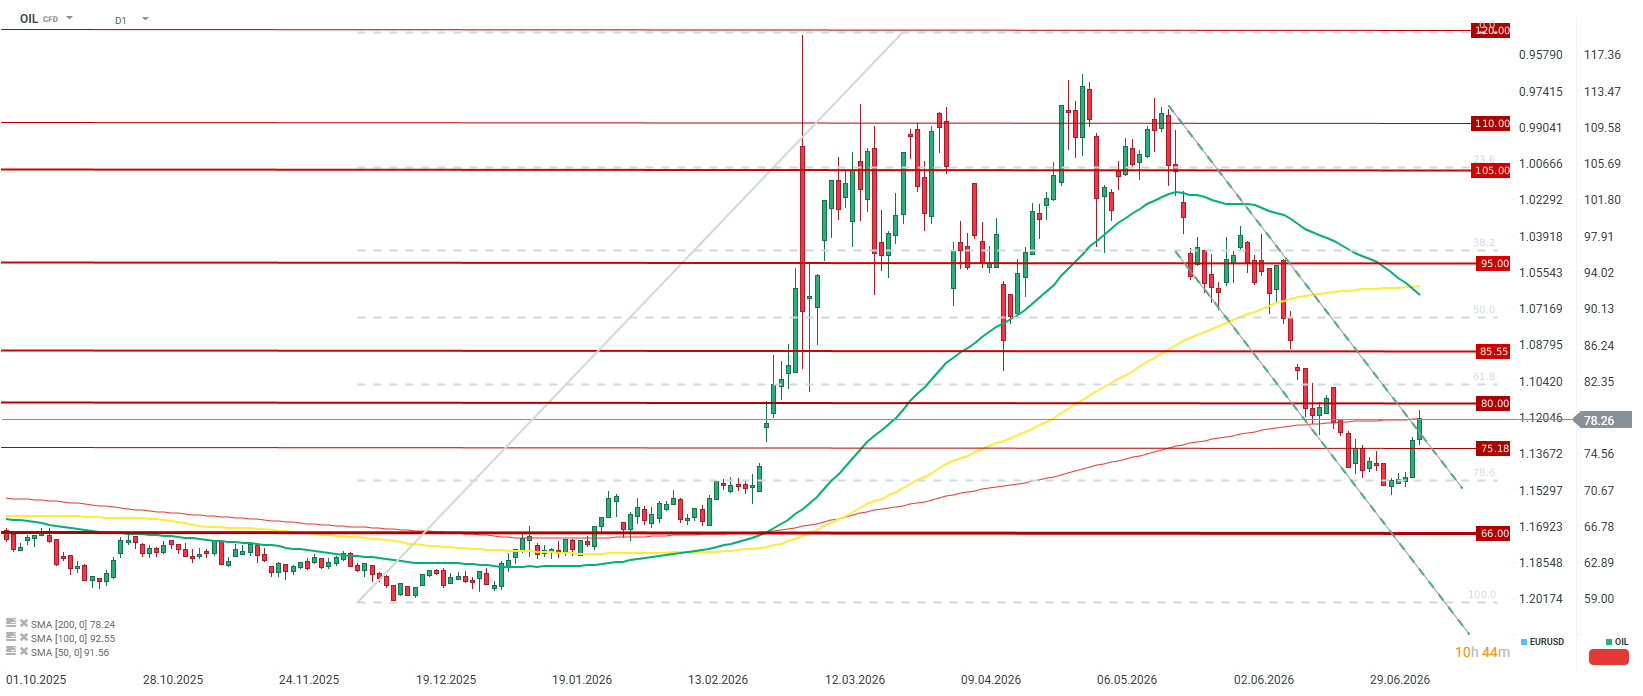 Oil is rebounding very strongly for the second session in a row, after consolidating above $70 per barrel. Oil is testing the 200-period average and potentially breaking out of the upper limit of the downward trend channel. A very strong supply zone is located between $80 and the 61.8 retracement, and then $85 per barrel. If the flow of ships through the Strait of Hormuz continues, we should not observe a rise above the 80-85 zone. If there is a direct exchange of fire between American and Iranian units, then the chances of oil prices rising to $100 will be quite high. Source: xStation5



Daily Summary: Valuations Under Pressure, Capital Moves Away From Technology

Market Wrap: "Decent" results are not enough – tech stocks fall further; oil highest since May (22.10.2026)


Daily Summary: SpaceX and the tech sector drive Wall Street, oil retreats sharply below $97


Russia is selling off gold reserves. Why, to whom, and does it matter for the market?
The content of this report has been created by XTB S.A., with its registered office in Warsaw, at Prosta 67, 00-838 Warsaw, Poland, (KRS number 0000217580) and supervised by Polish Supervision Authority ( No. DDM-M-4021-57-1/2005). This material is a marketing communication within the meaning of Art. 24 (3) of Directive 2014/65/EU of the European Parliament and of the Council of 15 May 2014 on markets in financial instruments and amending Directive 2002/92/EC and Directive 2011/61/EU (MiFID II). Marketing communication is not an investment recommendation or information recommending or suggesting an investment strategy within the meaning of Regulation (EU) No 596/2014 of the European Parliament and of the Council of 16 April 2014 on market abuse (market abuse regulation) and repealing Directive 2003/6/EC of the European Parliament and of the Council and Commission Directives 2003/124/EC, 2003/125/EC and 2004/72/EC and Commission Delegated Regulation (EU) 2016/958 of 9 March 2016 supplementing Regulation (EU) No 596/2014 of the European Parliament and of the Council with regard to regulatory technical standards for the technical arrangements for objective presentation of investment recommendations or other information recommending or suggesting an investment strategy and for disclosure of particular interests or indications of conflicts of interest or any other advice, including in the area of investment advisory, within the meaning of the Trading in Financial Instruments Act of 29 July 2005 (i.e. Journal of Laws 2019, item 875, as amended). The marketing communication is prepared with the highest diligence, objectivity, presents the facts known to the author on the date of preparation and is devoid of any evaluation elements. The marketing communication is prepared without considering the client’s needs, his individual financial situation and does not present any investment strategy in any way. The marketing communication does not constitute an offer of sale, offering, subscription, invitation to purchase, advertisement or promotion of any financial instruments. XTB S.A. is not liable for any client’s actions or omissions, in particular for the acquisition or disposal of financial instruments, undertaken on the basis of the information contained in this marketing communication. In the event that the marketing communication contains any information about any results regarding the financial instruments indicated therein, these do not constitute any guarantee or forecast regarding the future results.