



Bitcoin has returned to the $71,000 - $72,000 area, and the pace of the rebound suggests that the move was heavily amplified by record short liquidations. Over two days, more than $3.1 billion in short positions were liquidated across the crypto market, creating a powerful source of forced buying. At the same time, that process removed a significant portion of leveraged bearish exposure that could otherwise have generated further buy-to-cover demand at higher prices.
Attention is therefore shifting away from the size of the squeeze itself and toward whether genuine demand can sustain the move once that mechanical support begins to fade. CryptoQuant data shows that above roughly $68,700, short-term holders are once again profitable on average, which naturally increases their willingness to realize gains. ETF flows will also be worth watching, because renewed inflows could provide a more durable source of demand than forced short covering. The strongest potential catalyst for BTC could come from any new communication from the U.S. administration regarding possible additional Bitcoin purchases or an expansion of the U.S. strategic Bitcoin reserve.
- Another important catalyst has been the increasingly pro-crypto stance of the Trump administration. The president called on Congress to continue work on the CLARITY Act and acknowledged during a meeting with industry representatives that discussions are taking place within the administration about the possibility of additional U.S. purchases of Bitcoin or other digital assets, although there is currently no guarantee, formal plan, or timetable.
- A second source of support came from Wednesday’s U.S. Treasury measures in the bond market. The Treasury announced that it would double the size of some buyback operations in long-dated bonds to at least $4 billion per operation, helping ease pressure on long-end yields and improving sentiment toward duration-sensitive and risk assets.
A historic short squeeze has changed the market’s dynamics
The scale of the latest liquidations was exceptional even by crypto market standards. Over two days, more than $3.1 billion in short positions were liquidated, with Bitcoin alone accounting for around $1.65 billion of that amount. Earlier, one-day BTC short liquidations exceeded $1 billion for the first time, which helps explain the speed of the move from the $63,000–64,000 area toward $72,000.
The rally we have seen since yesterday has a very different structure from a classic trend built gradually by spot demand. When leveraged short positions are liquidated, exchanges or counterparties are forced to close that exposure, which translates into buy-side pressure. As price rises, additional short positions can hit liquidation thresholds and trigger further forced buying. For a period of time, the market can therefore become self-reinforcing.
The complication comes later, once a significant portion of leveraged bearish positioning has already been flushed out. At that stage, fewer short positions remain available to generate another wave of forced demand. This is why record liquidations are both confirmation of strength and a reason to become more selective in interpreting the next move. The squeeze delivered a powerful impulse, but it is not an unlimited source of buying.
From here, ordinary demand becomes more important. The more leveraged shorts that have already been closed, the greater the role that must be played by spot buyers, ETF inflows and other investors willing to increase exposure voluntarily. That makes Bitcoin’s behaviour around current levels more informative than the liquidation numbers themselves.
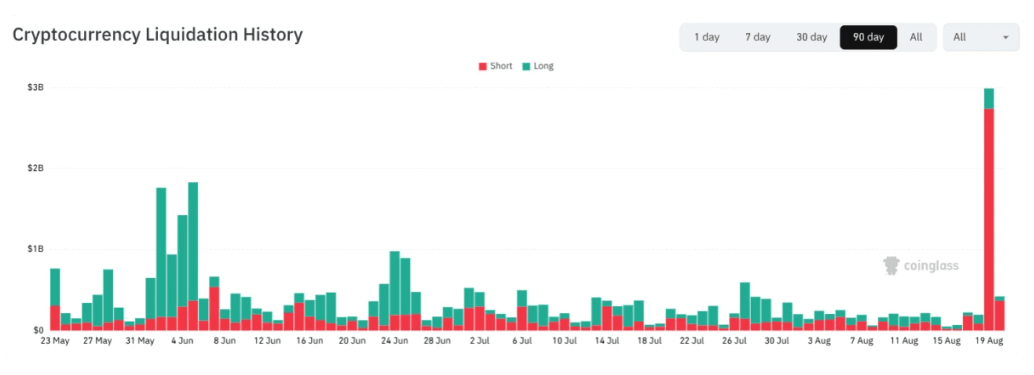
Source: Coinglass
The $69,000–72,000 area is becoming an important test for demand
One of the most important changes has taken place not only on the price chart, but also in the behaviour of short-term Bitcoin holders. Their aggregate cost basis is close to $68,700, and BTC’s move back above that level has pushed a large group of previously underwater positions back into profit. This changes the psychology of supply. Short-term holders no longer need to sell at a loss and can instead exit at break-even or with a modest gain.
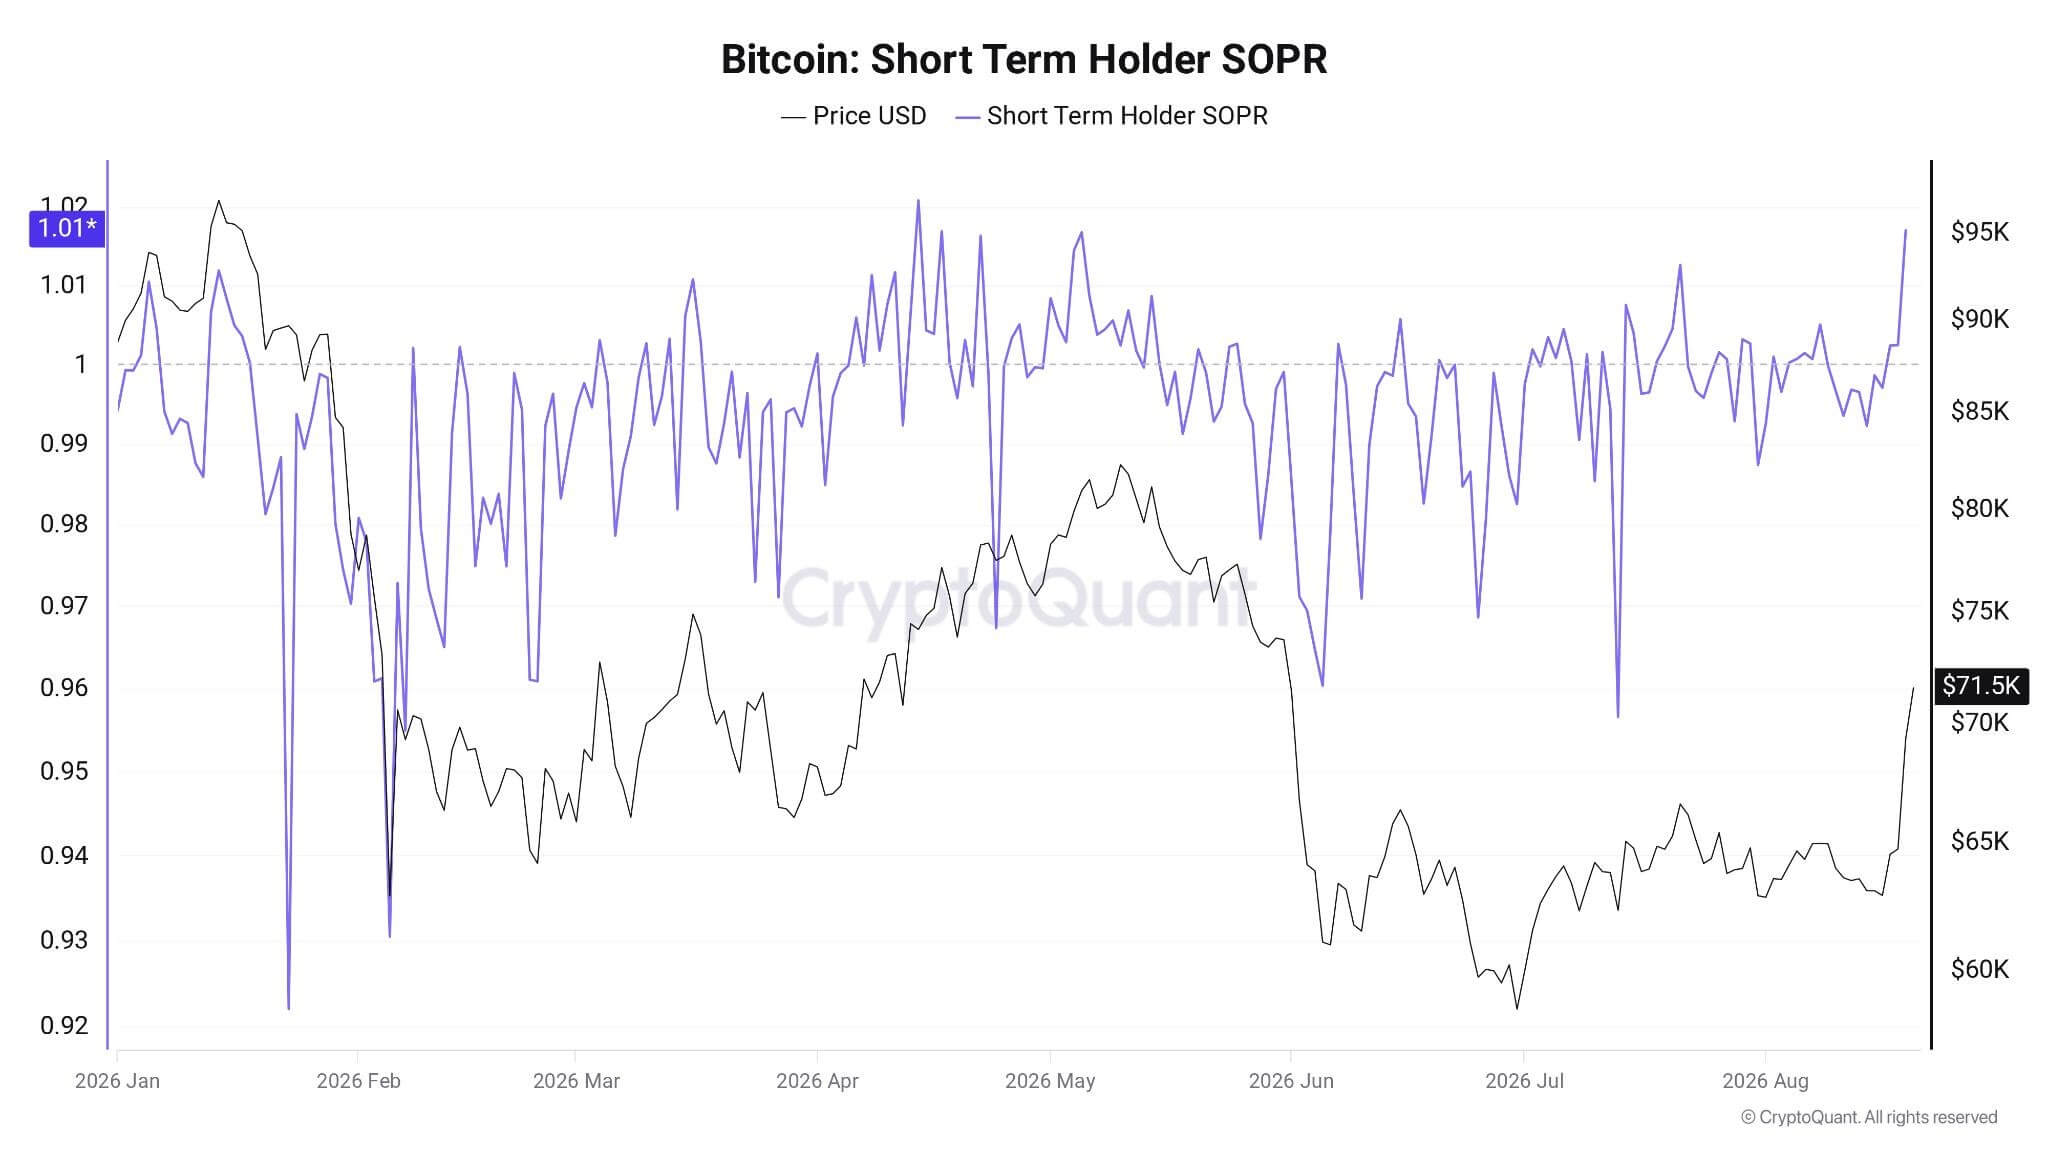
This is already visible in the on-chain data. Around 43,300 BTC held by short-term investors were transferred to exchanges while in profit, the largest such move in 2026, while STH-SOPR rose to 1.01, its highest level since April. The reading itself is not yet extreme. What matters is that a larger share of potential sell-side supply is now coming from investors who have regained the ability to exit with a positive return.
The zone between $68,700 and $72,000 is therefore more than just a technical range. If Bitcoin remains elevated despite rising profit-taking and increased coin flows toward exchanges, it would suggest that fresh demand is absorbing that supply without much difficulty. That would strengthen the case that the rally is evolving beyond the original short squeeze.
If the price quickly falls back below the STH cost basis, however, the picture would become less constructive. The market could then conclude that mechanical buying from liquidations had already done most of the work, while underlying demand failed to keep pace. The key question is now whether buyers can absorb profit-taking once the forced-buying impulse weakens.
Bitcoin chart (D1 interval)
Bitcoin is currently surging above the 200-session EMA200, shown as the blue band on the chart, with $73,500 acting as a key resistance area (the red line) - supported by the price action and 0,236 Fibo retracement. This makes the current zone particularly important because the market is simultaneously confronting a major technical barrier and rising profit-taking from short-term holders.
On the downside, an important support zone lies around $65,000–66,500, based on the price action methodology. A move back toward that area would not automatically invalidate the rebound, but it would suggest that the market was unable to hold the gains created during the liquidation-driven surge.
A sustained move above $73,000 would carry a different message. It would indicate that demand is strong enough to push BTC beyond the EMA200 even after much of the short squeeze has already taken place. That would be a more credible confirmation of underlying strength than the original vertical move itself.
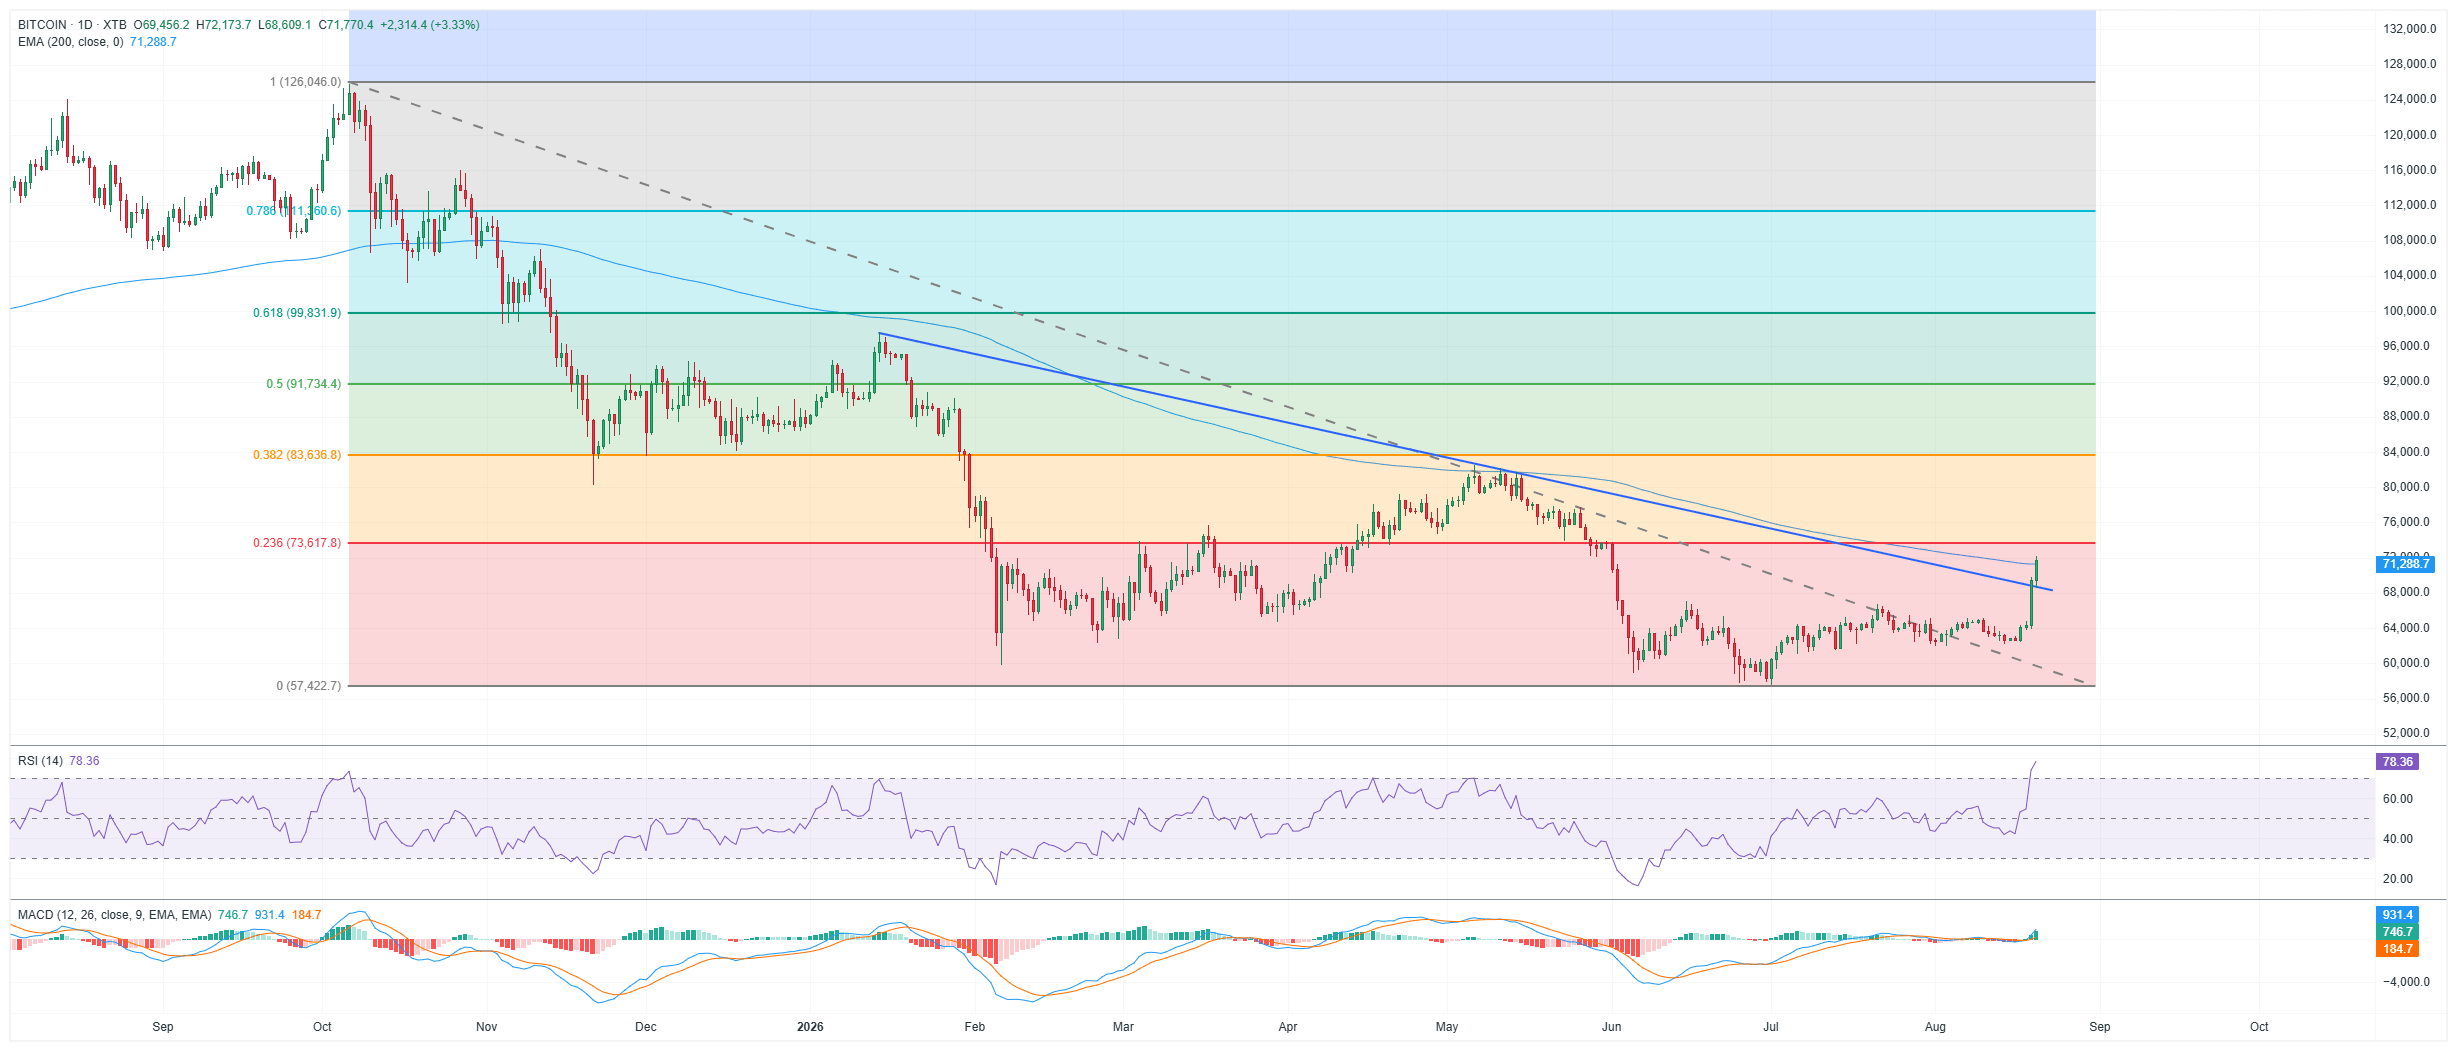
Source: xStation5
The 2024–2028 halving cycle
The chart suggests that Bitcoin cycles around halving events have historically followed a broad recurring pattern, but the market does not wait until the exact date of the halving to react. In previous cycles, price appreciation often began well before the event as investors gradually started discounting the future reduction in the rate of new BTC issuance. The halving itself therefore tended to reinforce an existing cycle rather than create one from scratch.
The upward phase often continued after the halving, before eventually giving way to overheating and a deeper correction. A similar structure can be seen in the current cycle, with Bitcoin having previously traded above $120,000 before falling back toward the $72,000 area. This does not mean that every cycle must repeat in the same way, but it does show why the halving is better understood as a structural supply mechanism rather than a precise timing signal.
Bitcoin is still relatively far from the next halving, expected in April 2028. If the broad historical pattern were to repeat, the market could begin placing greater weight on the next supply reduction roughly a year in advance, making spring 2027 onward increasingly relevant. The exact timing, however, should not be treated mechanically.
The more useful interpretation is that the next halving may gradually become part of the market narrative during 2027, rather than suddenly becoming important in April 2028 itself. Whether that translates into higher prices will still depend on demand, liquidity and broader market conditions.
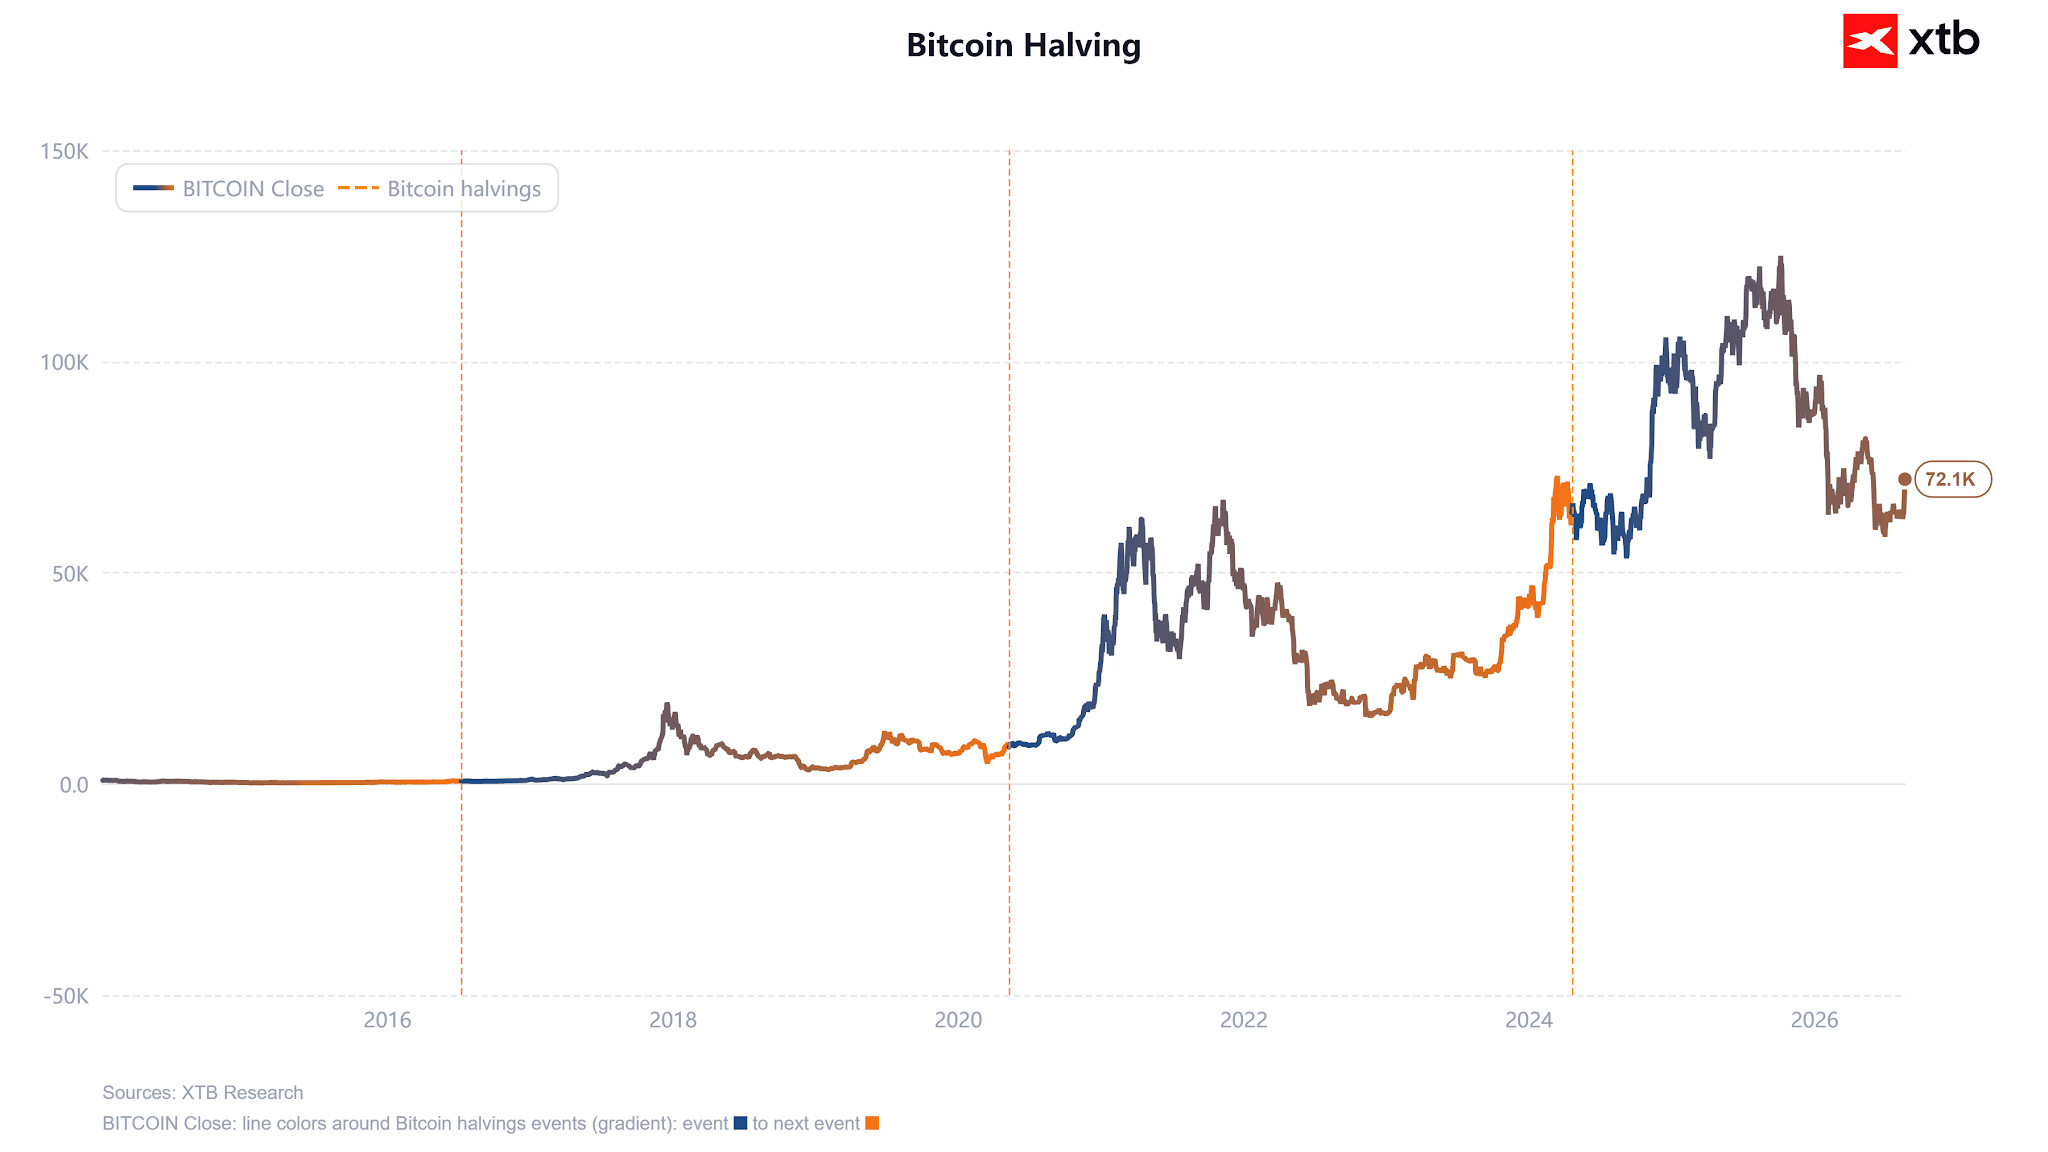
Source: XTB Research
Profit-taking by STH is rising, but the market is still showing resilience
Flows from short-term Bitcoin holders to exchanges have accelerated sharply. Around 43,300 BTC were transferred while in profit, the highest such reading in 2026. This is a natural consequence of the recent rebound, as investors who were underwater only recently now have an opportunity to reduce exposure without locking in a loss.
Importantly, exchange inflows should not automatically be treated as completed sales. They represent potential sell-side supply, because investors may transfer coins to exchanges without immediately selling them. Even so, a move of this magnitude matters because it shows that a large amount of BTC has become more readily available to the market.
The rise in potential supply does not automatically signal the end of the move. In a strong market, new buyers can absorb heavy profit-taking without materially disrupting the trend. This is why the most important signal now is not simply that STH are moving coins to exchanges, but how the price behaves while that potential supply is increasing.
If Bitcoin can hold around $72,000–72,500, or break above that area despite these flows, it would be a strong sign of genuine demand. If the rally fades quickly, however, those inflows could begin to look less like routine profit-taking and more like the early stages of broader distribution.
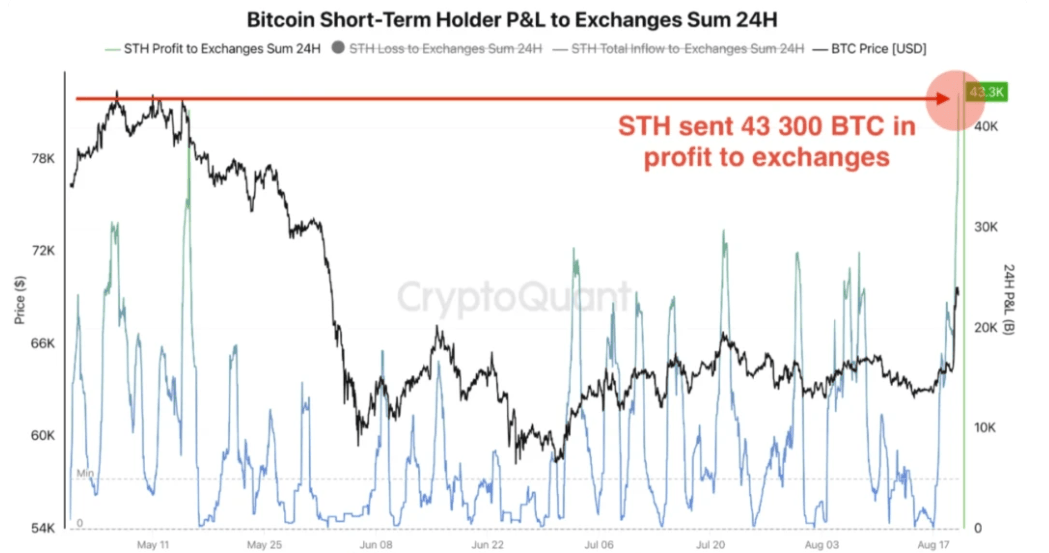
Source: CryptoQuant
STH-SOPR moves back above 1 and changes the character of supply
The on-chain indicator known as STH-SOPR has risen to 1.01, its highest level since April. This is not an extreme reading, but its position relative to 1 is important. Short-term holders are once again moving coins at prices that are, on average, slightly above their acquisition cost.
The market has therefore shifted from a phase dominated by realized losses toward one in which short-term holders are increasingly able to realize profits. The level of 1 acts as a useful dividing line: below it, coins are typically being moved at a loss, while above it, a larger share of short-term activity takes place at a profit. This changes the character of potential supply.
The most constructive scenario for bulls would be for SOPR to remain slightly above 1 while BTC continues to rise. That would suggest that the market is absorbing profit-taking without much difficulty and that demand remains strong enough to support higher prices. In that environment, realized gains would be a sign of healthy rotation rather than distribution.
A weaker signal would be a further rise in SOPR alongside a stagnating or falling Bitcoin price. That combination would suggest that more investors are using the rebound as an opportunity to reduce exposure while buyers struggle to absorb the available supply. In other words, the key issue is not whether investors are taking profits, but whether the market can continue rising while they do so.
 Source: CryptoQuant


Daily Summary: Earnings Season Kicks Off on Wall Street Amid Mixed Sentiment



Market Wrap: European Stocks Rise as Banks Beat Earnings Expectations



Morning Wrap: OpenAI Revenue Concerns Weigh on Wall Street


Bitcoin Hits a Wall. Will “Uptober” Bring a Crypto Correction?
The content of this report has been created by XTB S.A., with its registered office in Warsaw, at Prosta 67, 00-838 Warsaw, Poland, (KRS number 0000217580) and supervised by Polish Supervision Authority ( No. DDM-M-4021-57-1/2005). This material is a marketing communication within the meaning of Art. 24 (3) of Directive 2014/65/EU of the European Parliament and of the Council of 15 May 2014 on markets in financial instruments and amending Directive 2002/92/EC and Directive 2011/61/EU (MiFID II). Marketing communication is not an investment recommendation or information recommending or suggesting an investment strategy within the meaning of Regulation (EU) No 596/2014 of the European Parliament and of the Council of 16 April 2014 on market abuse (market abuse regulation) and repealing Directive 2003/6/EC of the European Parliament and of the Council and Commission Directives 2003/124/EC, 2003/125/EC and 2004/72/EC and Commission Delegated Regulation (EU) 2016/958 of 9 March 2016 supplementing Regulation (EU) No 596/2014 of the European Parliament and of the Council with regard to regulatory technical standards for the technical arrangements for objective presentation of investment recommendations or other information recommending or suggesting an investment strategy and for disclosure of particular interests or indications of conflicts of interest or any other advice, including in the area of investment advisory, within the meaning of the Trading in Financial Instruments Act of 29 July 2005 (i.e. Journal of Laws 2019, item 875, as amended). The marketing communication is prepared with the highest diligence, objectivity, presents the facts known to the author on the date of preparation and is devoid of any evaluation elements. The marketing communication is prepared without considering the client’s needs, his individual financial situation and does not present any investment strategy in any way. The marketing communication does not constitute an offer of sale, offering, subscription, invitation to purchase, advertisement or promotion of any financial instruments. XTB S.A. is not liable for any client’s actions or omissions, in particular for the acquisition or disposal of financial instruments, undertaken on the basis of the information contained in this marketing communication. In the event that the marketing communication contains any information about any results regarding the financial instruments indicated therein, these do not constitute any guarantee or forecast regarding the future results.