



Bitcoin ETF inflows slowed in October after a very strong September, when net inflows into spot funds exceeded $2.6 billion. Even so, the price of the largest cryptocurrency, as well as altcoins, remains close to local highs and is showing notable resilience despite rising bond yields and a stronger US dollar. What do the technical setup and on-chain data suggest?
Key news
- Unfortunately, inflows into US spot Bitcoin ETFs have slowed significantly compared with September. After an outflow of around $89.9 million on October 5, the funds recorded roughly $118.9 million in net inflows again on October 6, indicating that institutional demand remains positive but is clearly less consistent than it was at the end of September.
- Macro pressure remains the biggest short-term risk. The US 10-year Treasury yield has risen to around 5.3%, while the dollar has approached its highest levels in several months, which could weigh on appetite for higher-risk assets, including cryptocurrencies, if these conditions persist.
- The market continues to respect the $83,000–84,000 area as an important support zone. A sustained move below $83,000 would increase the risk of a decline toward $80,000, while a return above $86,500 would improve the technical structure.
- On-chain data do not currently indicate a strong wave of selling from medium-sized market participants. The seven-day average of BTC inflows from this group to Binance has fallen by more than 36% since mid-August, while inflows to Coinbase Prime are down by around 15%, despite Bitcoin gaining more than 30% over the same period.
- Bitcoin is holding up relatively well against what has historically been a seasonally weak start to October. After gaining more than 6% in September, the market has retained most of those gains, although the current consolidation suggests buyers have not yet fully regained control of momentum.
- The key catalysts for the coming days remain the Fed, bond yields and ETF flows. Markets are focused mainly on the minutes from the Fed’s September meeting, the next move in 10-year Treasury yields, and whether spot Bitcoin ETF inflows become more consistent again.
Bitcoin chart (H1, D1, W1 timeframes)
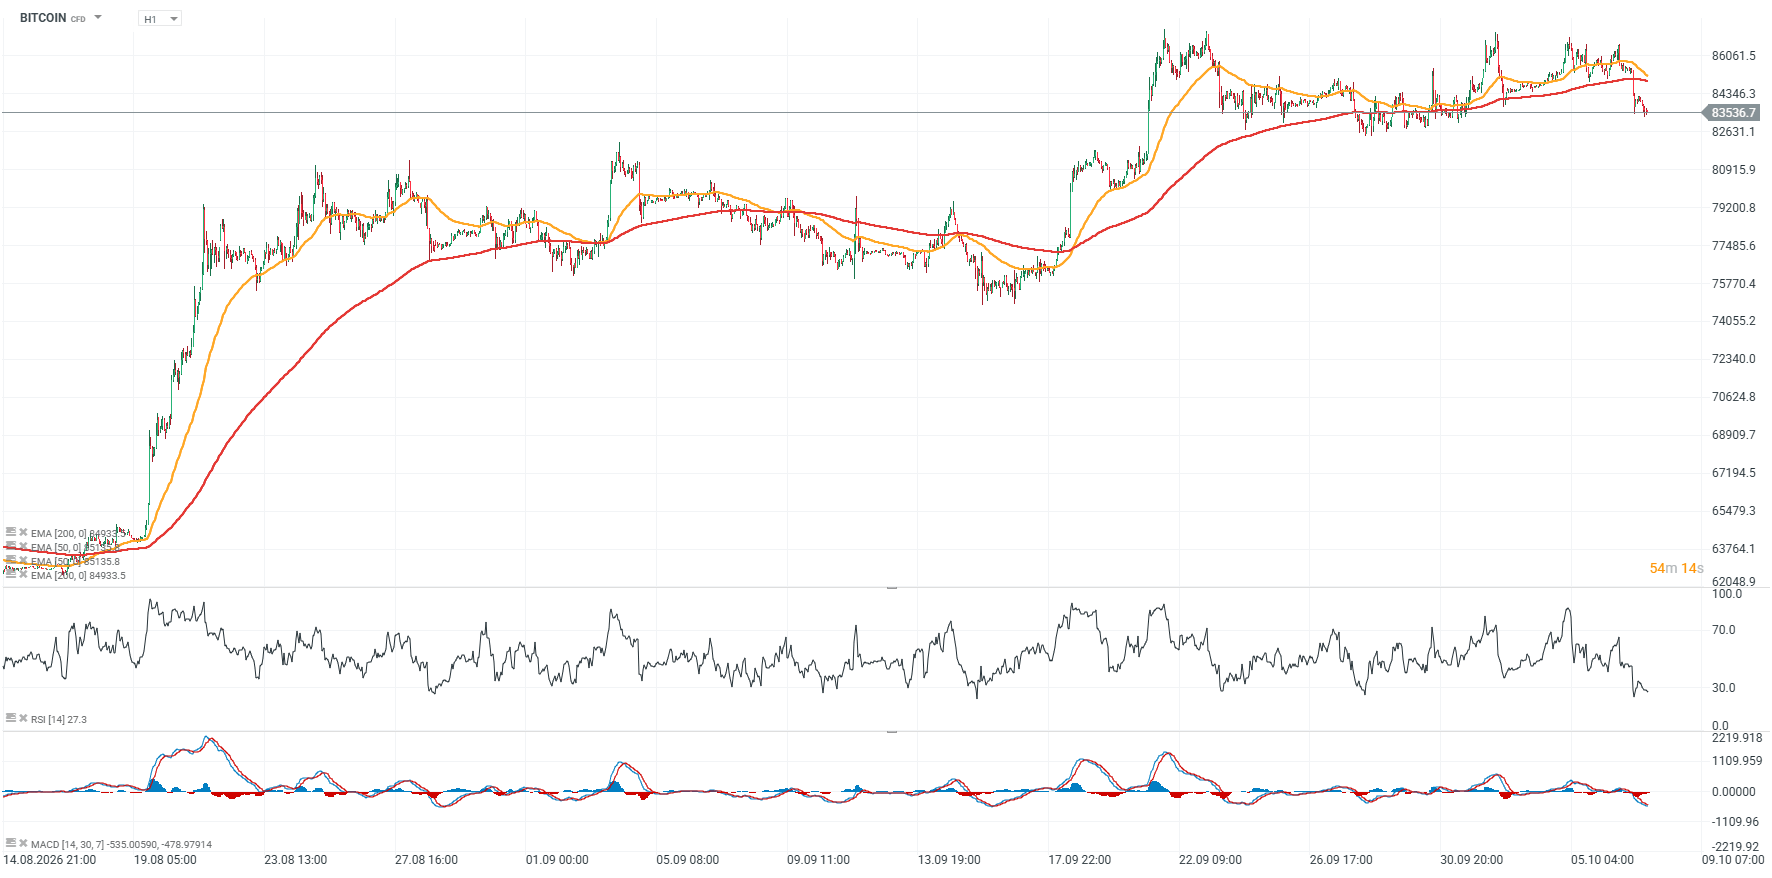
Bitcoin is pulling back below both the 50- and 200-period EMAs on the hourly chart, pointing to weakening breakout momentum. The price has once again been rejected near the $87,000 area, which may further suggest the risk of a short-term correction. The RSI has fallen below 30, into oversold territory, while the MACD averages have declined sharply; on the other hand, this could also leave room for a potential rebound toward $87,000 and above.
 Source: xStation5
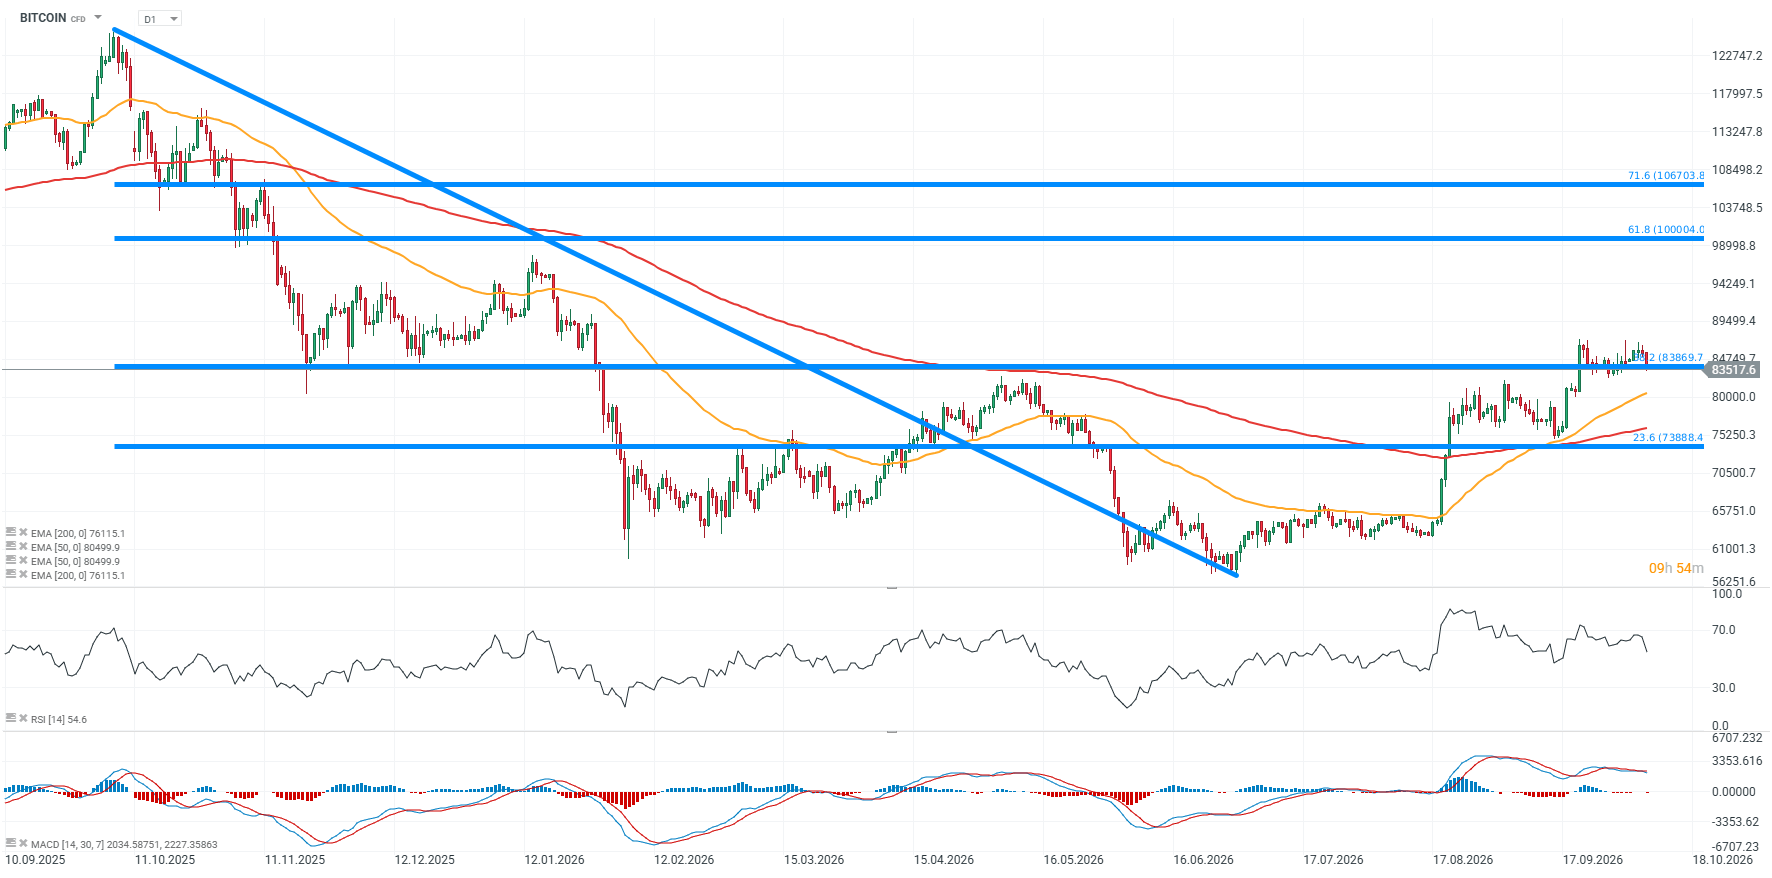
On the daily chart, Bitcoin is attempting to hold above the 38.2% Fibonacci retracement of the decline from autumn 2025, located near $84,000. The daily RSI remains close to neutral levels.
 Source: xStation5
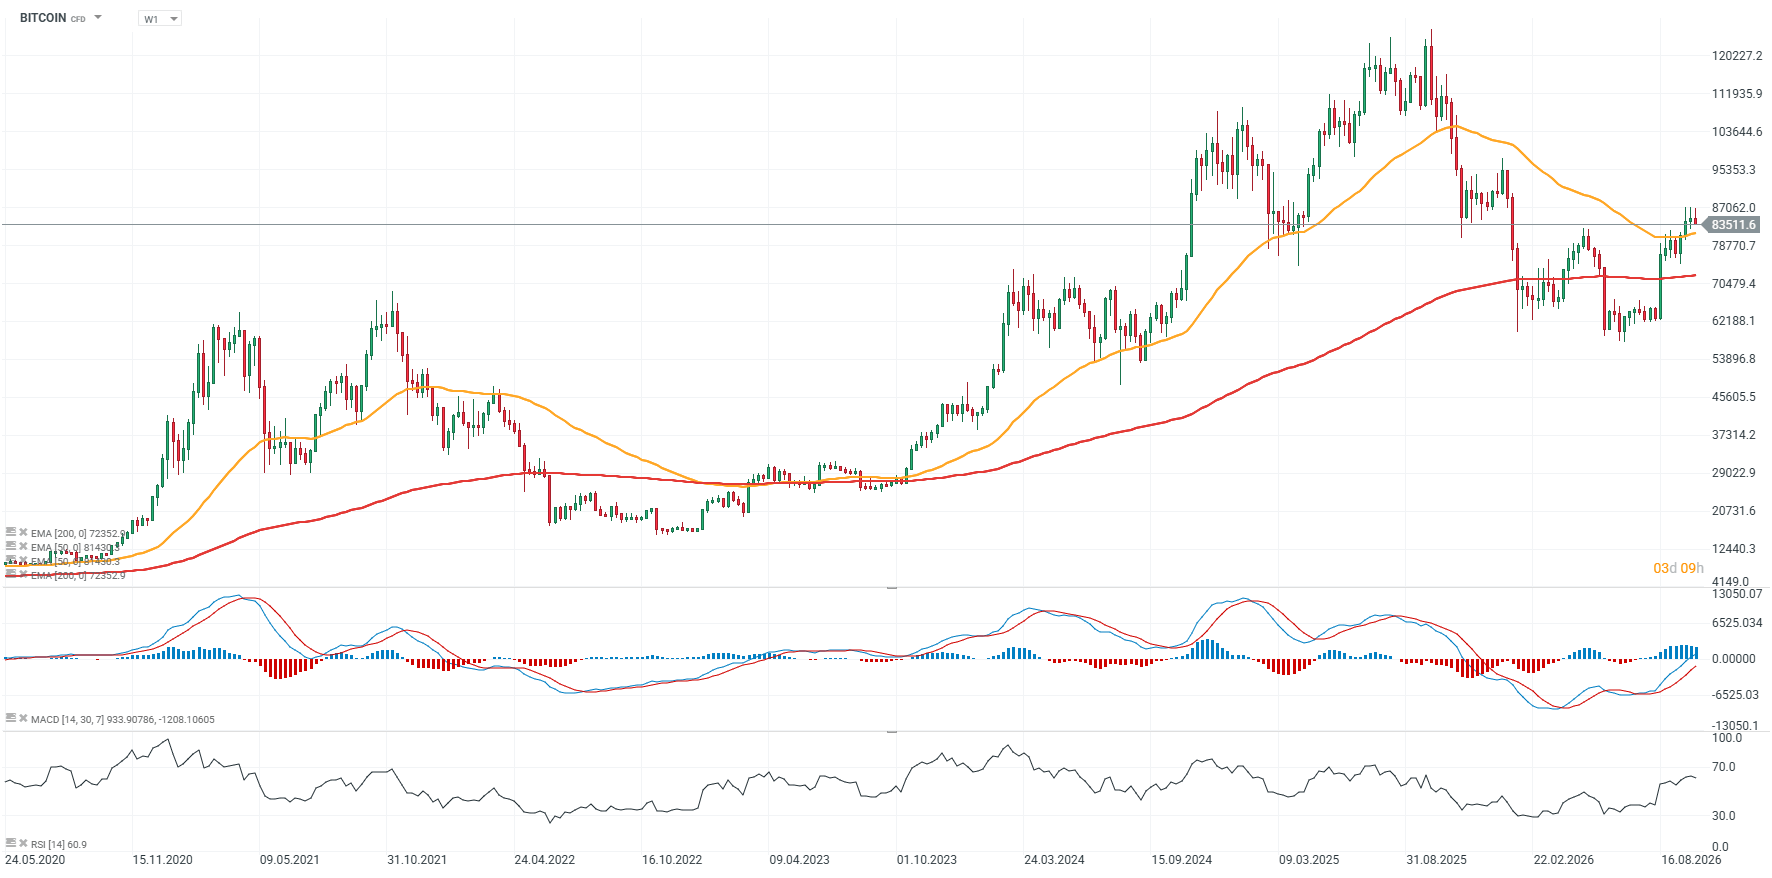
On the weekly chart, the price has broken above the 200-period EMA (red line), pointing to positive momentum on the broader timeframe. We can also see some similarities to the bottoming phase observed in 2022 and 2023.
 Source: xStation5
Could Bitcoin benefit from the post-midterm Wall Street pattern?
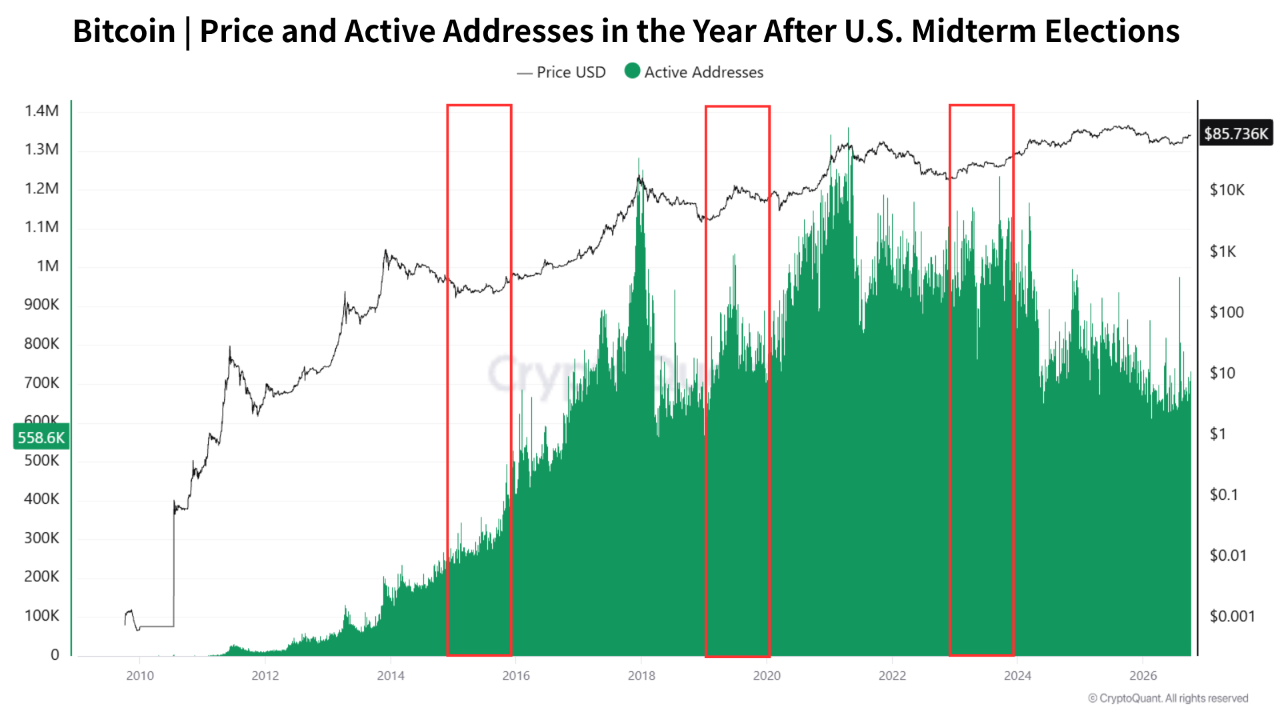
Equity-market history points to a strong seasonal pattern after US midterm elections. Since 1950, the S&P 500 has risen in all 19 twelve-month periods following midterms, with an average gain of 15.4%, while the third year of the presidential cycle has historically been the strongest. Bitcoin also performed well after the last three midterm cycles, gaining 24.5%, 44.9% and 92.3% over the following 12 months after the 2014, 2018 and 2022 elections.
That does not mean elections automatically trigger a Bitcoin bull market. The sample includes only three crypto cycles, and after the 2018 election Bitcoin fell 45.5% in the first month alone, highlighting how significant short-term volatility can be. In addition, active on-chain addresses are not the same as the number of buyers and do not directly measure ETF demand.
Liquidity and macro conditions remain far more important. With the US 10-year Treasury yield around 5.3% and regulatory uncertainty still elevated, a decline in political uncertainty alone may not be enough to support a sustained BTC rally. After the election, the key factors to watch will therefore be bond yields, the persistence of spot Bitcoin ETF inflows and progress on regulation — history provides useful context, but not a reliable investment rule.
Source: CryptoQuant
Bitcoin defies its historically weak start to October
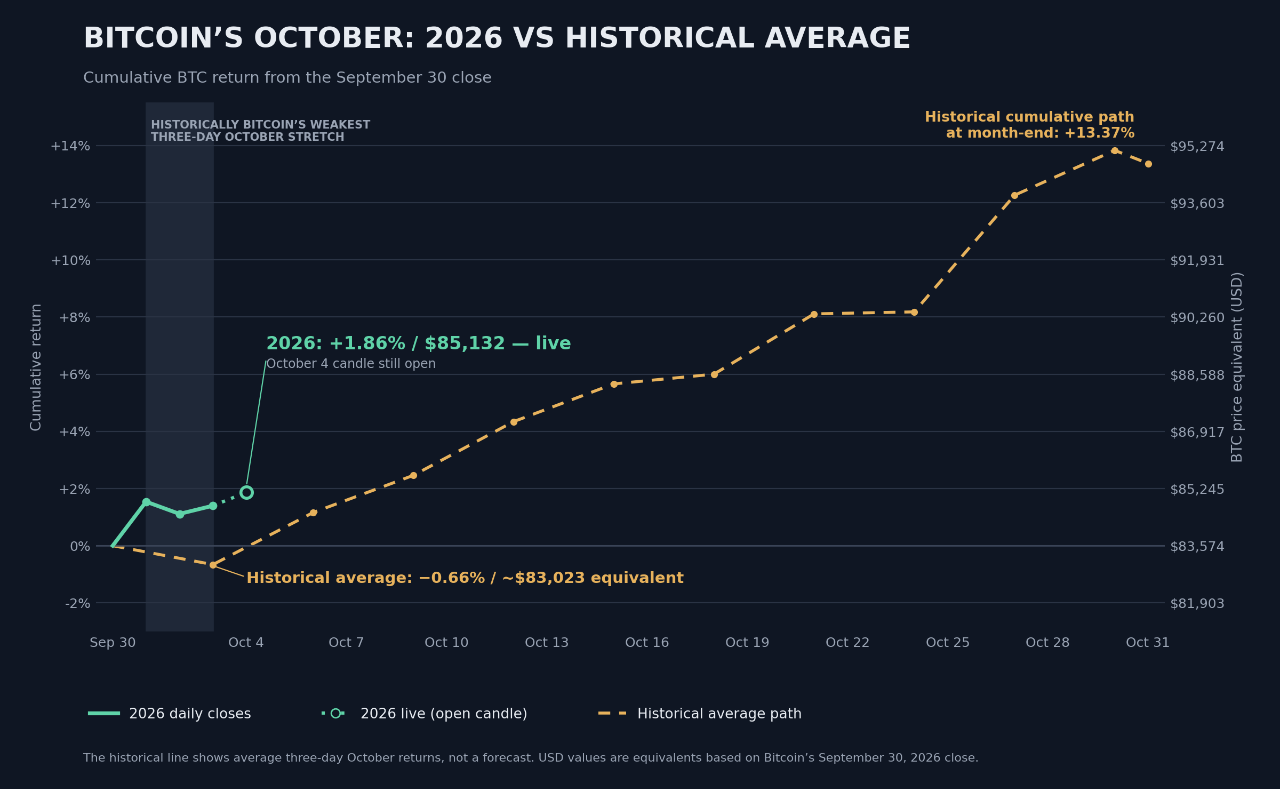
The first three days of October have historically been Bitcoin’s weakest three-day stretch of the month, with an average decline of 0.66%. It is also worth noting that September ended with a 6.4% gain, whereas historically the month has produced an average decline of around 4%. The start of October therefore continues to show relative strength versus Bitcoin’s typical seasonal pattern.
Source: CryptoQuant
Puell Multiple breaks out of the “discount zone”. Is miner pressure easing?
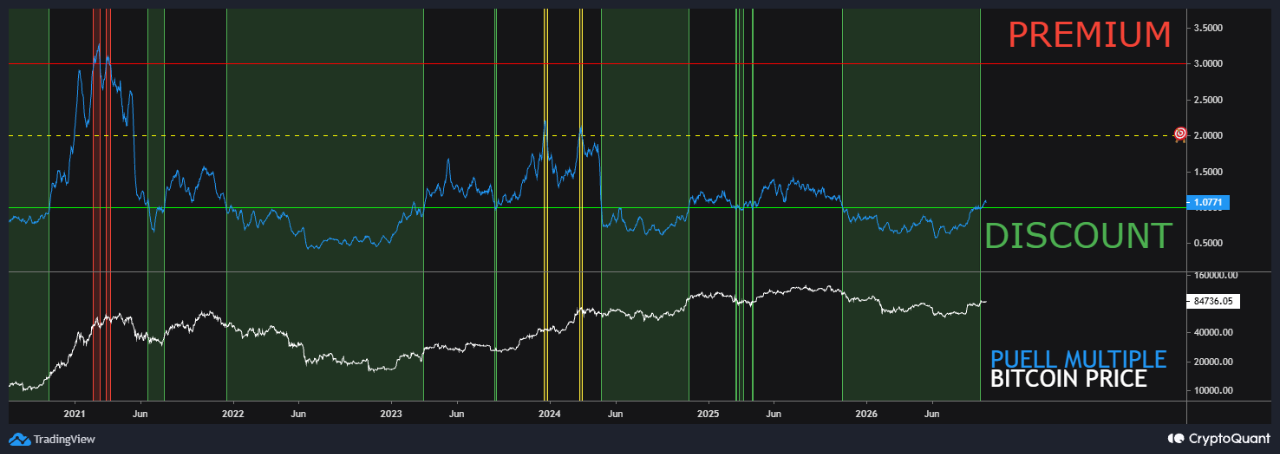
The seven-day average of the Puell Multiple has reached its highest level in around 11 months and moved back above 1 after spending close to 10 months below that threshold. Since November 2025, the indicator had remained in the so-called discount zone, which has historically often coincided with periods of relatively low Bitcoin valuation and accumulation following earlier declines.
A move above 1 may suggest that miner revenue conditions are beginning to improve relative to the one-year average, which can be consistent with a transition from an accumulation phase toward a stronger market trend. The next level watched by some analysts is around 2, but the Puell Multiple does not provide a reliable standalone BTC price target and should be viewed as one element of the broader on-chain picture rather than a direct bullish signal.
Source: CryptoQuant
Bitcoin at $157,000?
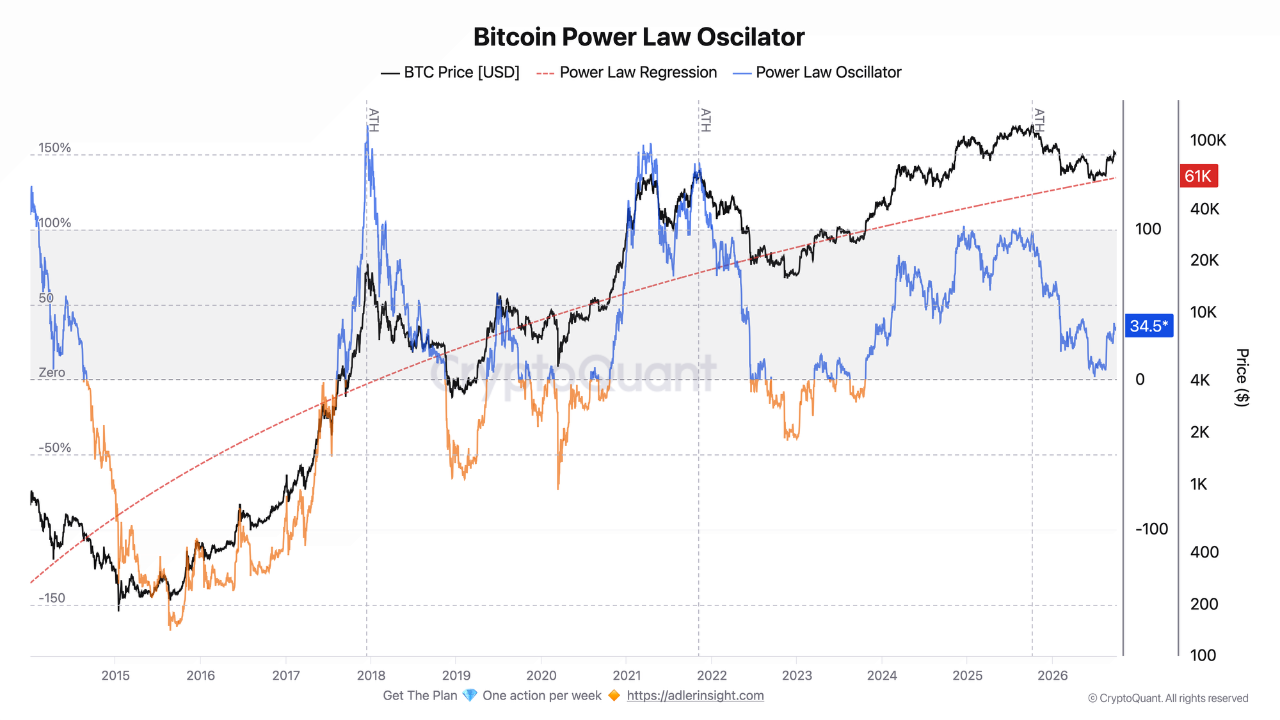
The Bitcoin valuation model known as the Power Law suggests that Bitcoin’s volatility around its long-term trend has gradually declined. Oscillator peaks fell from +169 in 2018 to +102 in 2025, while the standard deviation of daily changes decreased by around 49% over the same period, from 4.81 to 2.47 points.
As of October 3, with Bitcoin trading near $84,700, the oscillator stood at +34.5. Assuming the model’s parameters remain unchanged, a reading of +100 would correspond to a Bitcoin price of around $157,800. That is roughly 86% above the current price. This is not a price forecast, however, but a reference level derived from the model, and it would continue to move higher as the Power Law trend itself rises.
Source: CryptoQuant


📉 Gold loses 1.7%



US Open: Wall Street in the Red 🚩 Nasdaq Falls 1% From Record Highs, Constellation Brands Back at March 2020 Level


Wheat Rebounds? 📈 Weak U.S. Planting, Russian Exports Down 75%


Daily Summary: New Records on Wall Street. Markets Await the New Earnings Season
The content of this report has been created by XTB S.A., with its registered office in Warsaw, at Prosta 67, 00-838 Warsaw, Poland, (KRS number 0000217580) and supervised by Polish Supervision Authority ( No. DDM-M-4021-57-1/2005). This material is a marketing communication within the meaning of Art. 24 (3) of Directive 2014/65/EU of the European Parliament and of the Council of 15 May 2014 on markets in financial instruments and amending Directive 2002/92/EC and Directive 2011/61/EU (MiFID II). Marketing communication is not an investment recommendation or information recommending or suggesting an investment strategy within the meaning of Regulation (EU) No 596/2014 of the European Parliament and of the Council of 16 April 2014 on market abuse (market abuse regulation) and repealing Directive 2003/6/EC of the European Parliament and of the Council and Commission Directives 2003/124/EC, 2003/125/EC and 2004/72/EC and Commission Delegated Regulation (EU) 2016/958 of 9 March 2016 supplementing Regulation (EU) No 596/2014 of the European Parliament and of the Council with regard to regulatory technical standards for the technical arrangements for objective presentation of investment recommendations or other information recommending or suggesting an investment strategy and for disclosure of particular interests or indications of conflicts of interest or any other advice, including in the area of investment advisory, within the meaning of the Trading in Financial Instruments Act of 29 July 2005 (i.e. Journal of Laws 2019, item 875, as amended). The marketing communication is prepared with the highest diligence, objectivity, presents the facts known to the author on the date of preparation and is devoid of any evaluation elements. The marketing communication is prepared without considering the client’s needs, his individual financial situation and does not present any investment strategy in any way. The marketing communication does not constitute an offer of sale, offering, subscription, invitation to purchase, advertisement or promotion of any financial instruments. XTB S.A. is not liable for any client’s actions or omissions, in particular for the acquisition or disposal of financial instruments, undertaken on the basis of the information contained in this marketing communication. In the event that the marketing communication contains any information about any results regarding the financial instruments indicated therein, these do not constitute any guarantee or forecast regarding the future results.