


- Bitcoin has moved from approximately $62988 on 1 August to around $64500–$64800 on 6 August, without establishing a clear trend beyond its recent range.
- US spot Bitcoin ETFs attracted $626 million of net inflows between 3 and 5 August. BlackRock’s IBIT accounted for approximately $478.5 million, or 76% of that total.
- Strategy sold 1638 BTC for $104.73 million between 27 July and 2 August, leaving the company with 842138 BTC.
- Researchers estimate that the Coldcard incident affected more than 5200 addresses and involved approximately 1816 BTC, worth around $114 million to $116 million. These figures remain preliminary.

- Bitcoin has moved from approximately $62988 on 1 August to around $64500–$64800 on 6 August, without establishing a clear trend beyond its recent range.
- US spot Bitcoin ETFs attracted $626 million of net inflows between 3 and 5 August. BlackRock’s IBIT accounted for approximately $478.5 million, or 76% of that total.
- Strategy sold 1638 BTC for $104.73 million between 27 July and 2 August, leaving the company with 842138 BTC.
- Researchers estimate that the Coldcard incident affected more than 5200 addresses and involved approximately 1816 BTC, worth around $114 million to $116 million. These figures remain preliminary.
Bitcoin is trading close to $64500 on 6 August, compared with roughly $63000 on 1 August, while remaining inside a relatively narrow short-term range. The market has absorbed renewed US spot Bitcoin ETF inflows, Strategy’s latest BTC sale, the Coldcard seed-generation flaw and weaker mining conditions without a decisive breakout. Options markets also show subdued expectations, with 30-day implied-volatility measures close to 36%. This calm describes current market pricing rather than an absence of risk.
Why Bitcoin remains calm near $65000
Bitcoin remains calm because the positive and negative forces affecting the market are currently offsetting one another. ETF inflows provide observable demand through regulated products, while Strategy’s sale and other holders’ transactions add supply. At the same time, the Coldcard incident has raised security concerns without revealing a weakness in the Bitcoin protocol itself.
Daily price data illustrate this balance. Bitcoin recorded approximately $63000 on 1 August, $62500 on 3 August, $63600 on 4 August and $64000 on 5 August before moving toward $64500 on 6 August. The recovery is visible, but the movement has not yet become a sustained breakout.
Options markets provide stronger evidence for the description of a calm market. Bitcoin’s BVIV 30-day implied-volatility index fell to approximately 36% on 4 August, its lowest reading since 31 May, while the CME CF Bitcoin Volatility Index was also close to 36 on 6 August. Low implied volatility means options markets are pricing comparatively limited movement, but it does not predict the direction of the next move.
Bitcoin ETF inflows return, but demand is concentrated
US spot Bitcoin ETFs have returned to net inflows, although much of the new capital is entering one fund. The products recorded $170.1 million of net inflows on 3 August, $211.5 million on 4 August and $244.4 million on 5 August. The combined three-session total was $626 million.
BlackRock’s IBIT received $111.4 million, $170.3 million and $196.8 million during those sessions. Its combined $478.5 million represented approximately 76% of the group’s total inflows. The figures therefore show renewed demand for Bitcoin ETF exposure, but they also demonstrate that this demand remains concentrated.
The concentration is also visible at the other end of the market. Hashdex announced that its DEFI Bitcoin ETF, which had approximately $14.7 million under management on 30 July, will stop trading after 17 August and liquidate its remaining Bitcoin. Investors who still hold shares are expected to receive cash distributions around 28 August. Given the fund’s small size, the direct supply effect should be limited, but the closure shows that positive industry-wide flows do not benefit every product equally.
Positive Bitcoin ETF inflows can coexist with a nearly unchanged Bitcoin price. New demand from funds may be absorbed by corporate sales, profit-taking or other spot-market supply before it produces a larger price movement.
Strategy sold 1,638 BTC but retained a substantial position
Strategy’s latest sale was a visible supply event, but it did not represent a broad exit from Bitcoin. The company sold 1638 BTC between 27 July and 2 August for aggregate proceeds of $104.73 million. The average sale price was $63957 per BTC.
Of the proceeds, $52.4 million was used to fund dividends on Strategy’s preferred shares and $52.3 million funded repurchases of STRC stock. The transaction was therefore part of the company’s capital-management programme rather than a sale carried out solely in response to short-term Bitcoin price movements.
Following the transaction, Strategy reported holdings of 842138 BTC with an aggregate purchase cost of $63.51 billion. Its average acquisition price across the remaining position was $75419 per BTC. Further sales could create additional spot supply, but the scale and timing of any future transactions remain uncertain.
The Coldcard incident concerns wallet software, not Bitcoin’s protocol
The Coldcard incident resulted from weaknesses in seed generation on affected firmware rather than a breach of the Bitcoin network. Coinkite warned that seeds generated on specified versions of its Mk2, Mk3, Mk4, Mk5 and Q devices could contain less randomness than intended. Fixed firmware has now been released for the affected models and software tracks.
On-chain researchers estimated that four waves of suspicious transactions moved approximately 1816 BTC from more than 5200 addresses. The estimated value was around $114 million on 3 August and approximately $116 million in a later TRM Labs assessment. The totals are based partly on transaction-pattern analysis and should therefore be treated as preliminary rather than final confirmed losses.
Installing corrected firmware prevents the same problem from affecting seeds generated in the future, but it does not add randomness to an existing seed. Users with affected seeds must create a new seed using corrected firmware and migrate their funds. The event highlights implementation and private-key risks associated with self-custody, but it does not indicate that Bitcoin’s consensus rules or underlying cryptography were compromised.
The incident has also prompted a broader review of Bitcoin-related software. An AI-assisted campaign involving 16 developers reported 4962 findings across 390 wallets, cryptographic libraries and infrastructure projects, including 85 classified as critical and 635 as high severity. These are early, partly automated findings that still require validation, and they should not be described as 85 confirmed vulnerabilities in Bitcoin Core.
Updating affected Coldcard firmware does not repair an existing vulnerable seed. Coinkite advises generating a replacement seed on corrected firmware, verifying the new wallet and moving the funds carefully, beginning with a small test transaction.
Bitcoin mining difficulty points to pressure on miners
Bitcoin’s mining data show weaker competition among miners than at the market’s previous peak. The current network difficulty is approximately 126.23 trillion following a 0.74% downward adjustment. That is around 14% below the highest level recorded in 2026 and 19.1% below the November 2025 record.
Mining difficulty adjusts every 2,016 blocks to keep the average interval between blocks close to 10 minutes. When computing power leaves the network and blocks are produced more slowly, the next adjustment reduces the difficulty faced by the miners that remain. The latest decline therefore indicates reduced mining competition during the previous adjustment period.
Difficulty was also approximately 1.1% below its year-earlier level, only the second year-on-year decline reported in Bitcoin’s history. Mining analysts have linked the contraction to weak mining revenues, regional disruptions and the movement of some energy and capital toward artificial-intelligence and high-performance-computing infrastructure. Lower difficulty eases conditions for remaining miners, but it also reflects continuing pressure on the economics of the sector.
.Institutional Flows and Bitcoin Supply
Institutional demand currently provides mixed signals for Bitcoin. US spot Bitcoin ETFs have recently recorded positive net flows following an earlier period of withdrawals, with BlackRock’s fund accounting for a significant share of the new capital. These flows are an observable measure of demand through regulated investment products, but their direction can change between trading sessions.
Strategy’s sale of 1683 BTC introduced additional supply to the market. The transaction was valued at approximately $105 million and followed two other reported sales in recent weeks. Although the company still holds the largest corporate Bitcoin position, further sales could affect short-term liquidity, particularly during periods of lower trading activity.
The reported Coinkite wallet breach also added a security-related event to the current market environment. Bitcoin worth almost $90 million was reportedly stolen, highlighting operational risks associated with wallet infrastructure and private-key management rather than a change to the Bitcoin protocol itself.
Price Structure and Historical Market Patterns
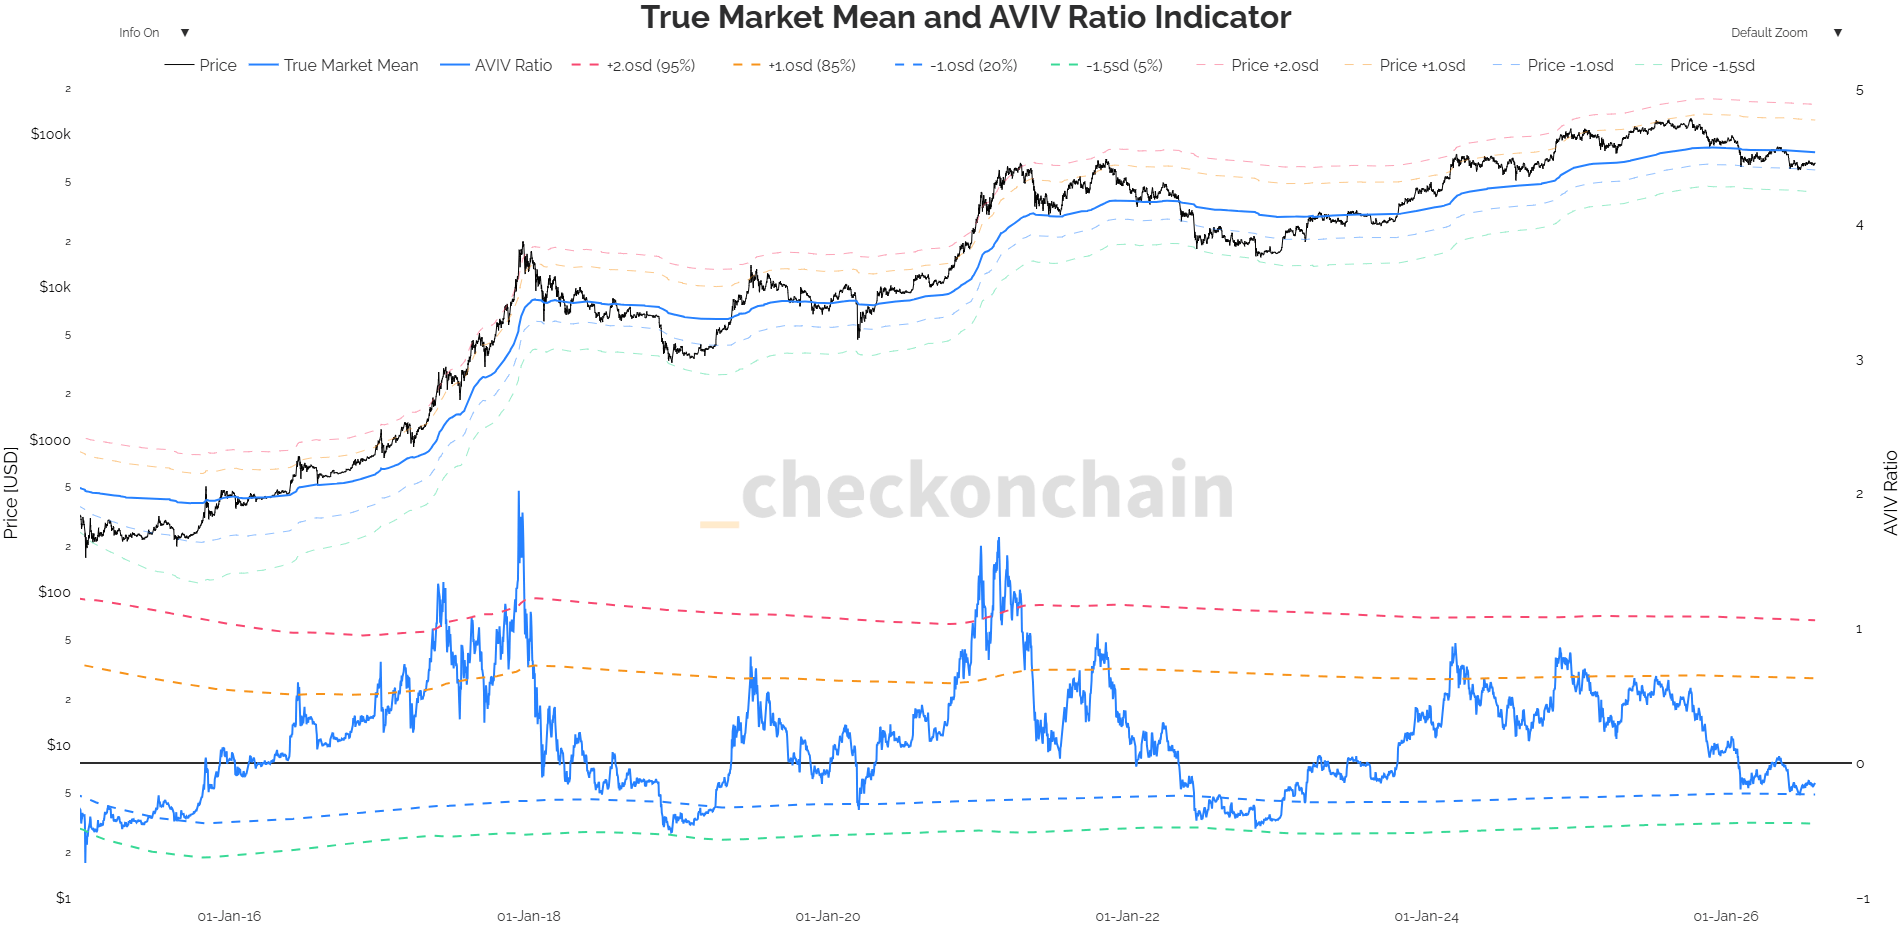
Bitcoin is currently trading below the True Market Mean, while the AVIV Ratio remains slightly below zero, indicating that the market price is below the model’s estimated average cost basis for active investors. However, the ratio remains above the −1.0 and −1.5 standard-deviation thresholds, meaning that the chart does not yet indicate the degree of valuation pressure observed during some previous bear-market phases.
The corresponding −1.5 standard-deviation price band is currently located at approximately $45,000. Historically, moves toward this band have coincided with periods of pronounced market stress and relatively low valuations, although they have not consistently identified the precise timing or level of Bitcoin’s cycle bottom.
Previous four-year cycles indicate that a recovery phase could begin toward the end of the year, but this pattern is descriptive rather than predictive. Until Bitcoin breaks above its main resistance levels alongside stronger spot-market activity, the price structure is likely to remain defined by consolidation between established support and resistance zones.
On the daily chart, the Relative Strength Index remains neutral at slightly above 50. Meanwhile, the MACD crossover could point to weakening momentum unless buying demand strengthens from current levels.
Based on the price action and key Fibonacci retracement levels, $60000 and $57000 represent the nearest support areas. From a price-action perspective, $66500 is an important resistance zone, defined by two previous local highs and the upper boundary of an ascending triangle formation. A decisive break above $66500 could open the way for a test of $73000, corresponding to the 23.6% Fibonacci retracement level. Conversely, if Bitcoin fails to move above this resistance area, the probability of another test of $60000 could increase.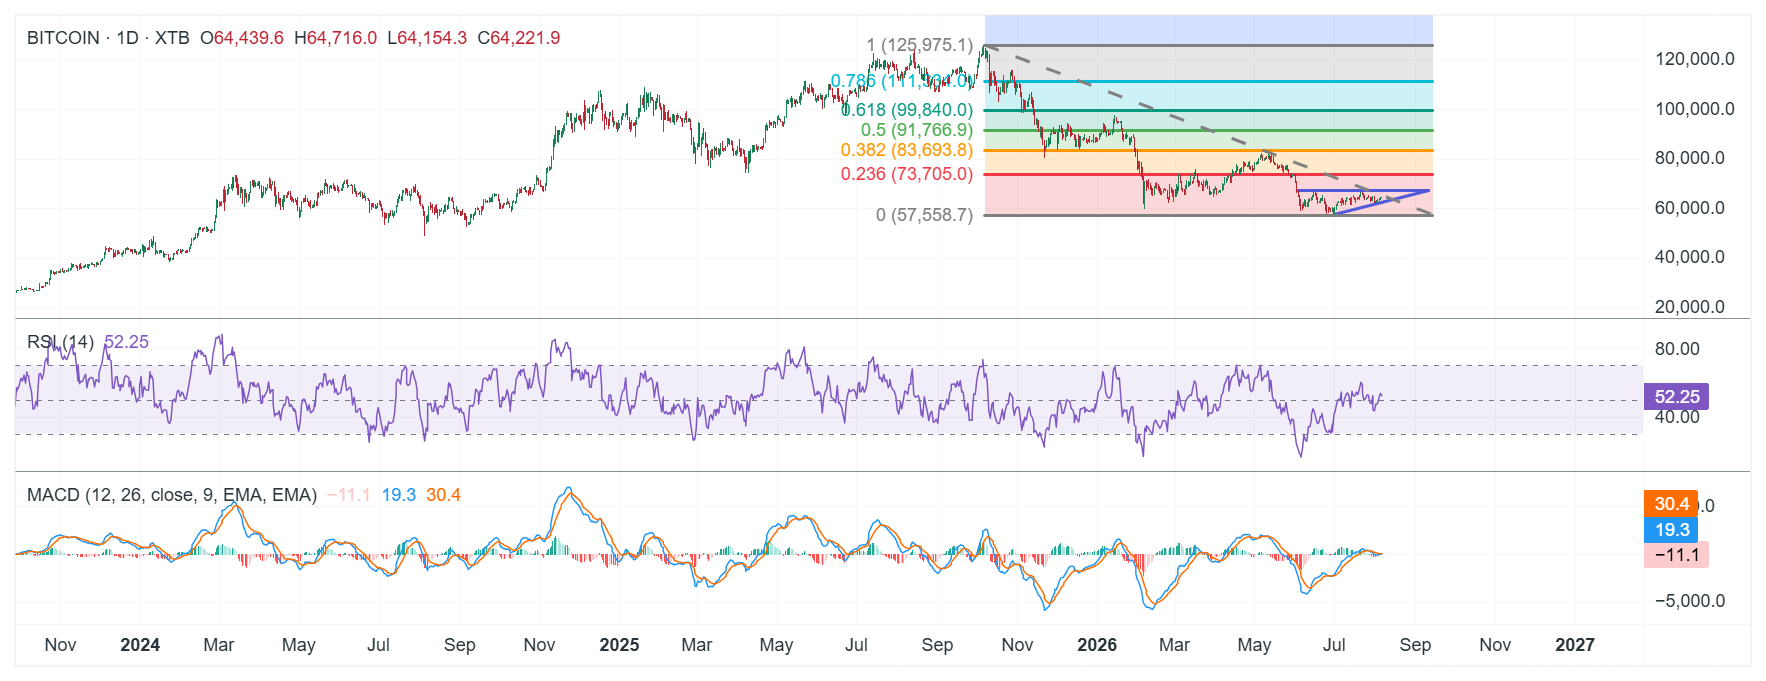 Source: xStation, Tradingview
 Source: Checkonchain


Tesla was supposed to burn $5 billion, but posted a positive result. Will Tesla still be a car company in a year?


Record-breaking Meta, though with a cash loss. Investors (for now) are buying Zuckerberg's plan anyway



Daily Summary: SpaceX and the tech sector drive Wall Street, oil retreats sharply below $97

US OPEN: Preparations for Tesla's mega-merger with SpaceX. Diplomatic stalemate with Iran cools Wall Street's enthusiasm
The content of this report has been created by XTB S.A., with its registered office in Warsaw, at Prosta 67, 00-838 Warsaw, Poland, (KRS number 0000217580) and supervised by Polish Supervision Authority ( No. DDM-M-4021-57-1/2005). This material is a marketing communication within the meaning of Art. 24 (3) of Directive 2014/65/EU of the European Parliament and of the Council of 15 May 2014 on markets in financial instruments and amending Directive 2002/92/EC and Directive 2011/61/EU (MiFID II). Marketing communication is not an investment recommendation or information recommending or suggesting an investment strategy within the meaning of Regulation (EU) No 596/2014 of the European Parliament and of the Council of 16 April 2014 on market abuse (market abuse regulation) and repealing Directive 2003/6/EC of the European Parliament and of the Council and Commission Directives 2003/124/EC, 2003/125/EC and 2004/72/EC and Commission Delegated Regulation (EU) 2016/958 of 9 March 2016 supplementing Regulation (EU) No 596/2014 of the European Parliament and of the Council with regard to regulatory technical standards for the technical arrangements for objective presentation of investment recommendations or other information recommending or suggesting an investment strategy and for disclosure of particular interests or indications of conflicts of interest or any other advice, including in the area of investment advisory, within the meaning of the Trading in Financial Instruments Act of 29 July 2005 (i.e. Journal of Laws 2019, item 875, as amended). The marketing communication is prepared with the highest diligence, objectivity, presents the facts known to the author on the date of preparation and is devoid of any evaluation elements. The marketing communication is prepared without considering the client’s needs, his individual financial situation and does not present any investment strategy in any way. The marketing communication does not constitute an offer of sale, offering, subscription, invitation to purchase, advertisement or promotion of any financial instruments. XTB S.A. is not liable for any client’s actions or omissions, in particular for the acquisition or disposal of financial instruments, undertaken on the basis of the information contained in this marketing communication. In the event that the marketing communication contains any information about any results regarding the financial instruments indicated therein, these do not constitute any guarantee or forecast regarding the future results.