
The largest of the cryptocurrencies started the rally as shares of First Republic Bank (FRC.US) slid nearly 50% yesterday following a quarterly report that showed nearly $100 billion in deposit outflows in Q1 2022. Bitcoin surpassed $29,000 and Ethereum is near $1,900. The gains were also helped by better-than-expected results from Alphabet (GOOGL.US) and Microsoft (MSFT.US), which could mean that the technology sector (US100) will do better than companies in the financial sector (US500). Bitcoin's rebound has also pushed up the prices of many altcoins including Cardano, Dogecoin:
- In view of the recent reaction, many analysts in the cryptocurrency sector have indicated that decentralized Bitcoin could be seen as a 'safe haven' asset in an environment of weakness in centralized finance
- Yesterday's reaction of Bitcoin showed that the increases of the second half of March may 'not have been accidental' and BTC is indeed starting to be perceived by the market as a 'hedge' against uncertainty in the banking sector
- According to Standard Chartered analysts, Bitcoin's dominance in the crypto world may be growing putting pressure on altcoin listings. Bitcoin accounts for nearly 45% of the value of the cryptocurrency market. Standard Chartered says it will eventually account for as much as 55-60%
- The bank's analysis also underscored that the 'BTC economy' lacked the necessary 'confidence' for the banking sector, and stress among BTC miners has subsided, in the face of mining costs of $15,000. This took much of the pressure off the cryptocurrency's quotations.
Could bitcoin have formed the bottom of the cycle?
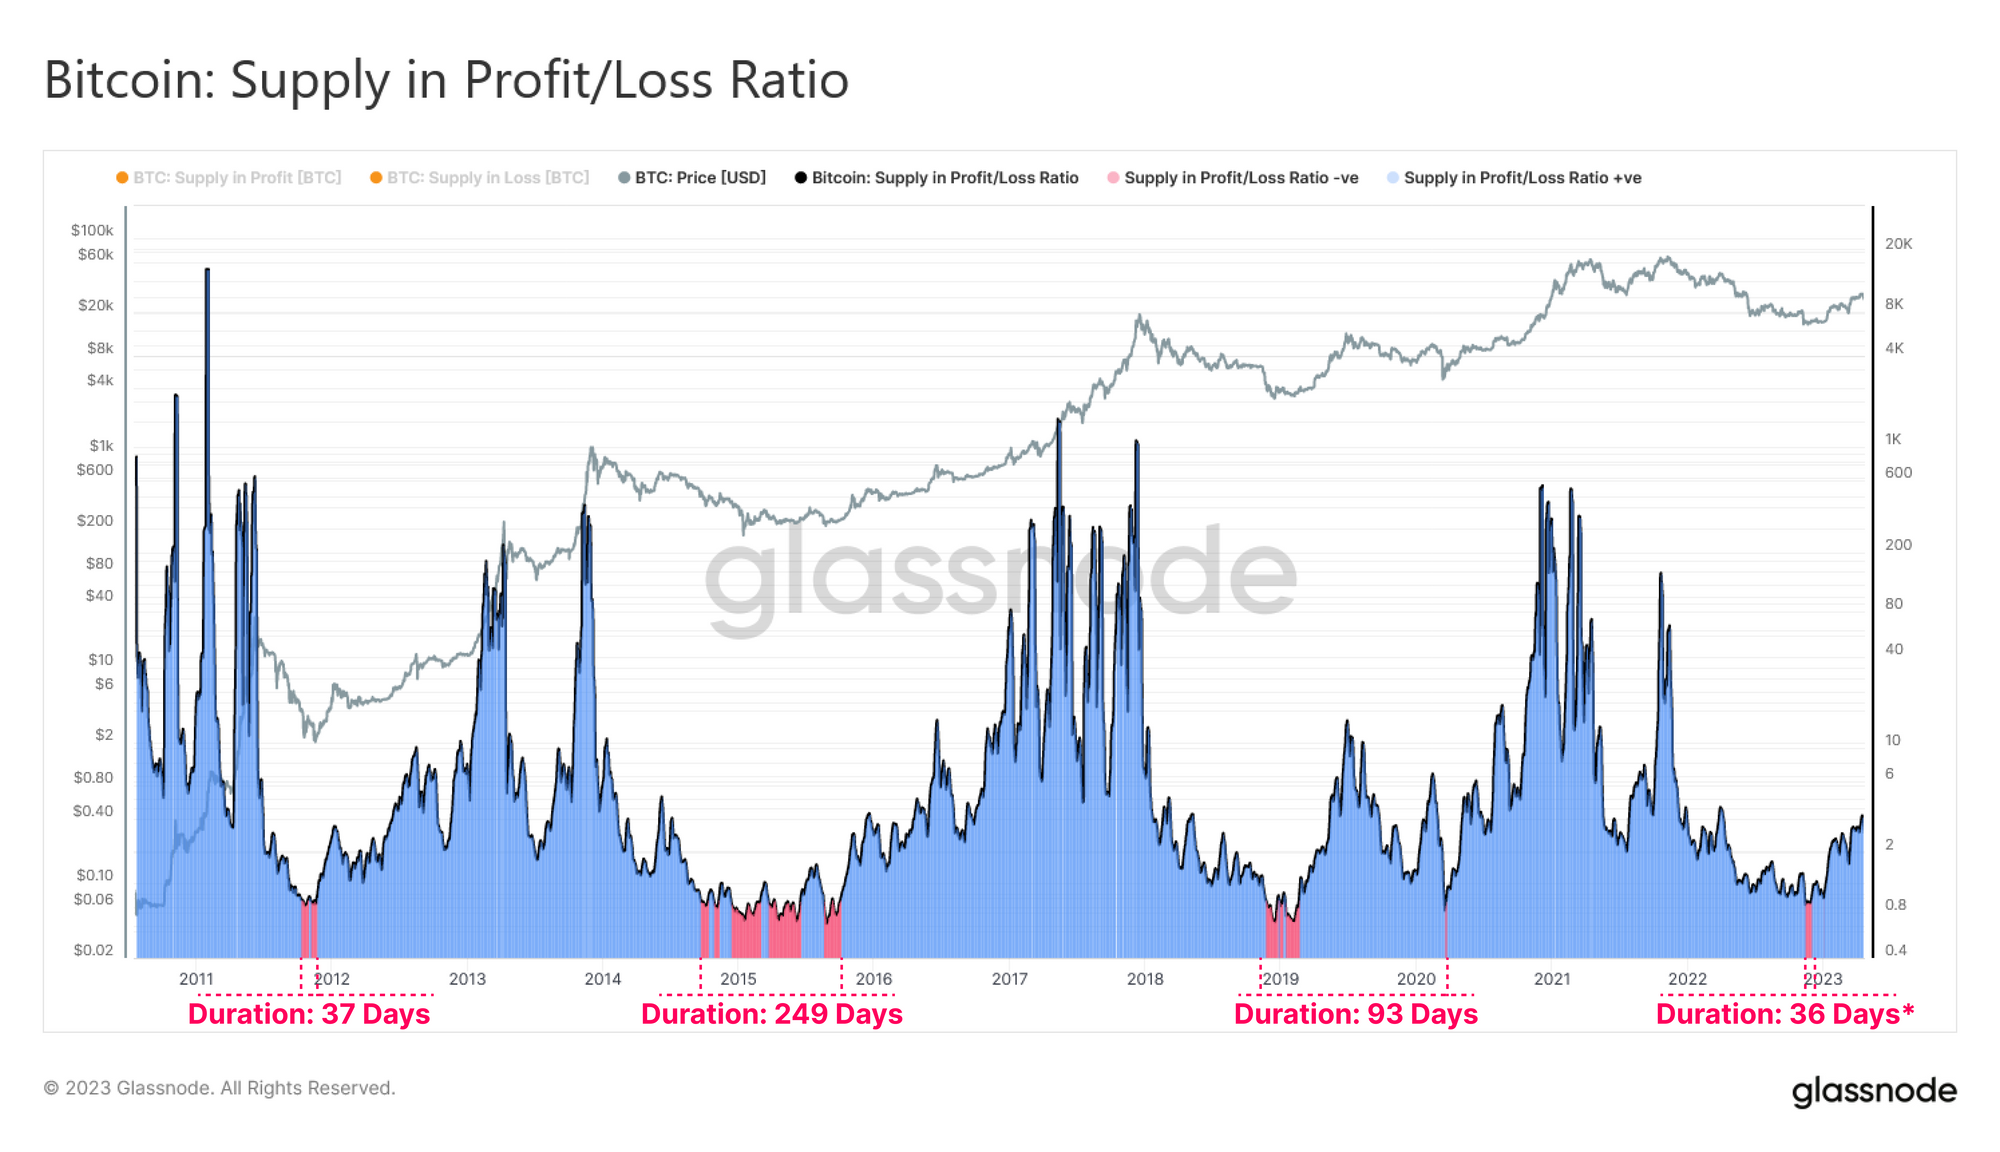 Glassnode measured the ratio between BTC supply in gain and supply in loss. Glassnode's on-chain analysis indicates that the ratio reached a so-called 'escape velocity' coming out of a loss-dominated period (the bottom of the cycle), which historically occurred for 415 out of 4638 total BTC trading days (about 9%). This period in 2022 was the shortest of all previous cycles. Source: Glassnode
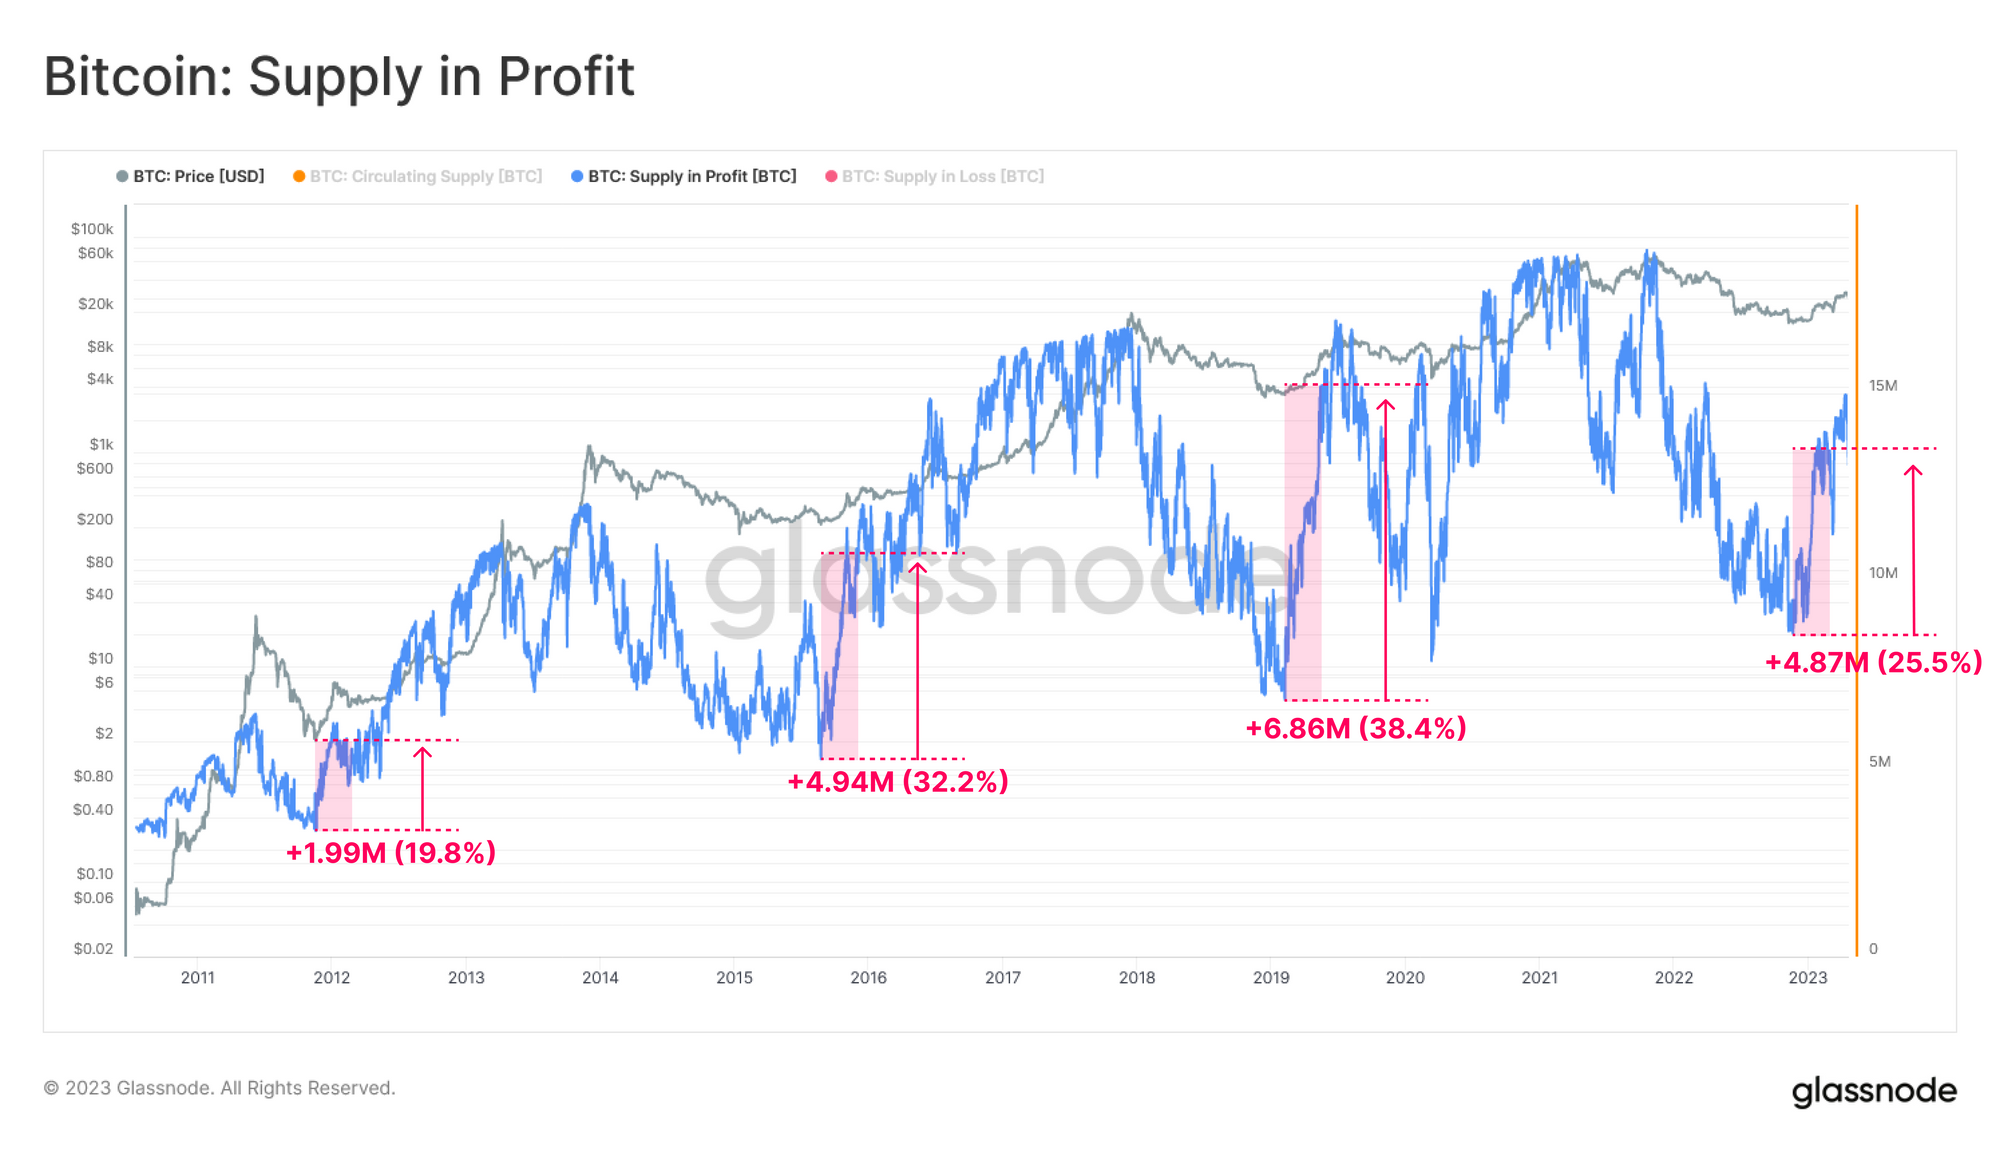 The largest rebounds in unrealized profits occur when the BTC price exceeds key levels for supply (e.g. levels of cycle bottoms). Glassnode attempts to check these levels by analyzing the 100-day change in profitable BTC supply coming out of the bottoms in previous cycles. Showing a rebound in both the amount of 'profitable' BTC and the % share of total supply:
- 2011: +1.99M BTC (19.8%)
- 2015: +4.94m BTC (32.2%)
- 2019: +6.86m BTC (38.4%)
- 2022: +4.87M BTC (25.5%)
The on-chain data indicates that the amount of supply that has surged into unrealized gains in the current cycle is as steep as in previous cycles. This may indicate a solid bottom formed below $20,000.
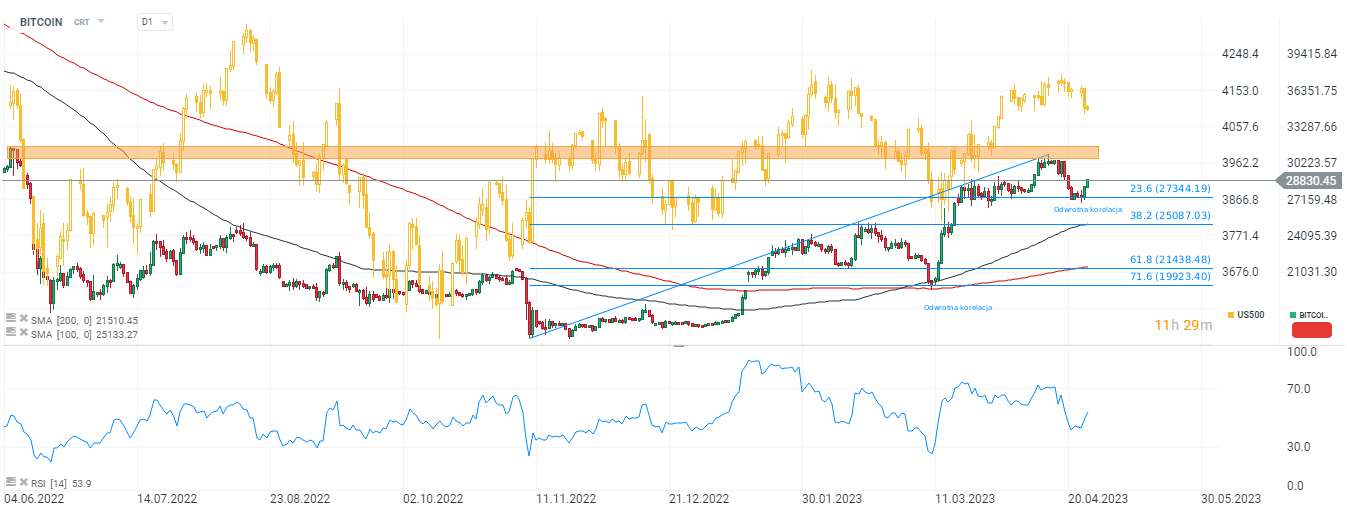 Bitcoin chart, D1 interval and US500 (yellow chart). Bitcoin again showed a negative correlation with the S&P500 and started an upward movement when US500 contracts weakened, influenced by weakness in the banking sector. The RSI indicator is still at relatively neutral levels indicating that the bulls still have plenty of room to possibly continue their attack. The first significant resistance level appears to be around $30,000 - $31,000, last seen in early summer 2022. The bulls has defended the bullish momentum at 23,6 Fibonacci retracement. Source: xStation5

Bitcoin Climbs Above $66,000 as ETF Flows Recover but Glassnode Warns of Higher Volatility

Morning Wrap: Oil Climbs Back Above $90 as Chinese AI Weighs on Tech Stocks.

Morninga Wrap: Wall Street Under Pressure. AI Loses Momentum, Netflix Disappoints, and the Persian Gulf Erupts

Daily Summary: 📉 A Red Day Across Markets. AI Sector Weighs on Wall Street, Precious Metals Under Pressure
The content of this report has been created by XTB S.A., with its registered office in Warsaw, at Prosta 67, 00-838 Warsaw, Poland, (KRS number 0000217580) and supervised by Polish Supervision Authority ( No. DDM-M-4021-57-1/2005). This material is a marketing communication within the meaning of Art. 24 (3) of Directive 2014/65/EU of the European Parliament and of the Council of 15 May 2014 on markets in financial instruments and amending Directive 2002/92/EC and Directive 2011/61/EU (MiFID II). Marketing communication is not an investment recommendation or information recommending or suggesting an investment strategy within the meaning of Regulation (EU) No 596/2014 of the European Parliament and of the Council of 16 April 2014 on market abuse (market abuse regulation) and repealing Directive 2003/6/EC of the European Parliament and of the Council and Commission Directives 2003/124/EC, 2003/125/EC and 2004/72/EC and Commission Delegated Regulation (EU) 2016/958 of 9 March 2016 supplementing Regulation (EU) No 596/2014 of the European Parliament and of the Council with regard to regulatory technical standards for the technical arrangements for objective presentation of investment recommendations or other information recommending or suggesting an investment strategy and for disclosure of particular interests or indications of conflicts of interest or any other advice, including in the area of investment advisory, within the meaning of the Trading in Financial Instruments Act of 29 July 2005 (i.e. Journal of Laws 2019, item 875, as amended). The marketing communication is prepared with the highest diligence, objectivity, presents the facts known to the author on the date of preparation and is devoid of any evaluation elements. The marketing communication is prepared without considering the client’s needs, his individual financial situation and does not present any investment strategy in any way. The marketing communication does not constitute an offer of sale, offering, subscription, invitation to purchase, advertisement or promotion of any financial instruments. XTB S.A. is not liable for any client’s actions or omissions, in particular for the acquisition or disposal of financial instruments, undertaken on the basis of the information contained in this marketing communication. In the event that the marketing communication contains any information about any results regarding the financial instruments indicated therein, these do not constitute any guarantee or forecast regarding the future results.