
Blackrock reported results for 2Q24, which overall were both better in all key figures than the previous year and solidified positive trends continuing into early 2024.
FINANCIAL RESULTS FOR 2Q24:
- AUM: $10.65 trillion (+13% y/y)
- Average AUM: $10.46 trillion (+14% y/y)
- Revenue: $4.81 billion (+8% y/y)
- Total net inflows: $81.57 billion (+1.7% y/y)
- Adjusted operating profit: $1.88 billion (+12% y/y)
- Operating profit margin: 44.1% (vs. 42.5% a year earlier)
- Adjusted net profit: $1.55 billion (+11% y/y)
- Adjusted diluted EPS: $10.36 (+12% y/y)
The strong performance of the stock market and the ongoing bull market in the US supported the fund's performance, which also benefited strongly from increased movement in the investment area. The company reported a record $10.65 trillion in AUM, $1.22 trillion more than a year earlier and $0.18 trillion more than in the previous quarter. The fund recorded the strongest net inflows in the ETF segment, with total inflows of $83.14 billion. Equity market-related ETFs were the strongest performers, accounting for more than half of this amount ($44.45 billion in net inflows). In second place were fixed income ETFs, which recorded $34.49 billion in inflows. The change in AUM in this segment was influenced by the weaker condition of the bond market, which continued to lose compared to Q1, and movements in the foreign exchange market. The total impact of currency fluctuations in all segments was -$35.445 billion). Meanwhile, AUM increased by $123 billion due to market changes.
The record AUM was also reflected in the company's revenues, which rose to $4.805 billion (+8% y/y). Revenue was supported primarily by growth in base fee income. Organic growth in base fees was 9% year-on-year. Instead, the fund recorded a decline in fees related to lending financial instruments, driven by lower spreads.
The company's total operating expenses increased at a slower pace (by 5.5% y/y), thanks to the low growth in labor-related costs, which account for about 50% of the company's total operating expenses. As a result, the company maintained the positive trend in operating margin growth, resulting in a record margin since 2Q22 of 44.1%.
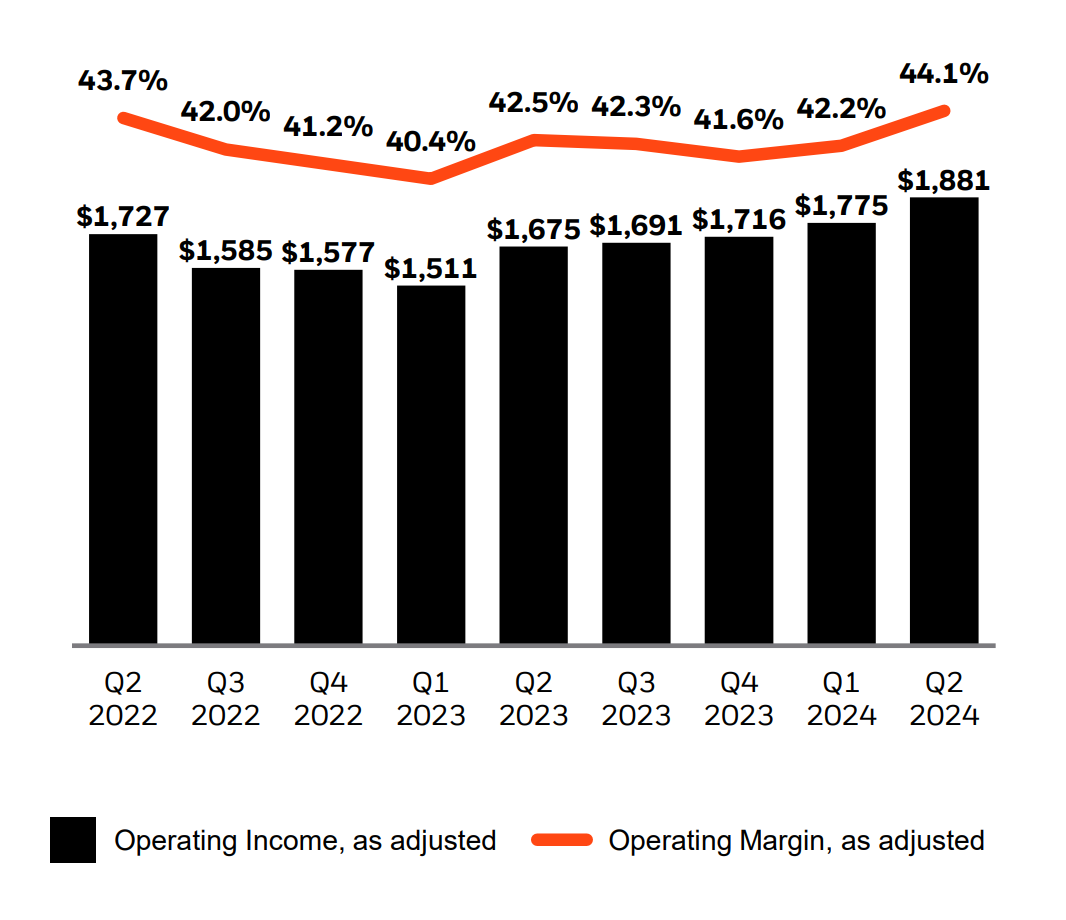
Adj. Operating income (in mln $) and adj. Operating margin. Source: Blackrock
Excluding 3Q23 adjusted EPS reached a record high of $10.36 in the quarter. In addition to the surge in 3Q23, the fund maintains stable q/q net profit growth at an average of 5.25%.
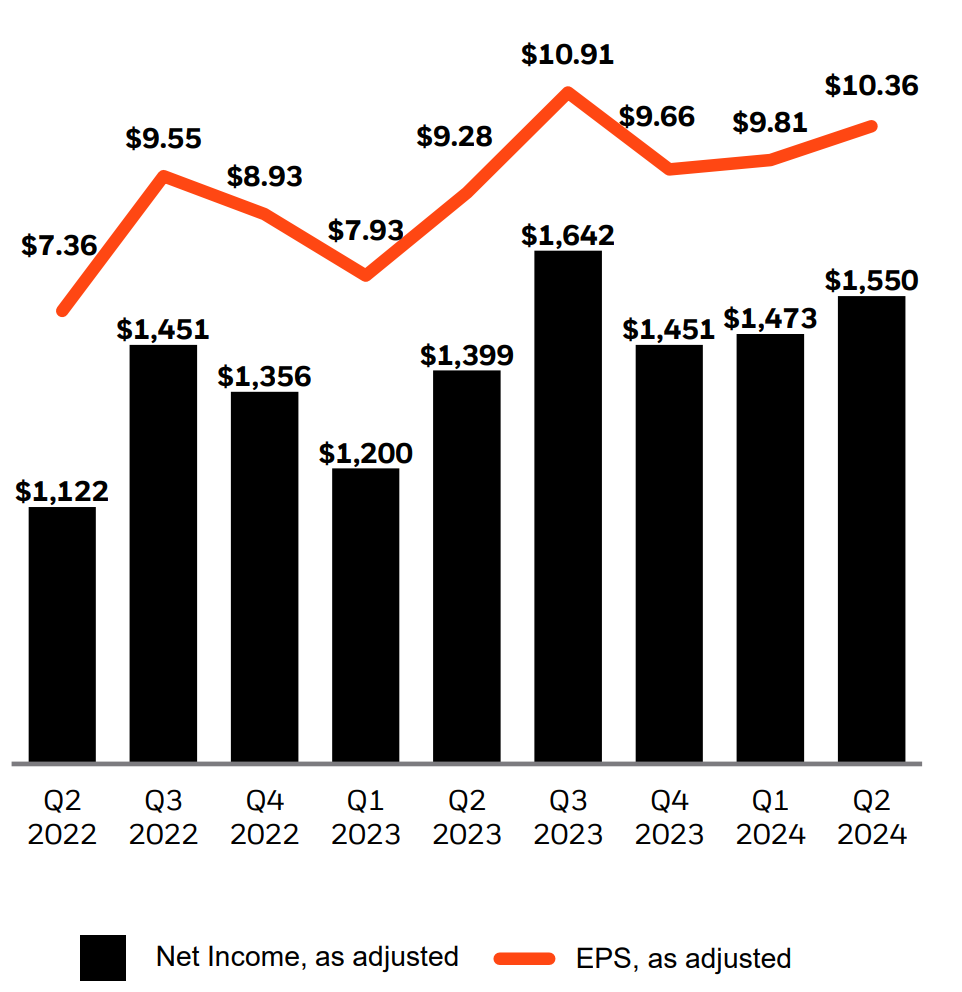
Adj. Net income (in mln $) and adj. EPS. Source: Blackrock
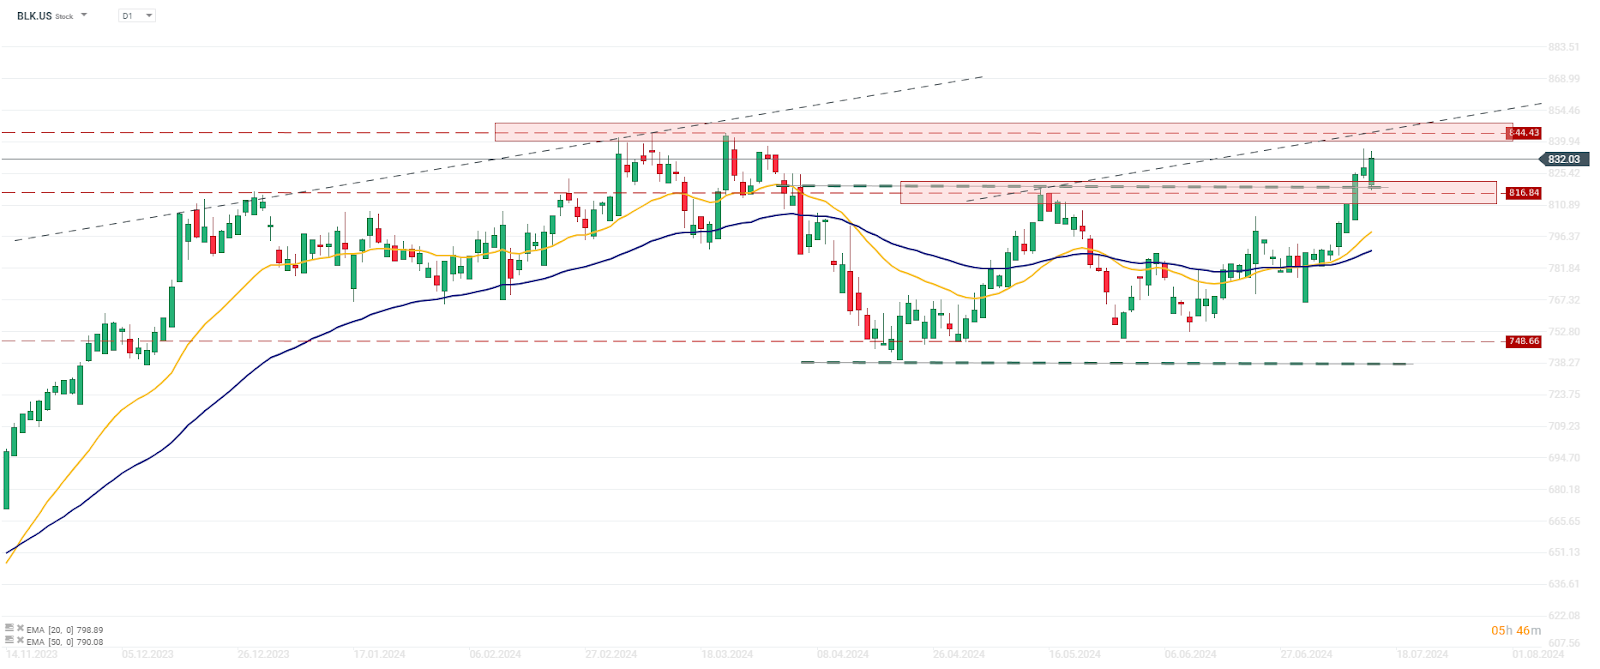
The company's strong results cemented the short-term uptrend that had been in place since the beginning of the month. The company also broke through the limit of the sideways trend it had been in since the beginning of April, located at around $816. Now, an important resistance level will be around $844, set by the local peaks of February and March 2024. In addition, this resistance is reinforced by the slope of the upward trend line, where the company's stock price was in the December-March 2024 period. If the stock can break out of it, bulls can count on the continuation of the positive trend and a stronger signal for the company to enter the upward trend. Source: xStation

Daily Summary: 📉 A Red Day Across Markets. AI Sector Weighs on Wall Street, Precious Metals Under Pressure

Stock of the Week: ASML – The Machines Driving the Future of Semiconductors

Netflix down 45% from its peak 🚩 What will the streaming giant's earnings reveal?

US Open: Blood on Wall Street as Semiconductor Sector Extends Correction
The content of this report has been created by XTB S.A., with its registered office in Warsaw, at Prosta 67, 00-838 Warsaw, Poland, (KRS number 0000217580) and supervised by Polish Supervision Authority ( No. DDM-M-4021-57-1/2005). This material is a marketing communication within the meaning of Art. 24 (3) of Directive 2014/65/EU of the European Parliament and of the Council of 15 May 2014 on markets in financial instruments and amending Directive 2002/92/EC and Directive 2011/61/EU (MiFID II). Marketing communication is not an investment recommendation or information recommending or suggesting an investment strategy within the meaning of Regulation (EU) No 596/2014 of the European Parliament and of the Council of 16 April 2014 on market abuse (market abuse regulation) and repealing Directive 2003/6/EC of the European Parliament and of the Council and Commission Directives 2003/124/EC, 2003/125/EC and 2004/72/EC and Commission Delegated Regulation (EU) 2016/958 of 9 March 2016 supplementing Regulation (EU) No 596/2014 of the European Parliament and of the Council with regard to regulatory technical standards for the technical arrangements for objective presentation of investment recommendations or other information recommending or suggesting an investment strategy and for disclosure of particular interests or indications of conflicts of interest or any other advice, including in the area of investment advisory, within the meaning of the Trading in Financial Instruments Act of 29 July 2005 (i.e. Journal of Laws 2019, item 875, as amended). The marketing communication is prepared with the highest diligence, objectivity, presents the facts known to the author on the date of preparation and is devoid of any evaluation elements. The marketing communication is prepared without considering the client’s needs, his individual financial situation and does not present any investment strategy in any way. The marketing communication does not constitute an offer of sale, offering, subscription, invitation to purchase, advertisement or promotion of any financial instruments. XTB S.A. is not liable for any client’s actions or omissions, in particular for the acquisition or disposal of financial instruments, undertaken on the basis of the information contained in this marketing communication. In the event that the marketing communication contains any information about any results regarding the financial instruments indicated therein, these do not constitute any guarantee or forecast regarding the future results.