
Chinese indices have recorded another wave of declines, with the CHN.cash benchmark trading 3.3% lower. The benchmark approached the 2022 panic bottom at 5000 points, previously seen in 2009. The pullback in Hong Kong-listed stocks has pushed the discount to the mainland China index to its highest level in fifteen years. Investors fear this is a sign of the 'capitulation' of foreign investment capital that has flowed into companies, listed in Hong Kong, over the years. The People's Bank of China (PBoC) once again kept short- and long-term interest rates unchanged, at 3.45% and 4.25%, respectively. Investors perceived the PBoC's decision as disappointing, as China's economy is struggling with a number of problems including deflation, which according to Bloomberg analysts could last until mid-2024.
- With the central bank's 'restrictive' stance persisting for the past five months, the market fears that a significant amount of debt instruments could take on a snowball effect and plunge indebted Chinese real estate-related companies. Analysts at UBS have suggested that the modest gains from the People's Bank of China's policy loosening so far have already been priced in, and stronger programs are needed to revive indexes. Meanwhile, there is no such action from Chinese authorities on the horizon;
- A small-cap index, the CSI 500 particularly sensitive to debt and real estate market concerns, fell more than 3% today. The Asian session was once again led by the real estate development sector, which may prove to be systemically vulnerable to higher interest rate levels, with dormant demand and a significant amount of debt.
- Foreign investment in Chinese equities, at 2023, was the lowest since 2009, and the investment climate is becoming an increasingly popular reason to reduce exposure to China. China Resources Land shares were down nearly 10%. The technology sector also performed poorly, with Tencent and Alibaba deepening declines. Regulatory actions have also been questionable recently, after China's largest brokerage Citc banned short selling and raised thresholds for institutional investors. The market perceived the decision as further evidence of weakness and an attempt to stem declines.
CHN.cash chart (W1)
Looking at the weekly chart of Hang Seng futures, we see a potential double bottom formation forming at the psychological level of 5000 points. We saw a similar situation at the level of 8500 points in 2019 - 2021. Then, despite an initial bounce from 8500 points, the formation was negated and a downward wave followed. If the situation were to repeat itself, a rise to the area of 6000 points is not excluded. If this impulse were to be extinguished once again, a downward wave could potentially bring the index even to the vicinity of 2500 points. In the scenario of a 'surprise' rebound of China's indexes in 2024, the level of 7000 points, where we see the 23.6 Fibonacci retracement of the 2018 downward wave, could also prove key to watch. It is also worth noting that 2018 was a time when the conflict between Washington and Beijing began to escalate and was increasingly closely watched by the market.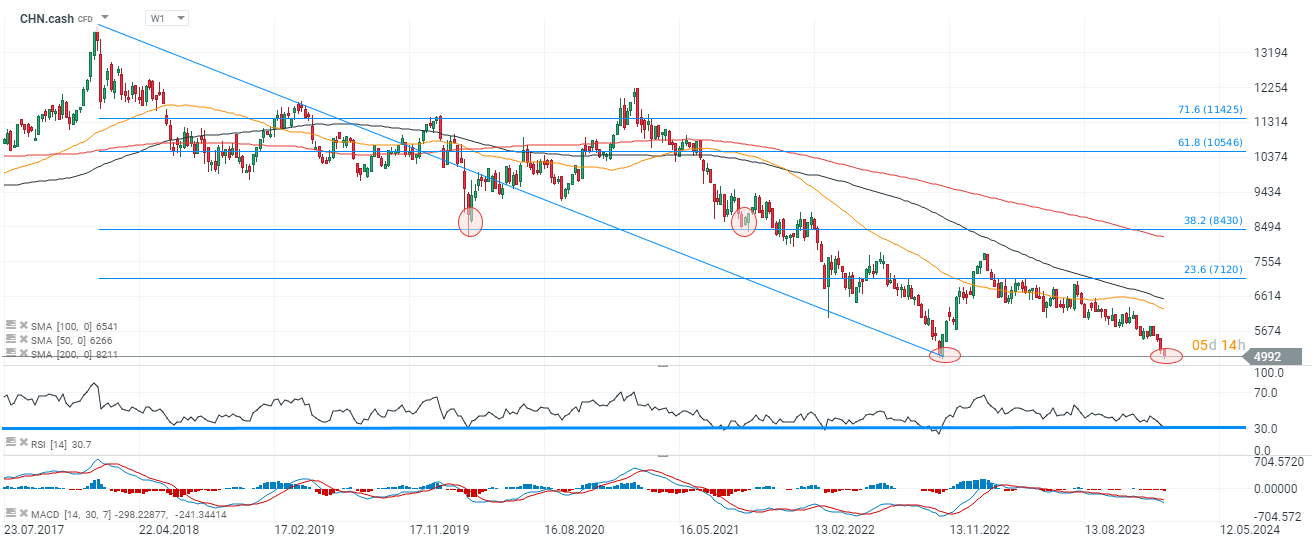 Source: xStation5

Daily Summary: The week ends on a positive note. SK Hynix up 14% on Nasdaq. Energy down (10.07.2026)

Three markets to watch next week (10.07.2026)

BREAKING: Iran and US are back at the negotiation table?! Oil takes a step back, stocks tick up!

Daily Wrap: Technology Leads Wall Street Higher. Markets Shrug Off US–Iran Tensions
The content of this report has been created by XTB S.A., with its registered office in Warsaw, at Prosta 67, 00-838 Warsaw, Poland, (KRS number 0000217580) and supervised by Polish Supervision Authority ( No. DDM-M-4021-57-1/2005). This material is a marketing communication within the meaning of Art. 24 (3) of Directive 2014/65/EU of the European Parliament and of the Council of 15 May 2014 on markets in financial instruments and amending Directive 2002/92/EC and Directive 2011/61/EU (MiFID II). Marketing communication is not an investment recommendation or information recommending or suggesting an investment strategy within the meaning of Regulation (EU) No 596/2014 of the European Parliament and of the Council of 16 April 2014 on market abuse (market abuse regulation) and repealing Directive 2003/6/EC of the European Parliament and of the Council and Commission Directives 2003/124/EC, 2003/125/EC and 2004/72/EC and Commission Delegated Regulation (EU) 2016/958 of 9 March 2016 supplementing Regulation (EU) No 596/2014 of the European Parliament and of the Council with regard to regulatory technical standards for the technical arrangements for objective presentation of investment recommendations or other information recommending or suggesting an investment strategy and for disclosure of particular interests or indications of conflicts of interest or any other advice, including in the area of investment advisory, within the meaning of the Trading in Financial Instruments Act of 29 July 2005 (i.e. Journal of Laws 2019, item 875, as amended). The marketing communication is prepared with the highest diligence, objectivity, presents the facts known to the author on the date of preparation and is devoid of any evaluation elements. The marketing communication is prepared without considering the client’s needs, his individual financial situation and does not present any investment strategy in any way. The marketing communication does not constitute an offer of sale, offering, subscription, invitation to purchase, advertisement or promotion of any financial instruments. XTB S.A. is not liable for any client’s actions or omissions, in particular for the acquisition or disposal of financial instruments, undertaken on the basis of the information contained in this marketing communication. In the event that the marketing communication contains any information about any results regarding the financial instruments indicated therein, these do not constitute any guarantee or forecast regarding the future results.