
Brent crude (OIL) is up nearly 3% today, reaching $93.86 per barrel, with a daily trading range of $92.52 to $94.20. The main catalyst for the gains is the escalation of geopolitical tensions in the Strait of Hormuz—mutual strikes between the U.S. and Iran, as well as reports of Iranian President Pezeshkian’s resignation, are shaking up the commodities market.
Fundamental Environment
Geopolitics is overshadowing oil. The fourth month of the U.S.-Iran conflict has seen no breakthrough—the U.S. Navy is escorting only about 70 ships per week through the Strait of Hormuz, compared to the pre-war average of over 100 per day. Paradoxically, throughout May, oil prices recorded its largest monthly decline in a year (nearly -17%), as markets priced in hopes for a deal—today we are seeing a rebound following disillusionment and new military reports. Two pieces of news that particularly fueled expectations of rising oil prices today were reports of attacks on the Ali Al Salem Airbase in Kuwait and alleged rumors of the Iranian president’s resignation.
In a letter sent on Sunday, Pezeshkian emphasized that the president and the government had effectively been excluded from the country’s most important and critical decision-making processes, and that the resulting power vacuum had enabled factions within the Islamic Revolutionary Guard Corps to seize control of the state’s actual power.
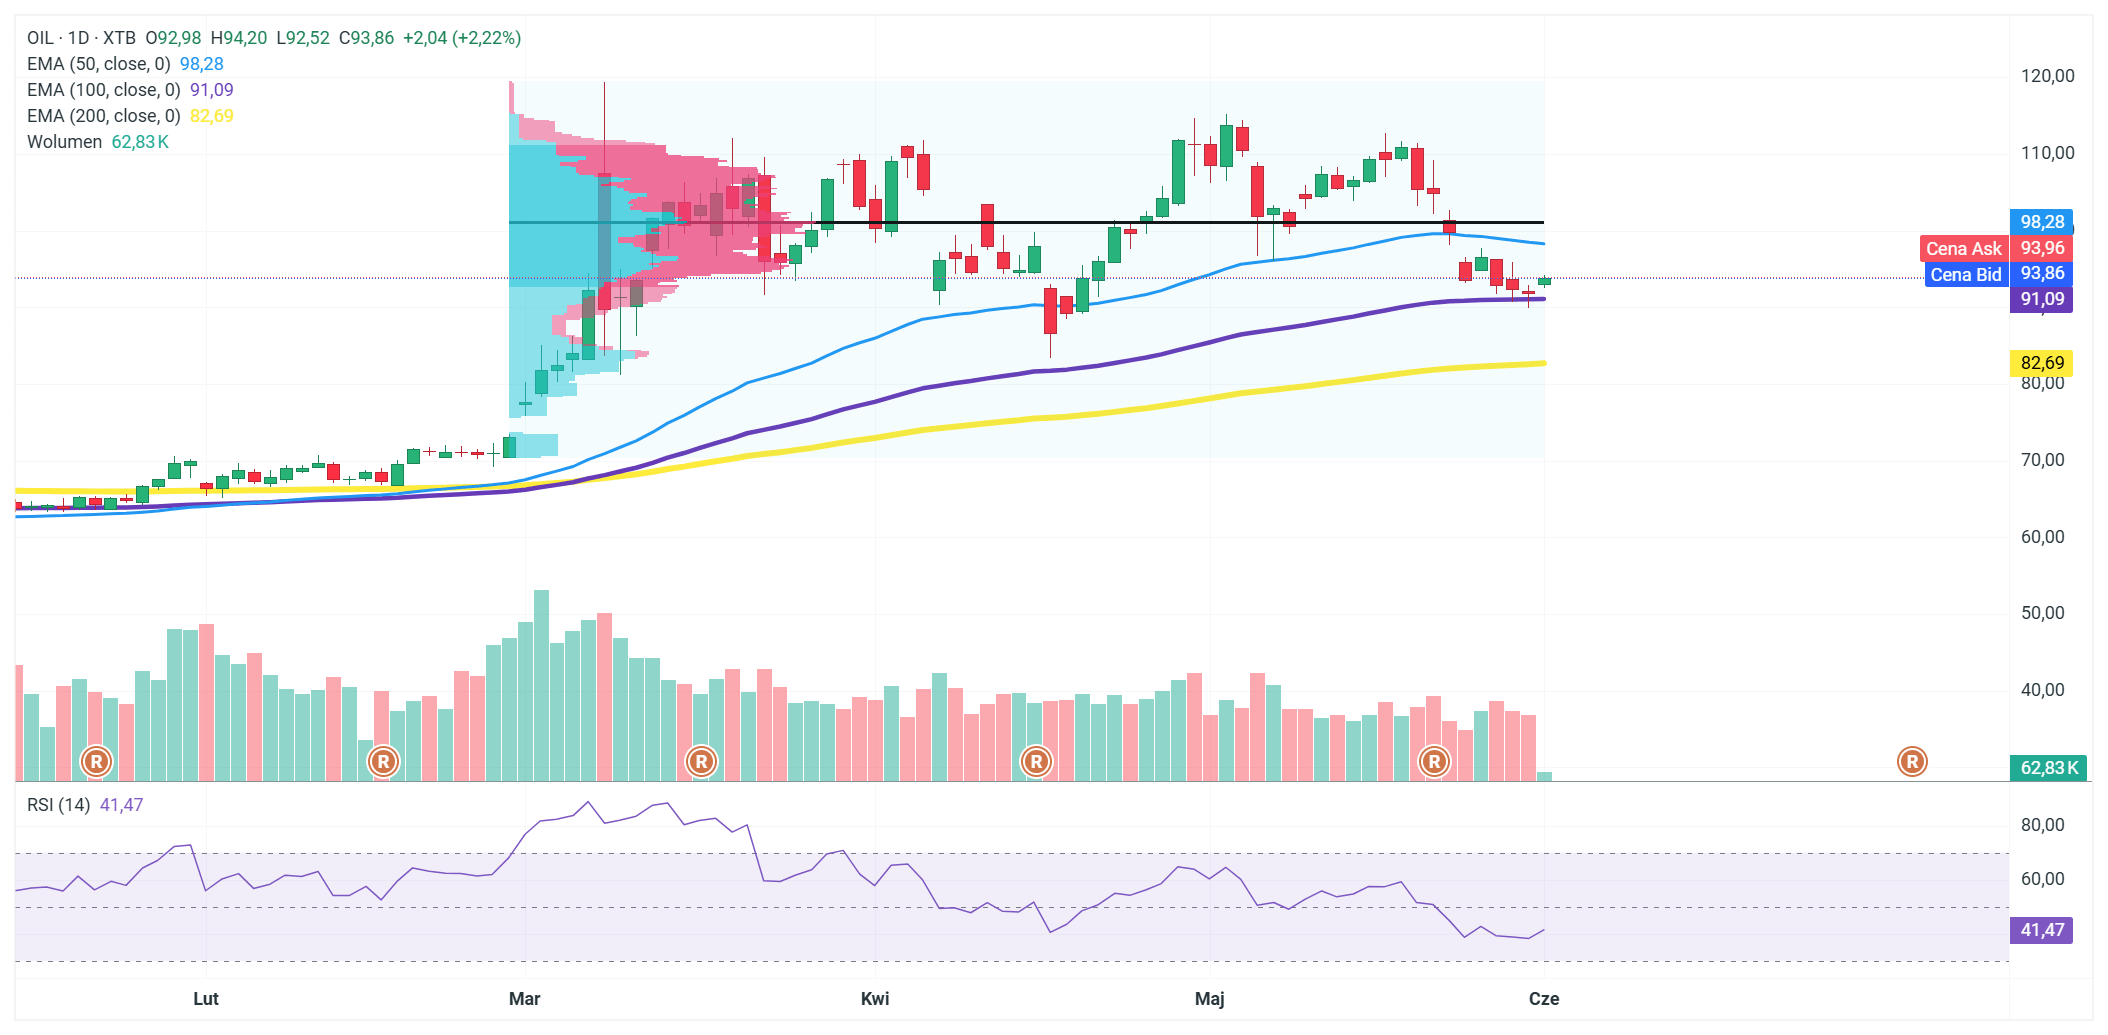
Oil has been trading below the 50-day EMA (98.28) for weeks, which immediately sets the context—sellers are dominating in the medium term, and every rally hits this level like a wall. The decline from the March highs around $110 was gradual until the price reached the zone where it currently stands, right at the EMA100 at 91.09 — and this is the key point on the chart today, as the EMA100 has repeatedly cushioned oversold conditions over the past few months and is now being tested from above once again. The RSI at 41.47 completes this picture—the indicator is not yet at deeply oversold levels, which historically have generated strong rebounds, but it is approaching the zone where buyers begin to step in, making a reaction at the EMA100 technically justified. The volume profile shows that the highest concentration of trades from previous months falls within the $100–$105 range, meaning that a return to this area would require not only breaking above the EMA50 but also breaking through a dense zone of historical orders—and that is where the real test for the bulls lies. Source: xStation

Daily Summary: Lower inflation weakens the dollar and awakens gold and S&P 500 to gains

Fed Chair Kevin Warsh’s Q&A from Congress Testimony: Inflation stability is a key

Bypassing Hormuz: Gulf States Race Against Time

US Open: Nasdaq 100 gains 1% 🔼 Software stocks decline, JP Morgan rises after earnings
The content of this report has been created by XTB S.A., with its registered office in Warsaw, at Prosta 67, 00-838 Warsaw, Poland, (KRS number 0000217580) and supervised by Polish Supervision Authority ( No. DDM-M-4021-57-1/2005). This material is a marketing communication within the meaning of Art. 24 (3) of Directive 2014/65/EU of the European Parliament and of the Council of 15 May 2014 on markets in financial instruments and amending Directive 2002/92/EC and Directive 2011/61/EU (MiFID II). Marketing communication is not an investment recommendation or information recommending or suggesting an investment strategy within the meaning of Regulation (EU) No 596/2014 of the European Parliament and of the Council of 16 April 2014 on market abuse (market abuse regulation) and repealing Directive 2003/6/EC of the European Parliament and of the Council and Commission Directives 2003/124/EC, 2003/125/EC and 2004/72/EC and Commission Delegated Regulation (EU) 2016/958 of 9 March 2016 supplementing Regulation (EU) No 596/2014 of the European Parliament and of the Council with regard to regulatory technical standards for the technical arrangements for objective presentation of investment recommendations or other information recommending or suggesting an investment strategy and for disclosure of particular interests or indications of conflicts of interest or any other advice, including in the area of investment advisory, within the meaning of the Trading in Financial Instruments Act of 29 July 2005 (i.e. Journal of Laws 2019, item 875, as amended). The marketing communication is prepared with the highest diligence, objectivity, presents the facts known to the author on the date of preparation and is devoid of any evaluation elements. The marketing communication is prepared without considering the client’s needs, his individual financial situation and does not present any investment strategy in any way. The marketing communication does not constitute an offer of sale, offering, subscription, invitation to purchase, advertisement or promotion of any financial instruments. XTB S.A. is not liable for any client’s actions or omissions, in particular for the acquisition or disposal of financial instruments, undertaken on the basis of the information contained in this marketing communication. In the event that the marketing communication contains any information about any results regarding the financial instruments indicated therein, these do not constitute any guarantee or forecast regarding the future results.