



We began the week with significant increases in energy commodity prices and a broad investor retreat from risk. This is, of course, the aftermath of a statement published by the Islamic Revolutionary Guard Corps, according to which the Strait of Hormuz is closed "until further notice".
Geopolitics
Both the rise in crude oil prices, of which the United States is a net exporter, and the return of risk aversion are favourable factors for the US currency. However, communications from both sides are highly inconsistent. Donald Trump rejected Tehran's statement, assuring the openness of the route for vessels moving in accordance with the law, which may be one of the factors currently leading to a turnaround in the currency market.
Both sides are announcing further escalation. Iran states that any further actions by the US or its allies in response to the blockade will be met with severe retaliation. The United States, in turn, warns that if Tehran maintains the blockade, the US will carry out further attacks.
The market is not yet pricing in a worst-case scenario. The scale of the increases in the prices of key energy commodities is relatively small (we have not broken the local highs of 8 July).
- We currently pay a little over 78 dollars for a barrel of Brent crude oil; WTI is oscillating around 74 dollars.
The situation is, however, changing dynamically. Further attacks, especially on ships moving through the strait, could lead to sudden spikes in volatility.
Kevin Warsh's hearing
On Tuesday, the Fed Chair will appear before Congress as part of a bi-annual hearing.
Just one meeting under Warsh's leadership is behind us. Markets are still not convinced about what the new Chair's approach to monetary policy will look like. The first signals, which came as a surprise, were moderately hawkish.
The hearing is taking on particular significance in the face of Warsh's desire to withdraw forward guidance, i.e., communications directing the markets on which direction the committee intends to go. The desire to reduce the transparency of the Fed's actions has found many critics. We expect that Warsh will face a significant number of questions on this issue.
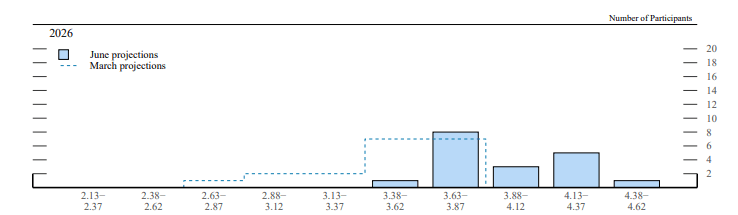
Let us recall that Warsh did not participate in the last "dot plot," i.e., the projection of the interest rate path of the committee members.
Figure 1: The Difference Between the March and June Dot Plot (Interest Rate Levels at the End of 2026)
 Source: FOMC, 13.07.2026
Although the June conference somewhat calmed the mood, many still expect that Warsh will try to please the White House. Politicians will likely try to get an answer to the key question: in what way does Warsh's approach to the economy and monetary policy differ from that presented by Trump.
CPI inflation
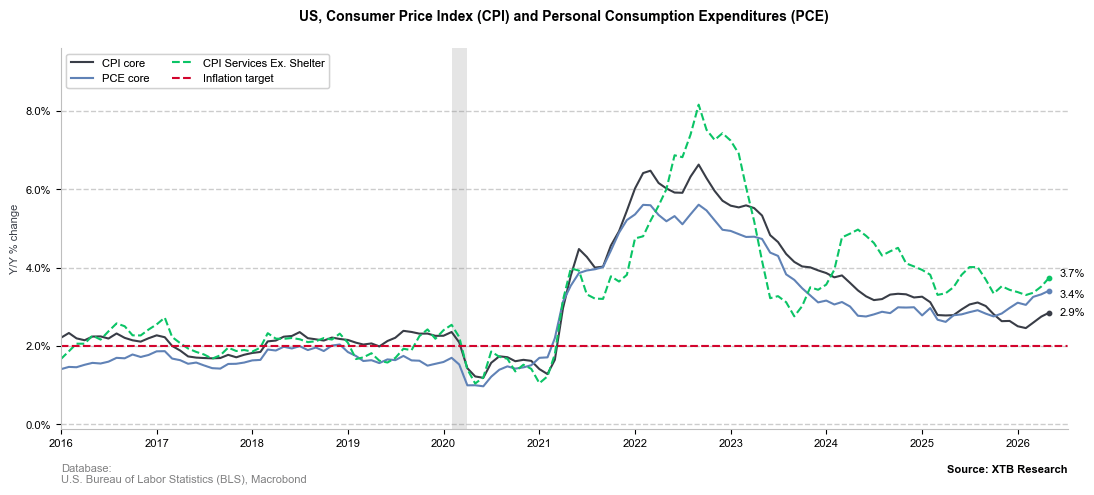
90 minutes before the hearing begins, the June inflation reading from the United States will be published. The consensus assumes no major changes in the core measure (consensus 2.9%) and a modest decline in the headline measure (consensus 3.9%). However, this is not a cause for optimism. Price pressure remains firmly too high, which means that Congress will demand very precise explanations as to how Warsh intends to bring it down to the target.
Figure 2: Core CPI and PCE Inflation in the United States (2016 – 2026)
 Source: XTB Research, 10.07.2026
During his first press conference, the new Chair cut off speculation regarding the possibility of raising the inflation target, also stressing that he will not accept elevated inflation in the name of protecting jobs. The market received his statements as relatively hawkish, raising the valuations of Fed interest rate hikes.
Warsh did, however, also stress that he pays attention to what "is on the left side of the decimal point." Moreover, he stated that "current techniques for measuring price pressure are far from ideal." As an alternative, he presented in recent months, among others, the trimmed mean developed by the Dallas Fed branch. In May, it reached only 2.8%, so the target "two" was still on the left side of the decimal point.
Technical analysis
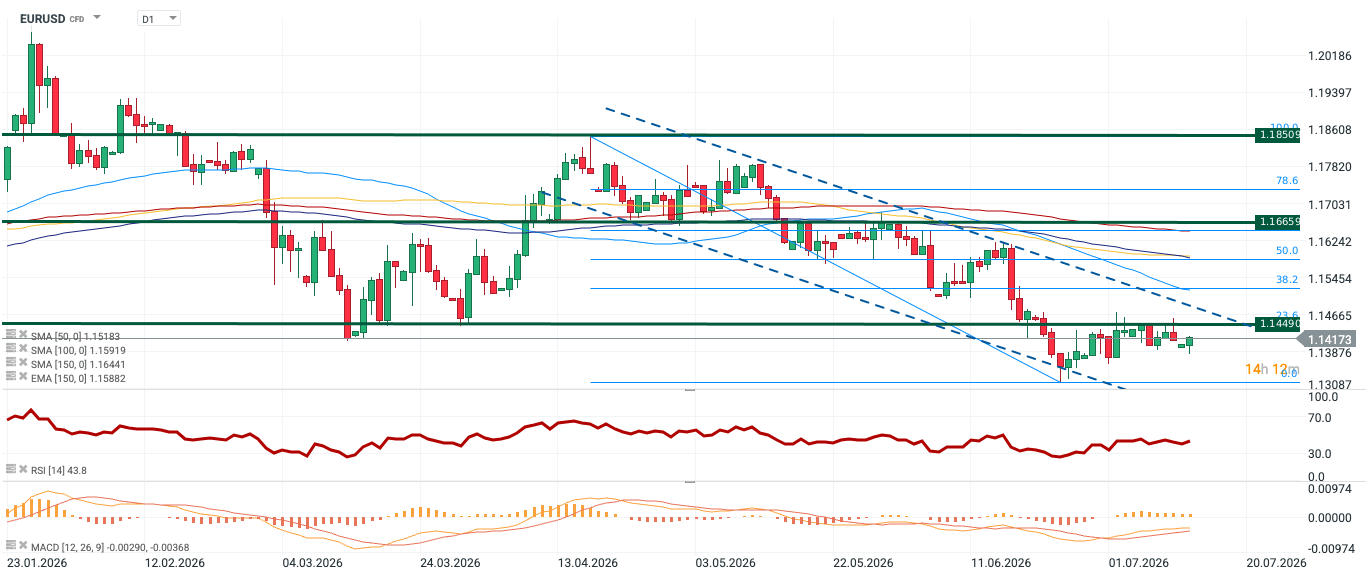
Figure 3: EURUSD [D1] (23.01.2026 – 13.07.2026)
 Source: xStation, 13.07.2026
EURUSD has been in a clear downward trend since the beginning of April. Despite the slowdown in declines and anchoring around 1.14, the exchange rate remains deep below the 50, 100, and 150-day moving averages, which act as dynamic resistance levels.
- The SMA50 almost coincides with the Fibo 38.1 (around 1.152), the SMA 100 can be found near the Fibo 50 (1.159), and the SMA 150 takes values close to the Fibo 61.8 (1.164).
Their arrangement is consistent with the advantage of the supply side, as is the RSI indicator (43.8).



Daily Summary: Oil at five-month highs, indices under pressure (23.10.2026)


BREAKING: France slows down, Germany holds on. Euro falls below 1.12



Daily Summary: Valuations Under Pressure, Capital Moves Away From Technology

Market Wrap: "Decent" results are not enough – tech stocks fall further; oil highest since May (22.10.2026)
The content of this report has been created by XTB S.A., with its registered office in Warsaw, at Prosta 67, 00-838 Warsaw, Poland, (KRS number 0000217580) and supervised by Polish Supervision Authority ( No. DDM-M-4021-57-1/2005). This material is a marketing communication within the meaning of Art. 24 (3) of Directive 2014/65/EU of the European Parliament and of the Council of 15 May 2014 on markets in financial instruments and amending Directive 2002/92/EC and Directive 2011/61/EU (MiFID II). Marketing communication is not an investment recommendation or information recommending or suggesting an investment strategy within the meaning of Regulation (EU) No 596/2014 of the European Parliament and of the Council of 16 April 2014 on market abuse (market abuse regulation) and repealing Directive 2003/6/EC of the European Parliament and of the Council and Commission Directives 2003/124/EC, 2003/125/EC and 2004/72/EC and Commission Delegated Regulation (EU) 2016/958 of 9 March 2016 supplementing Regulation (EU) No 596/2014 of the European Parliament and of the Council with regard to regulatory technical standards for the technical arrangements for objective presentation of investment recommendations or other information recommending or suggesting an investment strategy and for disclosure of particular interests or indications of conflicts of interest or any other advice, including in the area of investment advisory, within the meaning of the Trading in Financial Instruments Act of 29 July 2005 (i.e. Journal of Laws 2019, item 875, as amended). The marketing communication is prepared with the highest diligence, objectivity, presents the facts known to the author on the date of preparation and is devoid of any evaluation elements. The marketing communication is prepared without considering the client’s needs, his individual financial situation and does not present any investment strategy in any way. The marketing communication does not constitute an offer of sale, offering, subscription, invitation to purchase, advertisement or promotion of any financial instruments. XTB S.A. is not liable for any client’s actions or omissions, in particular for the acquisition or disposal of financial instruments, undertaken on the basis of the information contained in this marketing communication. In the event that the marketing communication contains any information about any results regarding the financial instruments indicated therein, these do not constitute any guarantee or forecast regarding the future results.