
Monday's rise in energy commodity prices proved short-lived, weighing further on the Norwegian currency. The USDNOK pair is approaching the 9.50 level, which was last seen two months ago. Aside from headlines coming out of the Middle East, tomorrow's scheduled releases of May inflation data from both Norway and the US should take center stage for the pair.
Geopolitics
The weekend exchange of fire between Israel and Iran has cast doubt on the fragile ceasefire currently in place across the region. Under pressure from Washington, both sides halted further strikes. However, the situation remains highly uncertain, which could sustain high volatility in the prices of key energy commodities.
Macroeconomic Data
Tomorrow's readings are expected to show core inflation remaining unchanged at 3.2%, alongside a slight decline in the headline figure to 3.1% in Norway. An upside surprise could raise expectations for further monetary policy tightening by Norges Bank. As a reminder, the central bank delivered its first interest rate hike since 2023 back in May, reacting to rapidly rising inflation expectations, persistently elevated wage growth, and the concerning stickiness of core inflation.
Meanwhile, the headline CPI figure in the United States is expected to edge upward to 4.2%. The consensus also forecasts a modest increase in the core metric to 2.9%. Investors have already fully priced in a Fed rate hike for 2026. A further build-up of price pressures could increase the likelihood of this hike occurring as early as this autumn.
Technical Analysis
Chart 1: USDNOK (01.07.2025 - 09.06.2026)
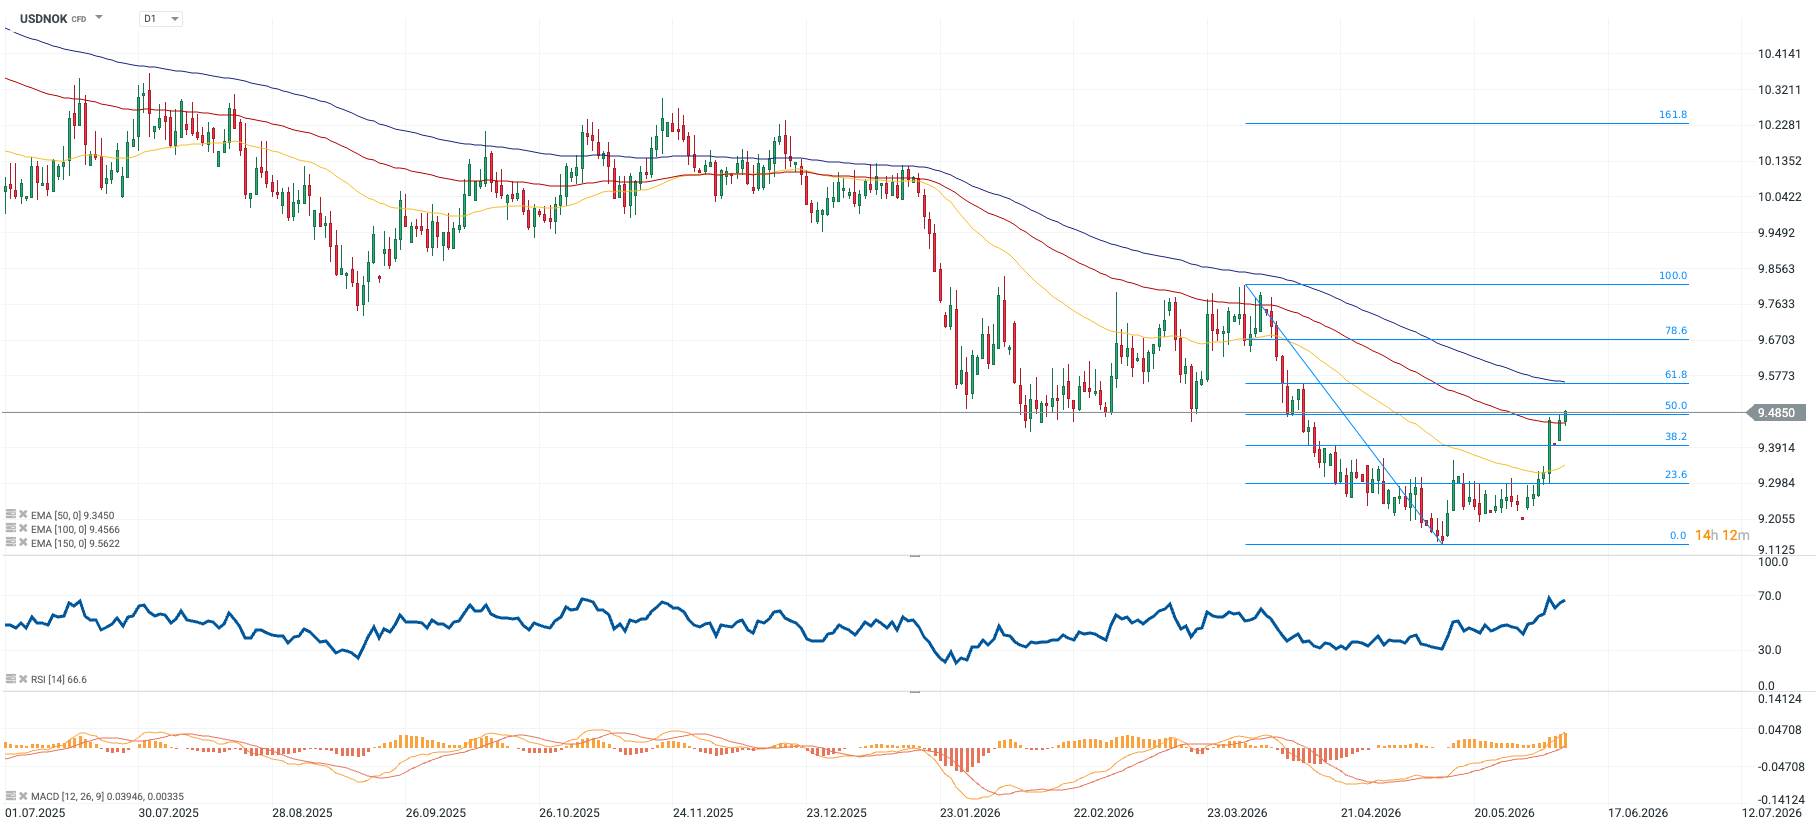
Source: xStation, 09.06.2026
After establishing a new local low at the 9.13 level, a strong and aggressive demand-driven rebound ensued. The first two key technical resistance levels have been broken. The price has approached the 50% Fibonacci retracement level, which could serve as a crucial test for the ongoing upward trend.
The strong momentum of the move is reflected in technical indicators. The RSI is currently hovering around 67 points, signaling that the market is gradually entering overbought territory, which could trigger a temporary pause in momentum.
Key Levels to Watch:
- To the Upside: If buyers manage to sustain the price above the tested 50% Fibo level, the next natural target for the market could be the 9.56 level, where both the 61.8% Fibonacci retracement and the 100 EMA coincide.
- To the Downside: Conversely, a sustained rejection of the current resistance level would mean anticipating a return to the primary trend and a retest of lower support levels.
—
Michał Jóźwiak, Financial Markets Analyst at XTB

Tech sector catches its breath 🚀

Red Sea, but not the indices : The effects of the Bab al-Mandab blockade.

US OPEN: Semiconductors drive a rebound
Market Wrap: Bulls Return to Europe Thanks to U.S.-Iran Mediation and Data from Germany
The content of this report has been created by XTB S.A., with its registered office in Warsaw, at Prosta 67, 00-838 Warsaw, Poland, (KRS number 0000217580) and supervised by Polish Supervision Authority ( No. DDM-M-4021-57-1/2005). This material is a marketing communication within the meaning of Art. 24 (3) of Directive 2014/65/EU of the European Parliament and of the Council of 15 May 2014 on markets in financial instruments and amending Directive 2002/92/EC and Directive 2011/61/EU (MiFID II). Marketing communication is not an investment recommendation or information recommending or suggesting an investment strategy within the meaning of Regulation (EU) No 596/2014 of the European Parliament and of the Council of 16 April 2014 on market abuse (market abuse regulation) and repealing Directive 2003/6/EC of the European Parliament and of the Council and Commission Directives 2003/124/EC, 2003/125/EC and 2004/72/EC and Commission Delegated Regulation (EU) 2016/958 of 9 March 2016 supplementing Regulation (EU) No 596/2014 of the European Parliament and of the Council with regard to regulatory technical standards for the technical arrangements for objective presentation of investment recommendations or other information recommending or suggesting an investment strategy and for disclosure of particular interests or indications of conflicts of interest or any other advice, including in the area of investment advisory, within the meaning of the Trading in Financial Instruments Act of 29 July 2005 (i.e. Journal of Laws 2019, item 875, as amended). The marketing communication is prepared with the highest diligence, objectivity, presents the facts known to the author on the date of preparation and is devoid of any evaluation elements. The marketing communication is prepared without considering the client’s needs, his individual financial situation and does not present any investment strategy in any way. The marketing communication does not constitute an offer of sale, offering, subscription, invitation to purchase, advertisement or promotion of any financial instruments. XTB S.A. is not liable for any client’s actions or omissions, in particular for the acquisition or disposal of financial instruments, undertaken on the basis of the information contained in this marketing communication. In the event that the marketing communication contains any information about any results regarding the financial instruments indicated therein, these do not constitute any guarantee or forecast regarding the future results.