
Key Market Paradigm: Dominance of the Roll Yield Mechanism
Comparing the price return (Generic Return — pure front-month contract price change) with the total return (Total Return including income or cost of rolling positions) clearly reveals that in 2026, it was the term structure of contracts, not the price direction itself, that was the main driver of results in the commodity market, especially in the energy sector. That is why analyzing the term structure of commodities is so crucial in daily trading, particularly in a slightly longer term than day-trading. What term structures do we have?
- Backwardation (tight supply): Further contracts are cheaper than the nearest ones. Rolling the position results in a higher amount of repurchased futures contracts, which is illustrated by swap points. This situation dominated the fuel market in H1.
- Contango (oversupply / high inventories): Further contracts are more expensive than nearer ones. Rolling the position usually generates a loss, because after opening the next contract higher, prices usually fall later. Commodities in a contango structure usually bring worse rates of return (visible, among others, in the corn and gas markets in Q2).
It is worth emphasizing that the presented returns concern futures contracts presented by Bloomberg, while the roll yield is calculated by rolling futures contracts 5 days before the expiry of the futures contracts.
Analysis of the first half of 2026
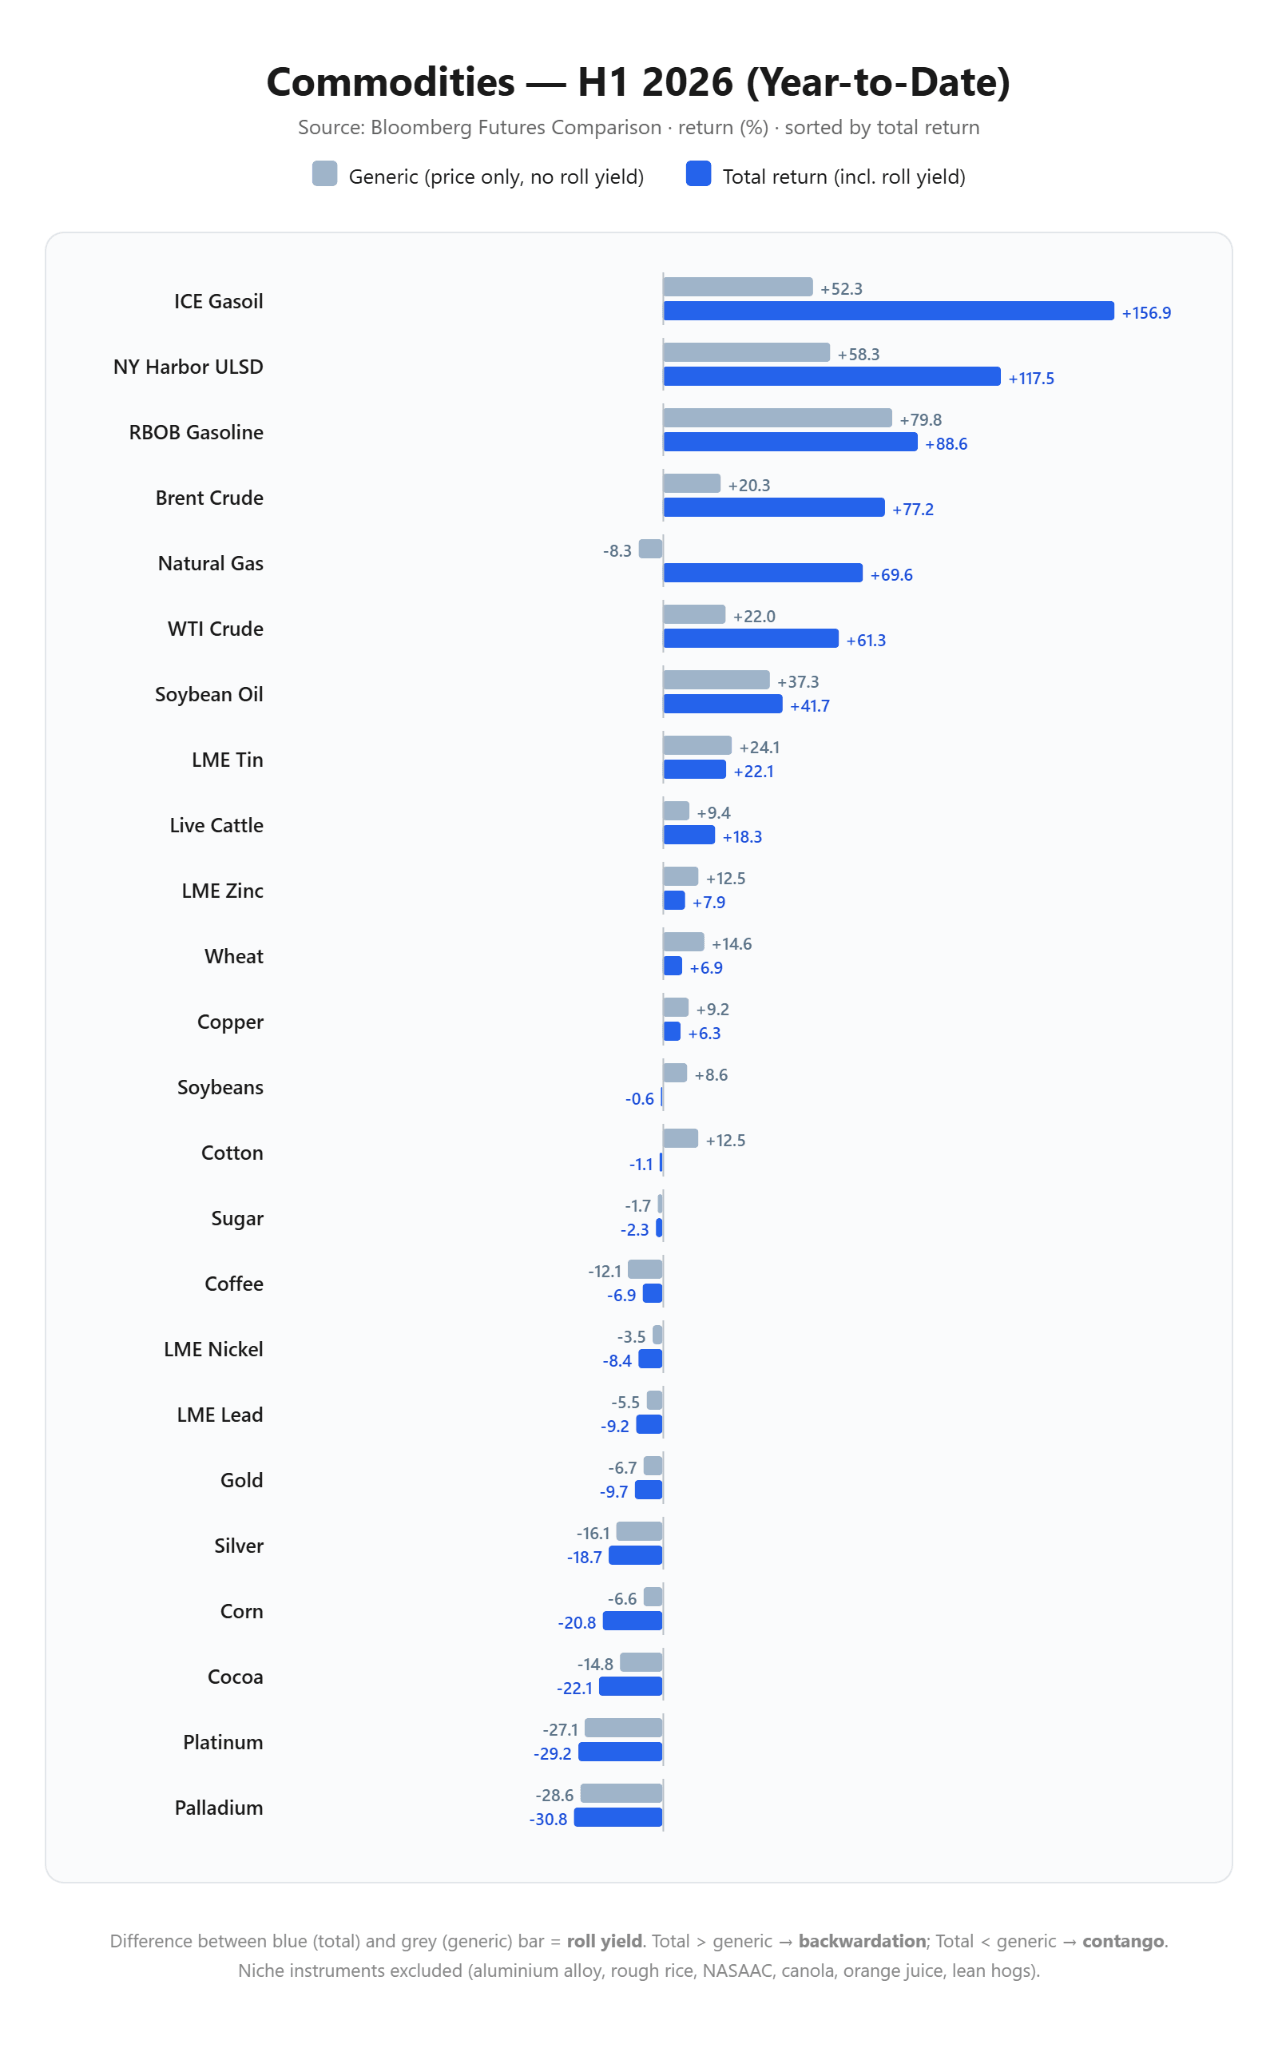
The first half of the year was marked by the absolute dominance of the fuel and energy complex driven by a structural shortage of physical supply.
Winners of the first half: Fuel complex in deep backwardation
- ICE Gasoil: The undisputed leader of the half-year. Despite a price increase of +52.3%, the total return was as high as +156.9%. More than two-thirds of the profit came directly from the roll premium, reflecting the dramatic deficit of middle distillates and the crisis of global refining capacities.
- Diesel (NY Harbor ULSD): Recorded a similar pattern: a price increase of +58.3% translated into a +117.5% Total Return rate.
- Crude oil (Brent and WTI): Deep backwardation cushioned market uncertainty. Brent gained +20.3% in price, but yielded as much as +77.2% in total profit. WTI rose by +22.0% (price) / +61.3% (Total Return).
- Natural Gas: An extreme case, proving the misleading nature of spot prices alone. The gas price fell by -8.3%, however, taking into account the rolling of futures contracts, investors could potentially have earned +69.6% from the rolling of the position alone with the massive volatility of the instrument. It is worth remembering that in the first months of the year we were dealing with extreme backwardation.
- RBOB Gasoline and Soybean Oil: Exceptions where profits were driven by real consumer and biofuel demand (Gasoline: +79.8% price / +88.6% total return; Soybean oil: +37.3% price / +41.7% total return).
Losers of the first half: Structural weakness and contango traps
- Precious Metals: Were in a stable downtrend, despite a powerful first month of growth with a neutral impact of rolling. Palladium (-30.8% total return) and Platinum (-29.2% total return) suffered the most, which results from demand problems in the automotive industry. Silver lost -18.7% total return, and gold -9.7% total return. It is worth remembering that this applies to returns from futures contracts, not spot prices.
- Corn: A classic example of the destructive effect of contango. The price drop on the market was only -6.6%, but full warehouses and the cost of maintaining the futures position deepened the real loss of investors to the level of -20.8%.
Analysis of Q2 2026
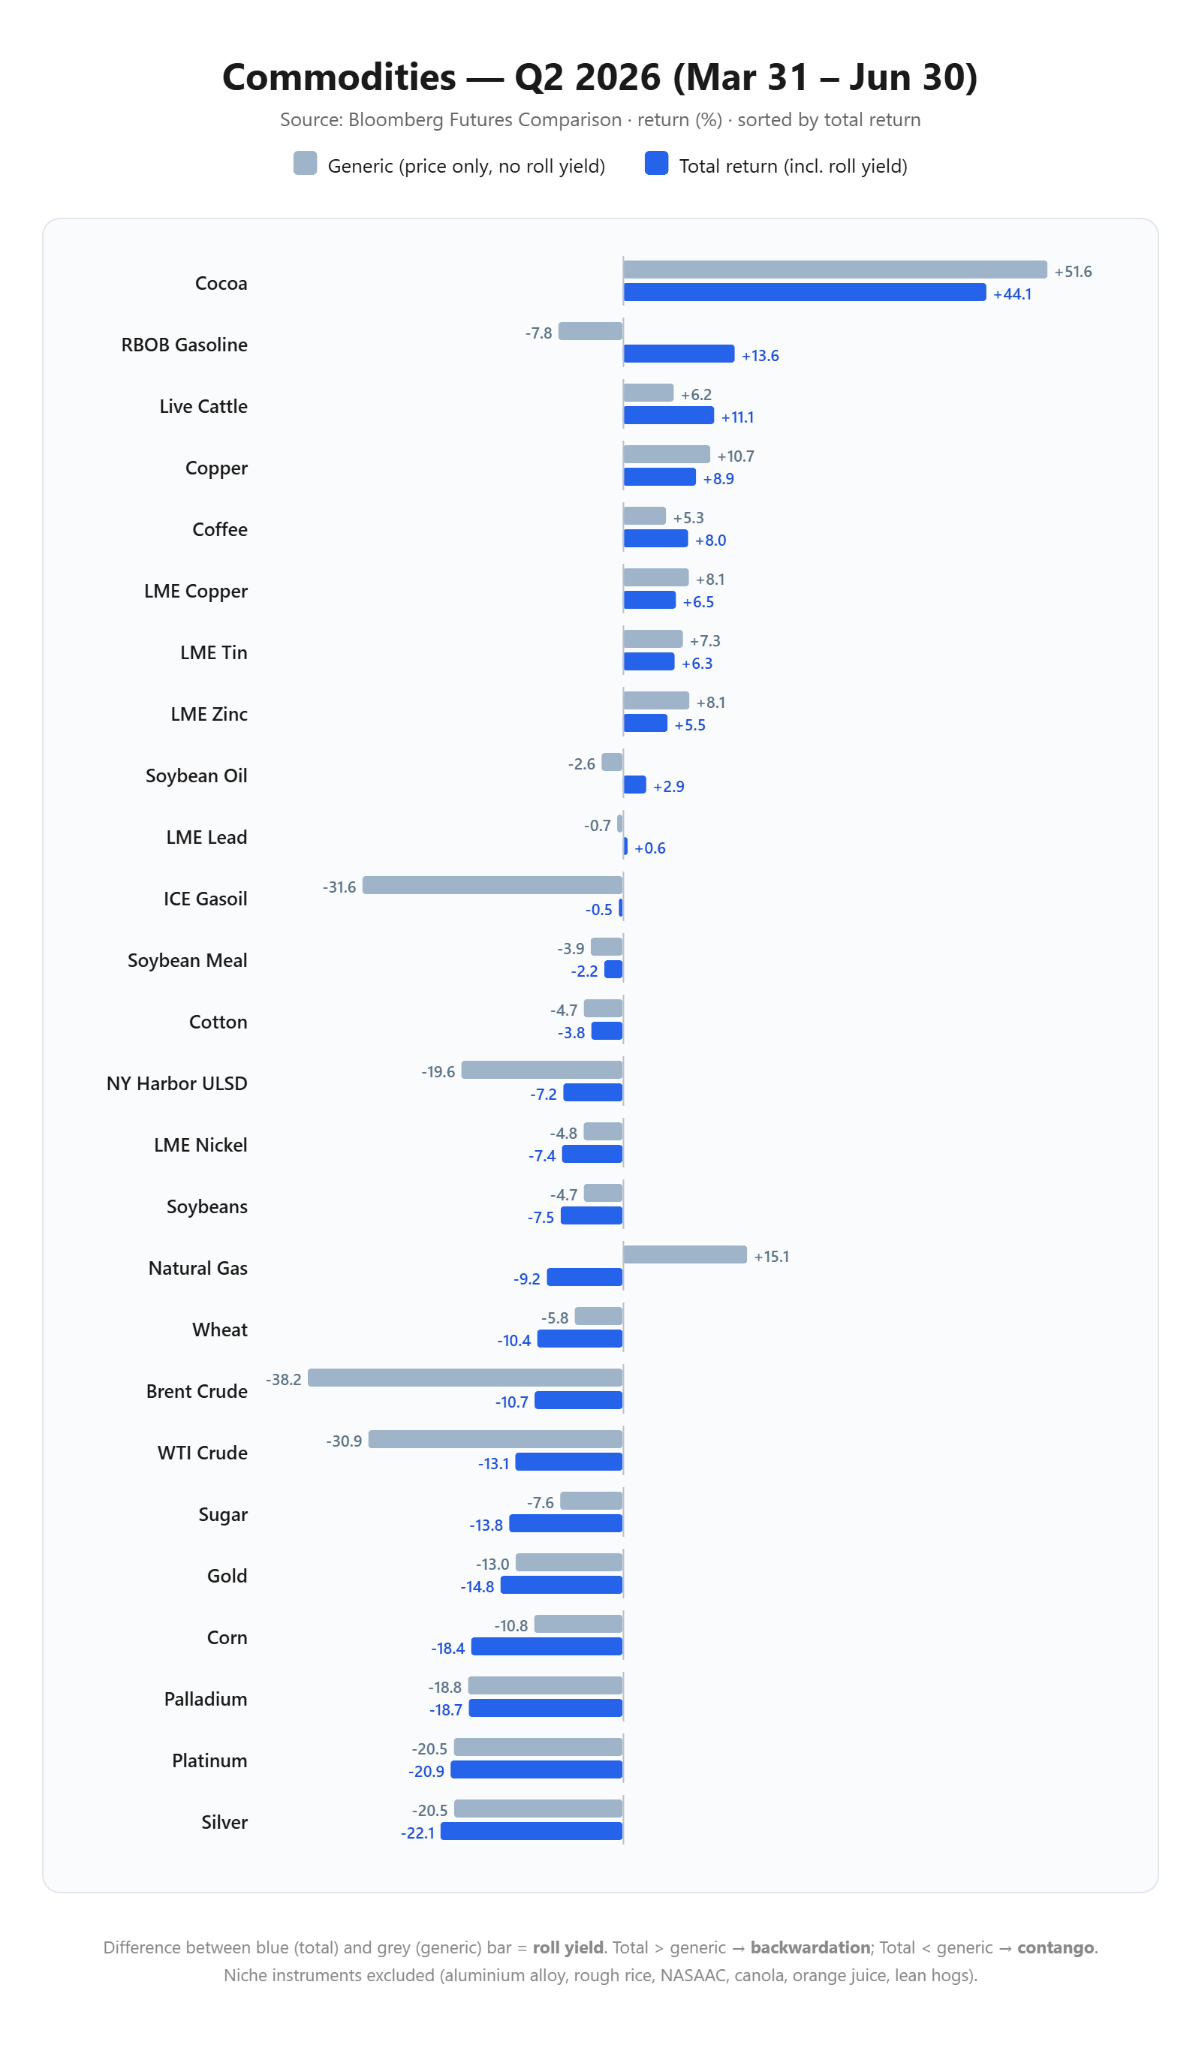
The second quarter brought a violent reshuffling of forces in the market and a collapse of trends from the beginning of the year.
Winners of Q2: Cocoa rebound and industry stabilization
- Cocoa: After the bubble burst in the first months of the year, the second quarter brought a spectacular return. The commodity became more expensive by +51.6%, giving investors a +44.1% total return, placing it in the leading position for the quarter. This is the effect of concerns about El Nino, which may bring crop problems in the next season, even despite still present demand problems.
- Industrial Metals: Copper (+8.9% total return), Tin (+6.3% total return), and Zinc (+5.5% total return) recorded consistent, healthy growth, reflecting the stabilization of global manufacturing demand with low risk volatility. However, it is worth noting that China has recently been showing some signs of economic weakness, so it is worth keeping in mind whether copper will hold around historical highs.
Losers of Q2: Fuel price crash and loss amortization
- Crude oil (Brent and WTI): Spot prices of oil turned sharply (Brent: -38.2%, WTI: -30.9%). However, the persistent backwardation acted as a protective shield for long positions: the final quarterly Total Return was only -10.7% for Brent and -13.1% for WTI. Investors lost much less than newspaper headlines would indicate.
- ICE Gasoil: The price fell by -31.6%, but the roll yield almost completely offset this collapse, bringing the quarterly portfolio loss to a symbolic -0.5%.
- Natural Gas (Inverse Trap): The exact opposite of the situation from the beginning of the year. The gas price in Q2 rose by +15.1%, but the market entered a slight contango. The high cost of rolling contracts from May and April turned the price increase into a real portfolio loss of about -9.2%.
Conclusions after the first half of the year
- Market structure is more important than price forecast. The case of natural gas in 2026 clearly shows that playing for the direction of the spot price alone can bring the opposite financial effect if one omits the costs or profits from rolling the position. The seasonality of this market largely shapes what the term structure looks like.
- Crude oil as structural hedging. Maintaining a long position on oil in conditions of deep backwardation gave high investment comfort. Powerful price corrections from Q2 were mostly amortized by the positive roll yield. Currently, we are still dealing with backwardation in the market, at least until mid-2027.
- Precious metals as linear assets. The gold and silver group is the only market segment where price movements and real rates of return followed a nearly identical path, unaffected by the rollover mechanism. Throughout the first half of the year, this group was in a consistent and predictable downward trend.

US OPEN: Semiconductors drive a rebound
Market Wrap: Bulls Return to Europe Thanks to U.S.-Iran Mediation and Data from Germany

Silver breaks above $59 and attracts capital again. Gold remains in the shadow of its younger sibling

Chart of the day 🔼Nasdaq gains 1.2% as semiconductors rebound (21.07.2026)
The content of this report has been created by XTB S.A., with its registered office in Warsaw, at Prosta 67, 00-838 Warsaw, Poland, (KRS number 0000217580) and supervised by Polish Supervision Authority ( No. DDM-M-4021-57-1/2005). This material is a marketing communication within the meaning of Art. 24 (3) of Directive 2014/65/EU of the European Parliament and of the Council of 15 May 2014 on markets in financial instruments and amending Directive 2002/92/EC and Directive 2011/61/EU (MiFID II). Marketing communication is not an investment recommendation or information recommending or suggesting an investment strategy within the meaning of Regulation (EU) No 596/2014 of the European Parliament and of the Council of 16 April 2014 on market abuse (market abuse regulation) and repealing Directive 2003/6/EC of the European Parliament and of the Council and Commission Directives 2003/124/EC, 2003/125/EC and 2004/72/EC and Commission Delegated Regulation (EU) 2016/958 of 9 March 2016 supplementing Regulation (EU) No 596/2014 of the European Parliament and of the Council with regard to regulatory technical standards for the technical arrangements for objective presentation of investment recommendations or other information recommending or suggesting an investment strategy and for disclosure of particular interests or indications of conflicts of interest or any other advice, including in the area of investment advisory, within the meaning of the Trading in Financial Instruments Act of 29 July 2005 (i.e. Journal of Laws 2019, item 875, as amended). The marketing communication is prepared with the highest diligence, objectivity, presents the facts known to the author on the date of preparation and is devoid of any evaluation elements. The marketing communication is prepared without considering the client’s needs, his individual financial situation and does not present any investment strategy in any way. The marketing communication does not constitute an offer of sale, offering, subscription, invitation to purchase, advertisement or promotion of any financial instruments. XTB S.A. is not liable for any client’s actions or omissions, in particular for the acquisition or disposal of financial instruments, undertaken on the basis of the information contained in this marketing communication. In the event that the marketing communication contains any information about any results regarding the financial instruments indicated therein, these do not constitute any guarantee or forecast regarding the future results.