
Cryptocurrencies are gradually recovering at the start of Monday’s session. The weekend did not bring a cascading sell-off after Friday’s pullback, which pushed Bitcoin’s price down to around 87,000 USD. Demand is slowly rebuilding amid positive sentiment on Wall Street and a weaker dollar. Over the past five weeks, Bitcoin ETFs have seen more than 2.7 billion USD in outflows. Last Thursday, 113 million USD left BlackRock’s iShares Bitcoin Trust (IBIT), while on Friday the inflows reached just over 50 million USD. It was simultaneously the sixth consecutive week of net negative flows.
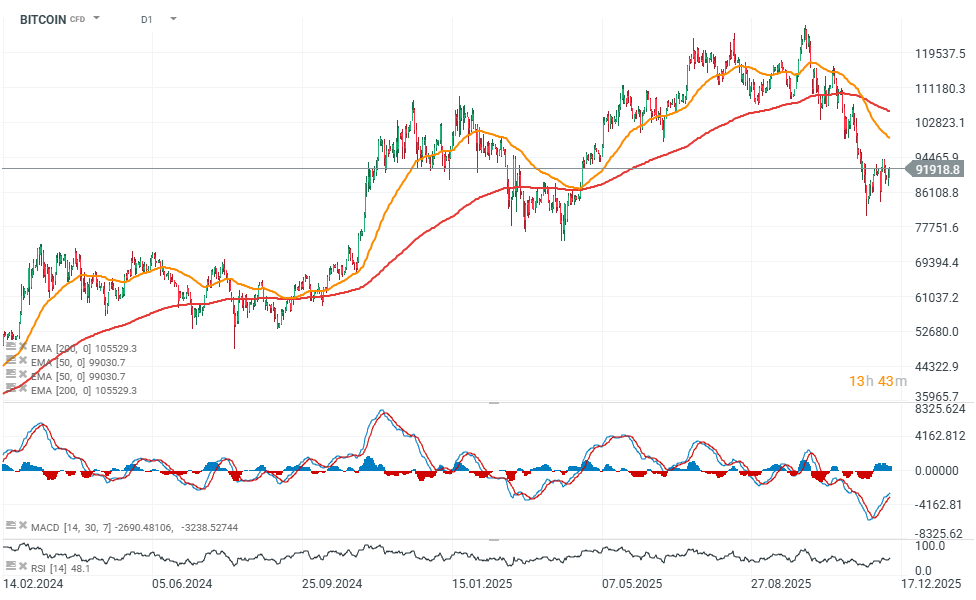
Bitcoin (D1, H1)
Bitcoin’s price is rebounding today after significant declines, and the chart is forming increasingly higher lows, which may indicate an attempt to return to an upward trend. The key resistance levels are currently around 93,000 USD and 100,000 USD, where we also find the EMA50 (orange line).
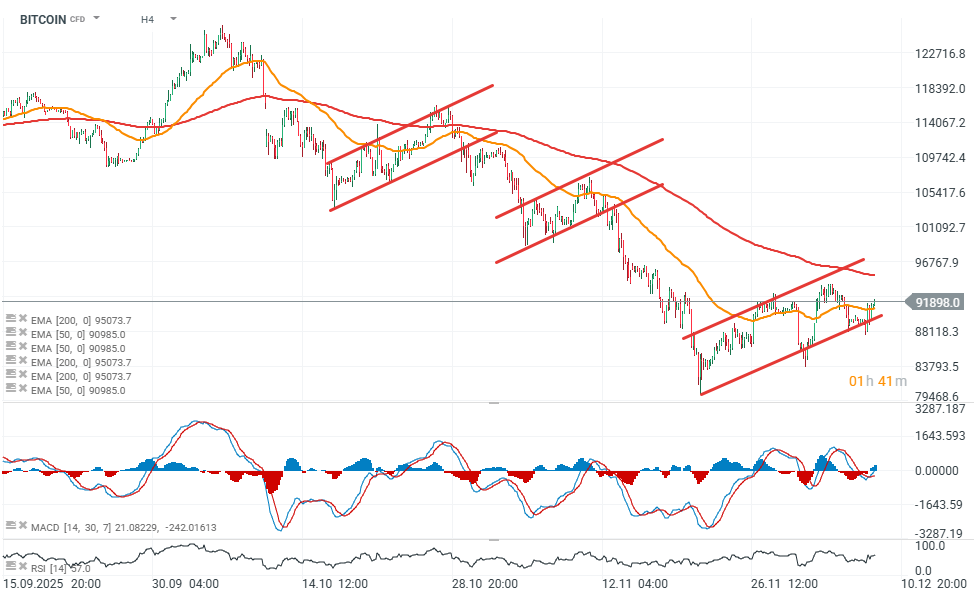
Looking at the much shorter time frame, we may be seeing the early stages of another flag pattern. It is worth noting, however, that unlike the previous two flags, this time the price has managed to rise above the hourly EMA50 for the third time — previously this moving average acted as resistance. If the upward move continues toward 93–94k USD, an accelerated rally toward 100k USD cannot be ruled out. On the other hand, a drop below 90,000 USD would open the door to a bearish scenario, which is the baseline expectation for this type of formation.
Source: xStation5
Source: xStation5
Bitcoin ETF Activity
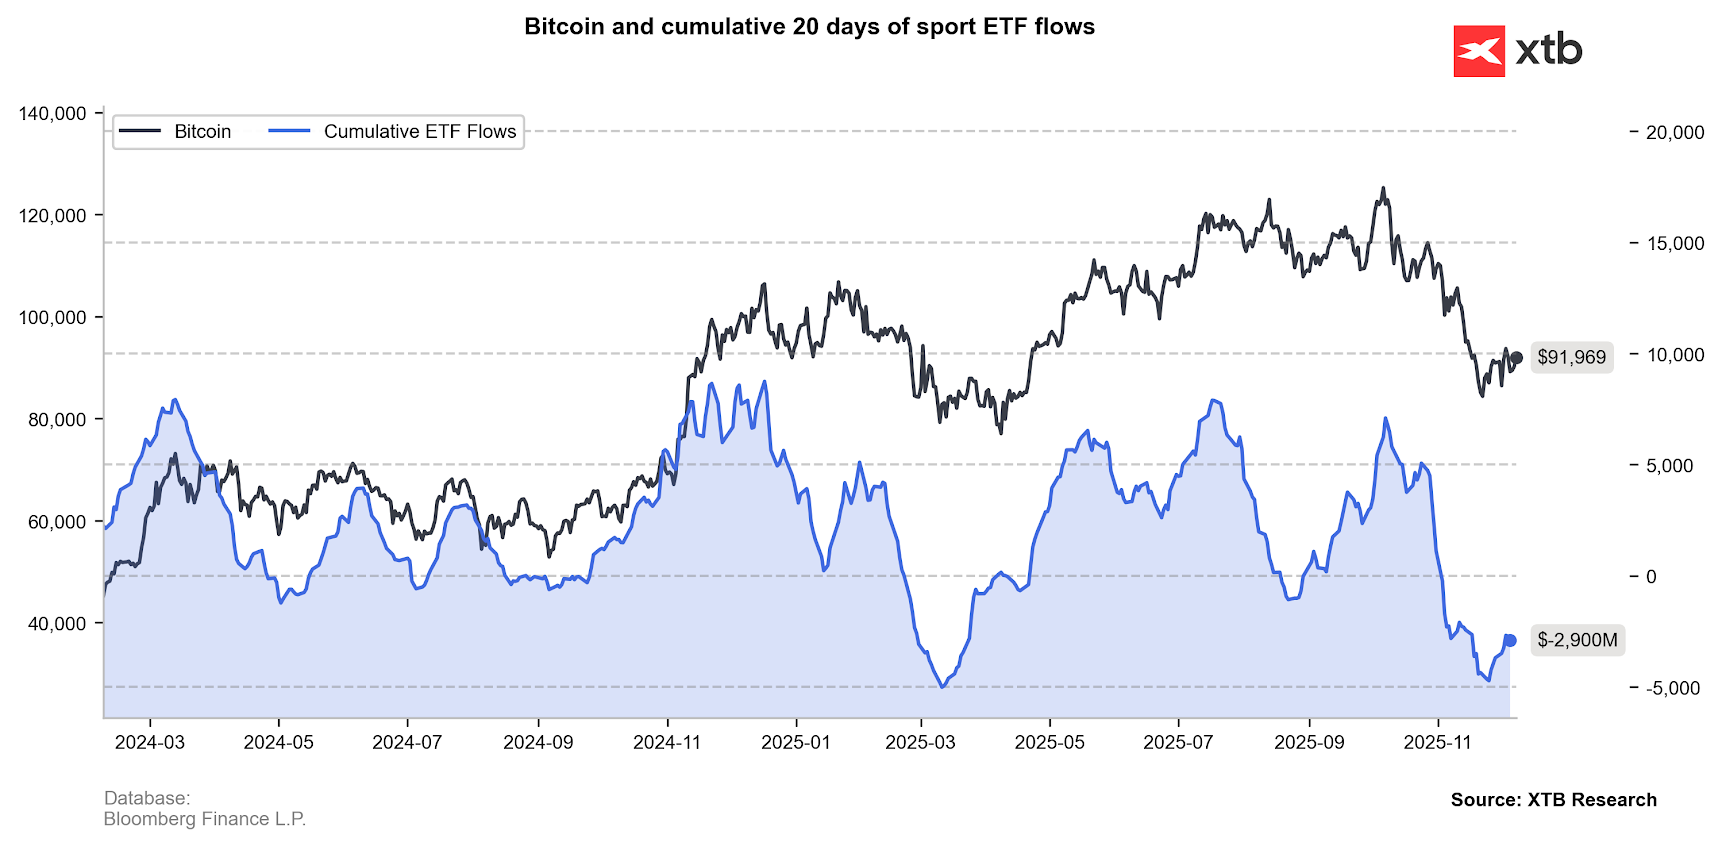
Source: XTB Research, Bloomberg Finance L.P.
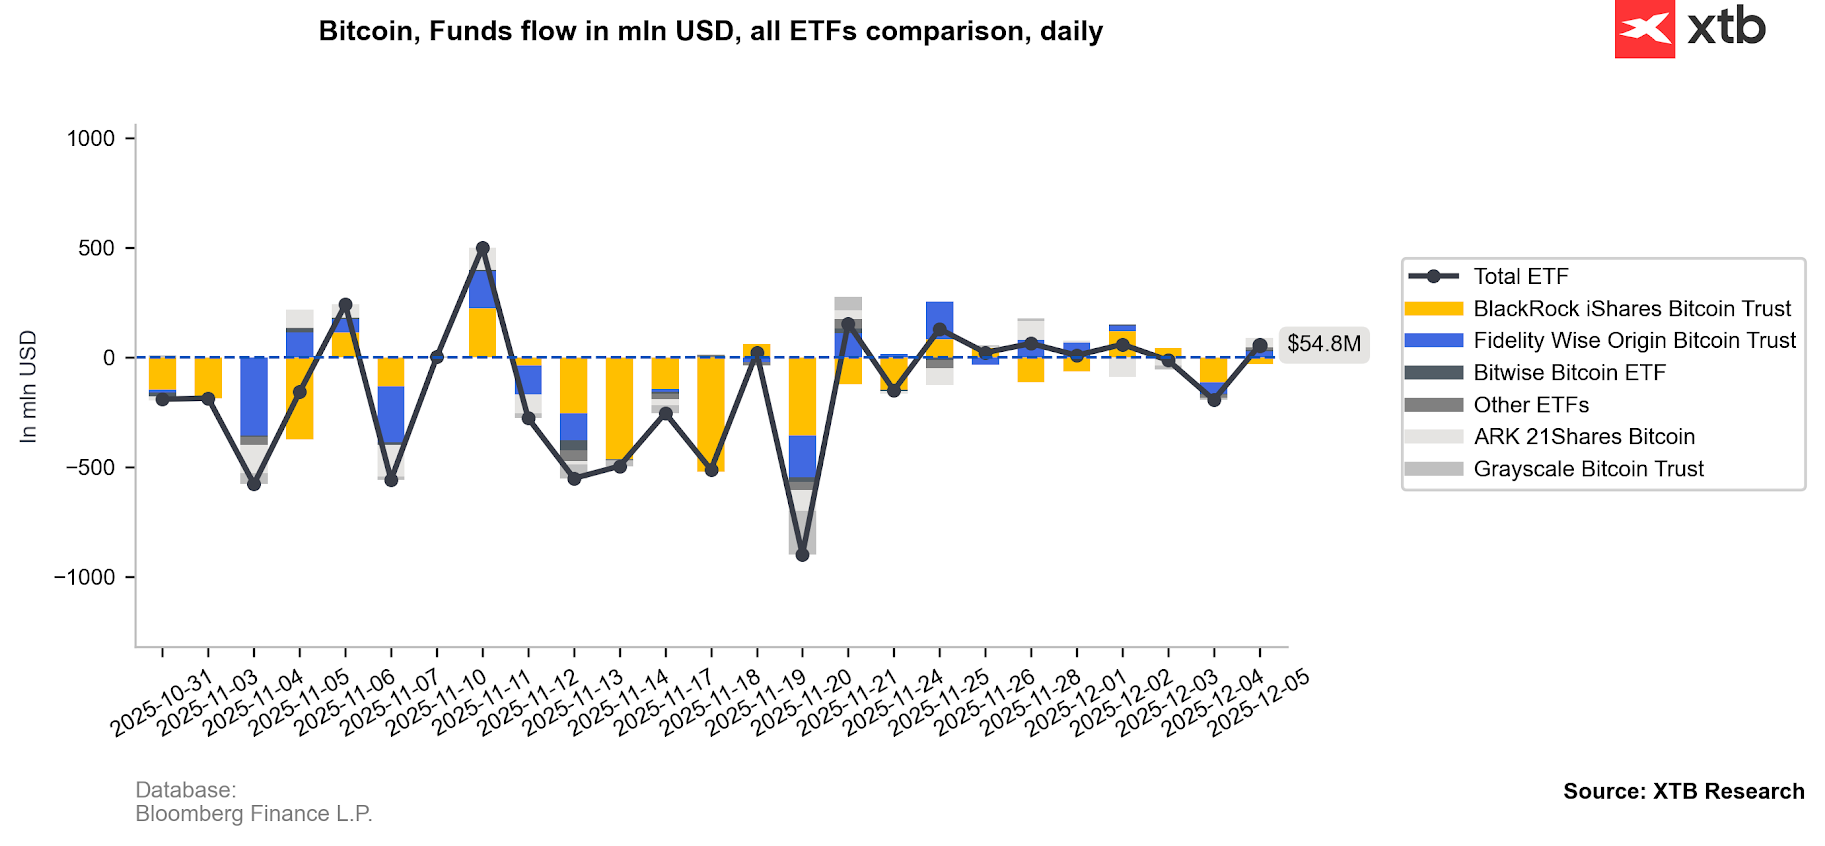
Source: XTB Research, Bloomberg Finance L.P.
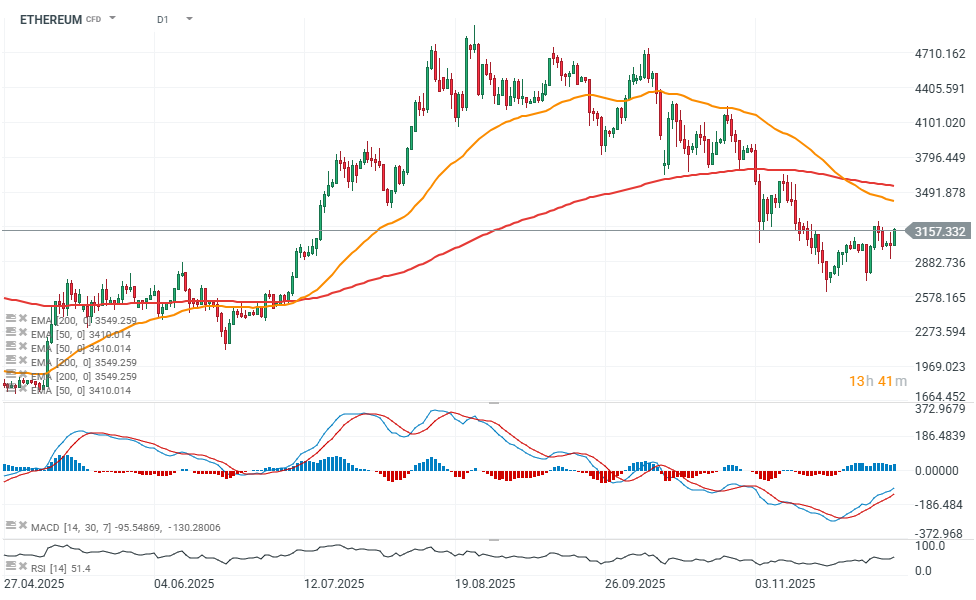
Ethereum (D1)
Ethereum is rising above 3,150 USD, but it still trades nearly 50% below its all-time highs from October. The MACD and RSI indicators suggest potential bullish momentum from current levels. A drop below 2,850 USD could pave the way for a deeper decline and a test of 2,600 USD.
Source: xStation5
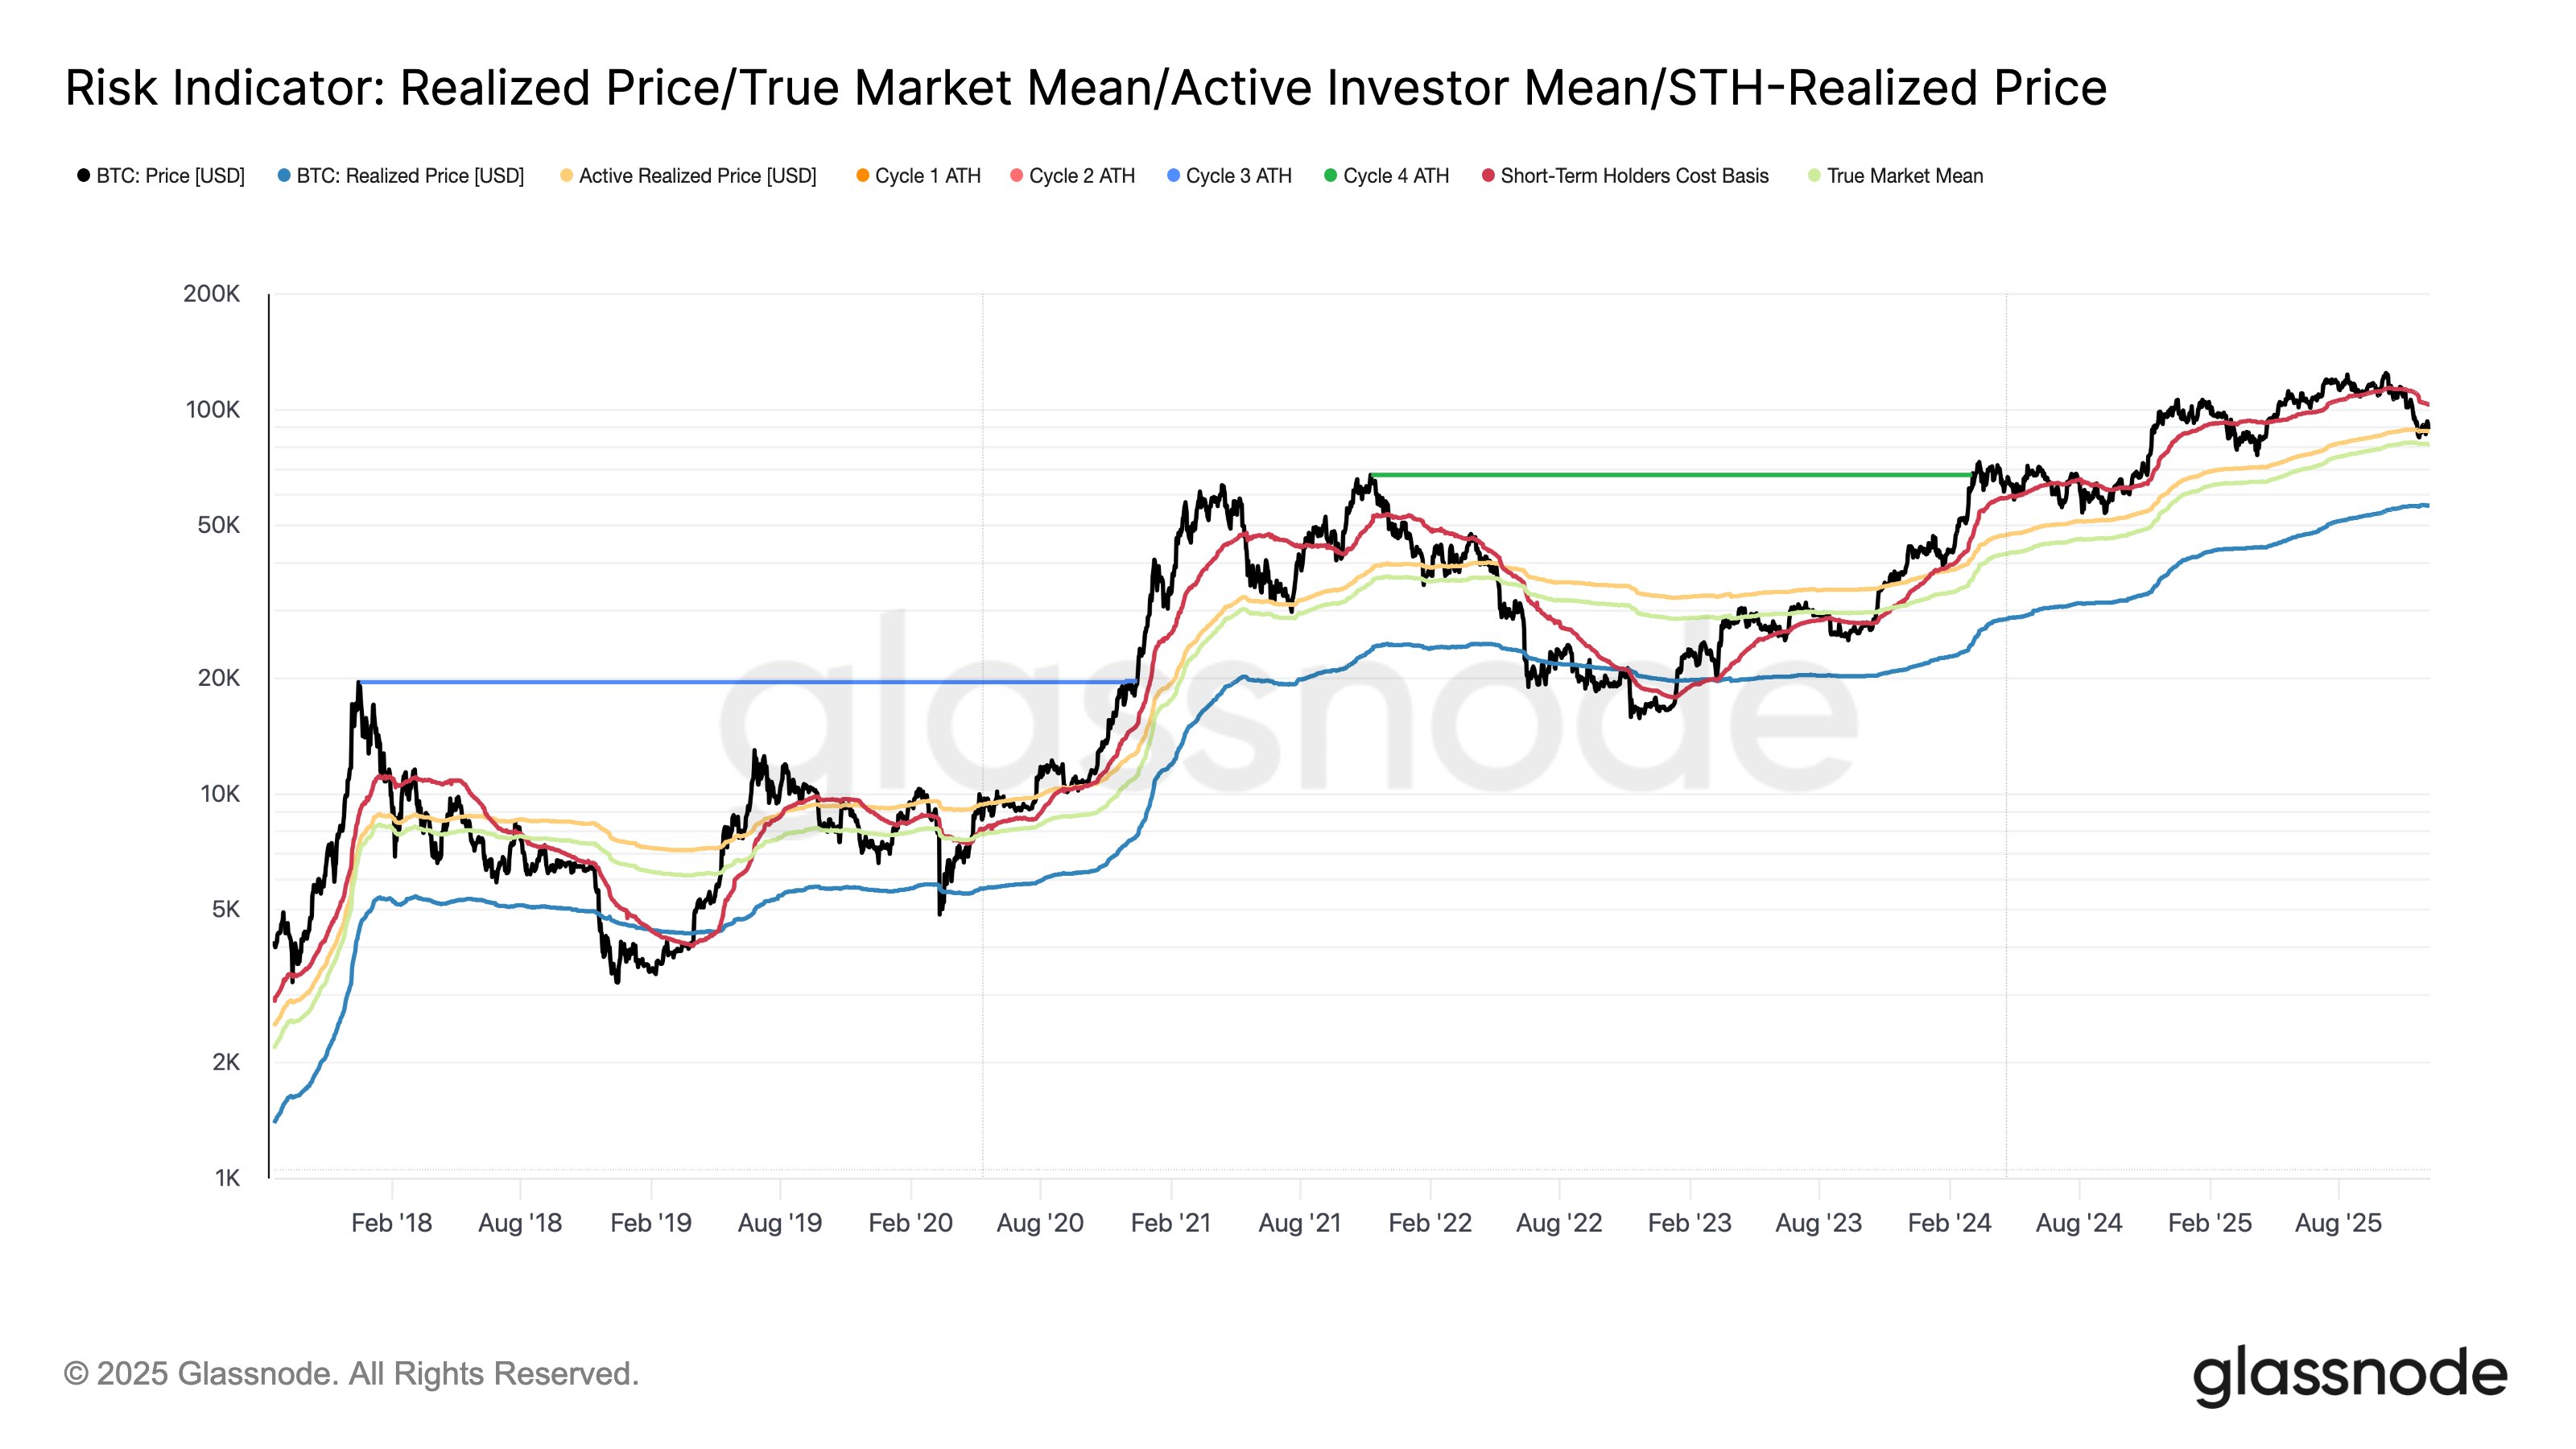
On-chain data
On-chain data shows two significant support levels: around 88,000 USD (the average purchase price of BTC by active investors) and 81,000 USD (the average market cost basis of all Bitcoins in circulation).
Source: Glassnode
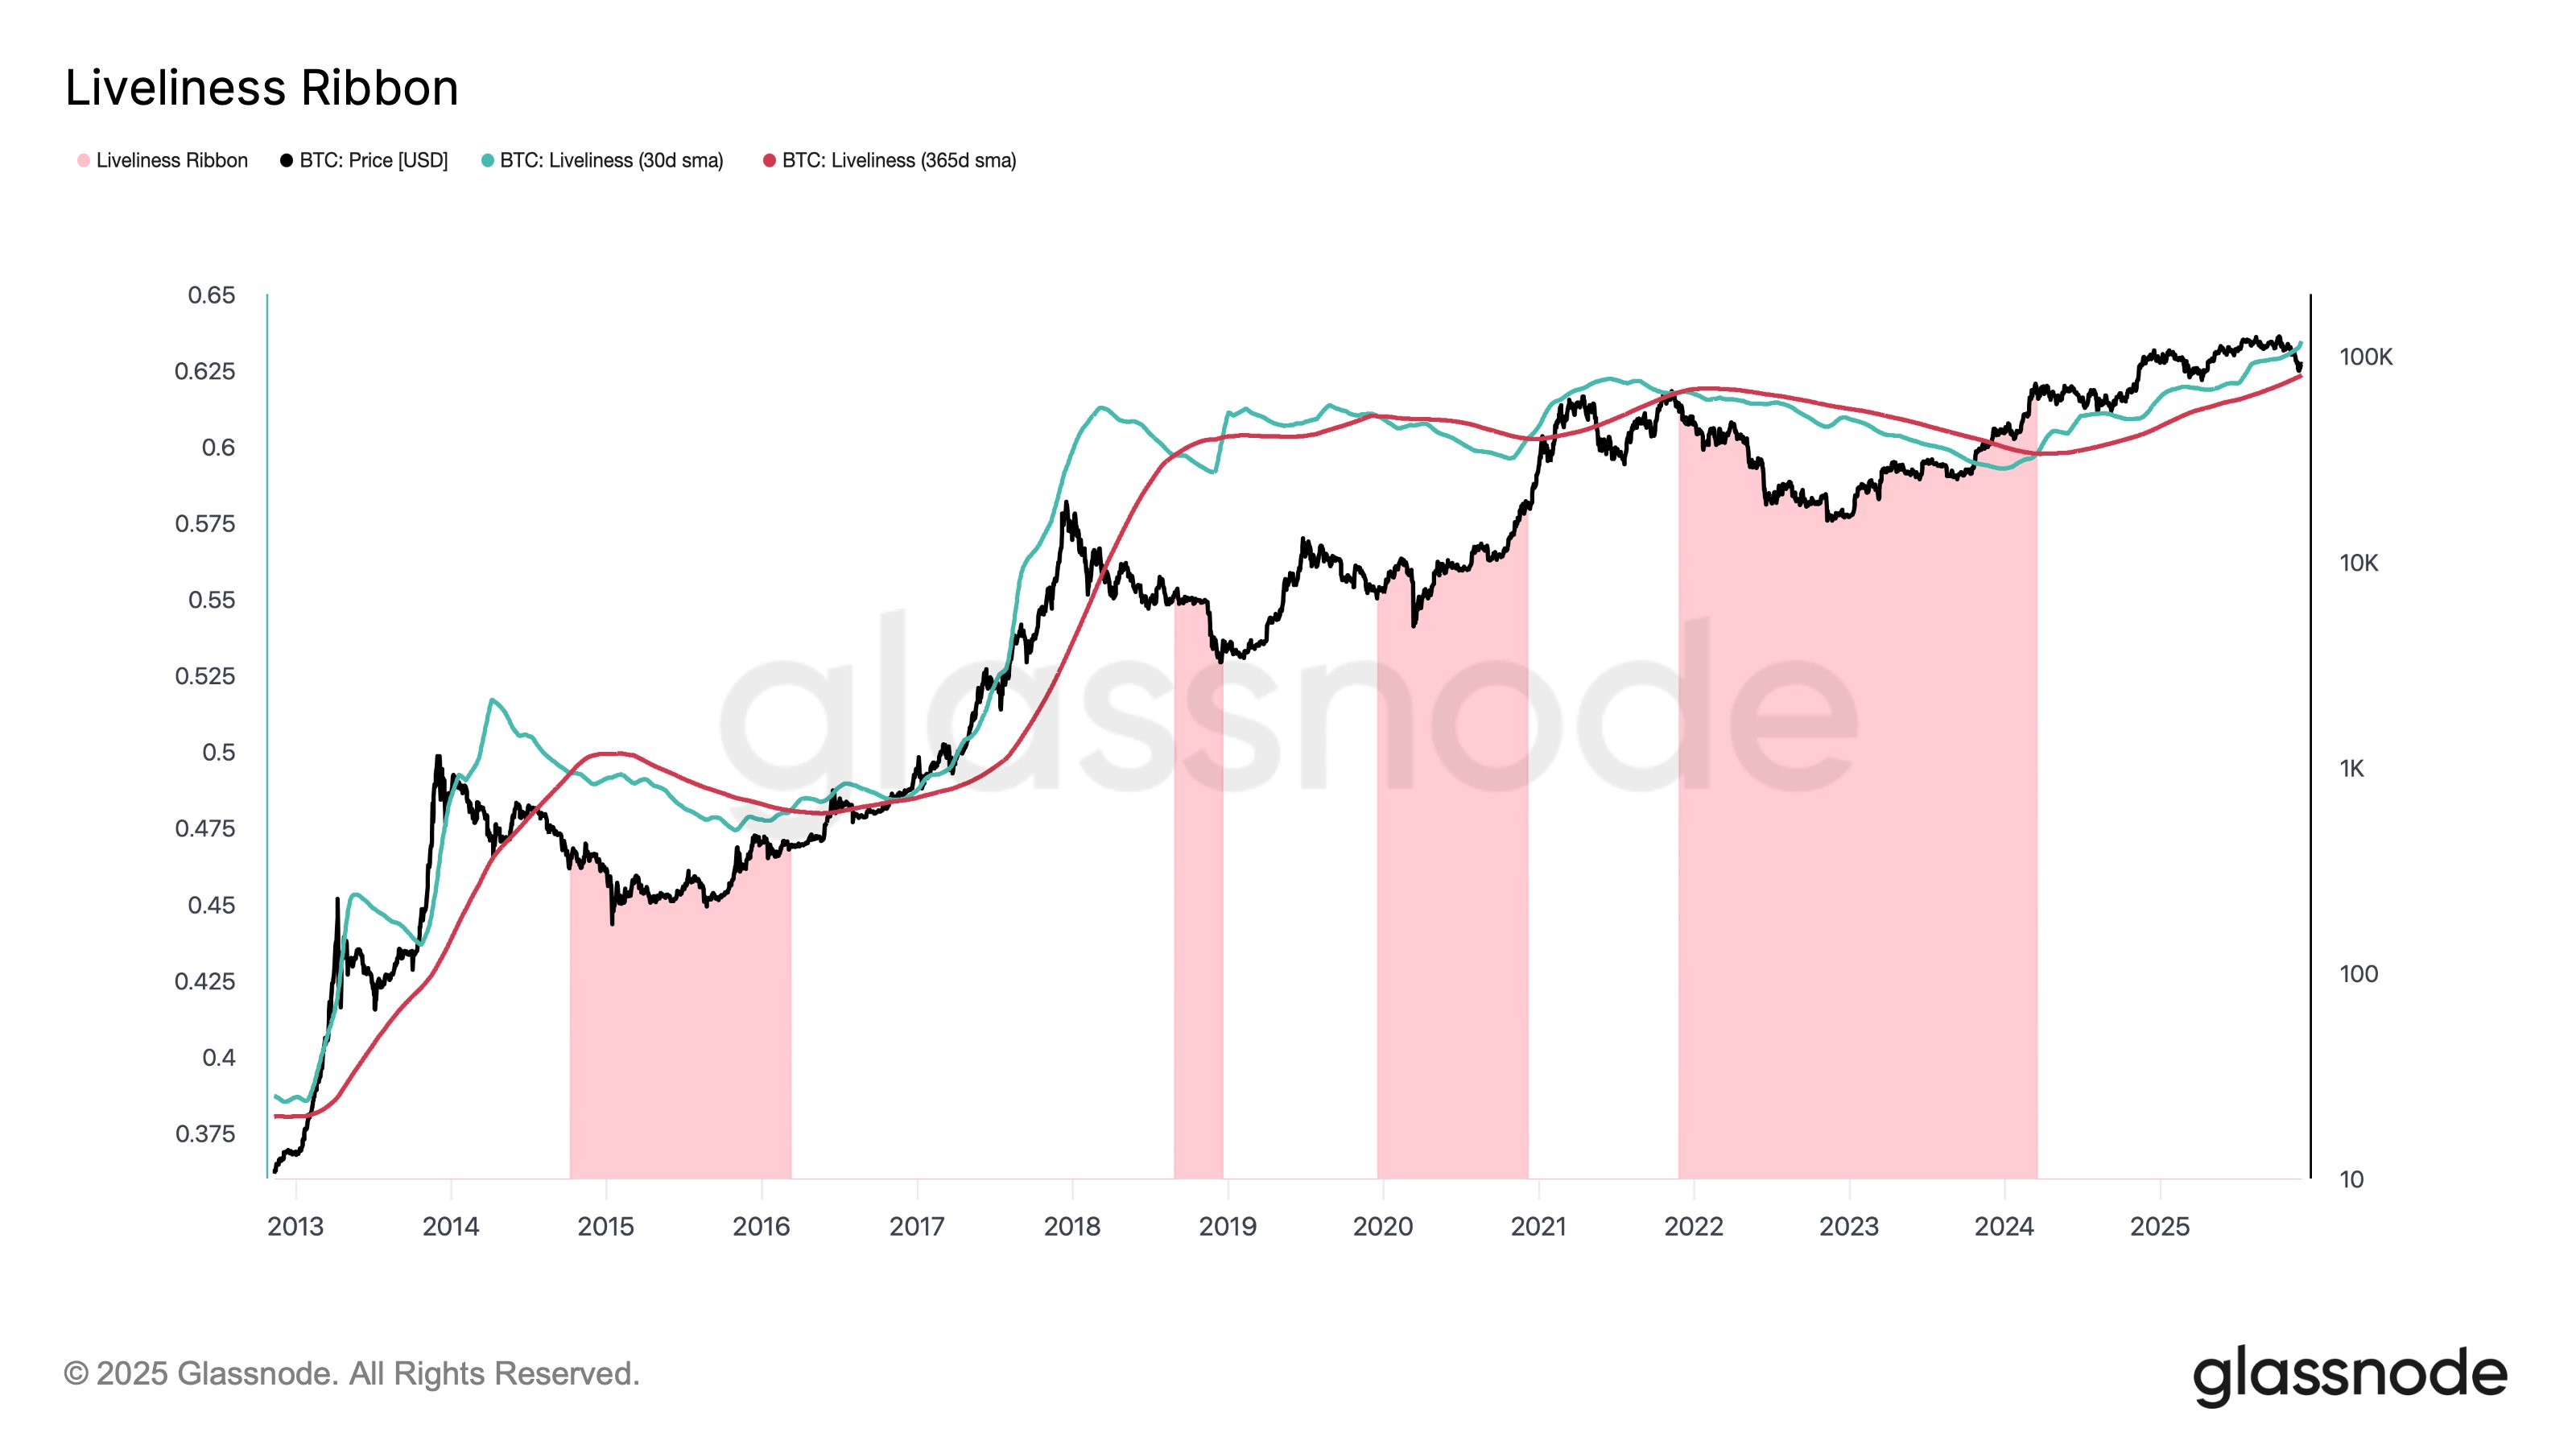
The so-called Liveliness indicator measures the relationship between Bitcoin spending and long-term holding — it rises when BTC circulate more actively and falls when investors choose to accumulate rather than sell.
- This metric typically increases during bull markets, as more Bitcoins change hands at higher prices, reflecting the inflow of new capital.
- When demand weakens, Liveliness momentum slows and the indicator declines. It can be viewed as a kind of long-term moving average of on-chain activity.
- At present, Liveliness is rising despite lower Bitcoin prices, which suggests a strong, persistent demand for spot BTC that is not yet reflected in price action.
- Although the indicator is not a direct market signal (it usually lags behind price), its momentum remains positive. Large, unknown entities are clearly making moves in the market — even if this is not yet visible in the price itself.
Source: Glassnode
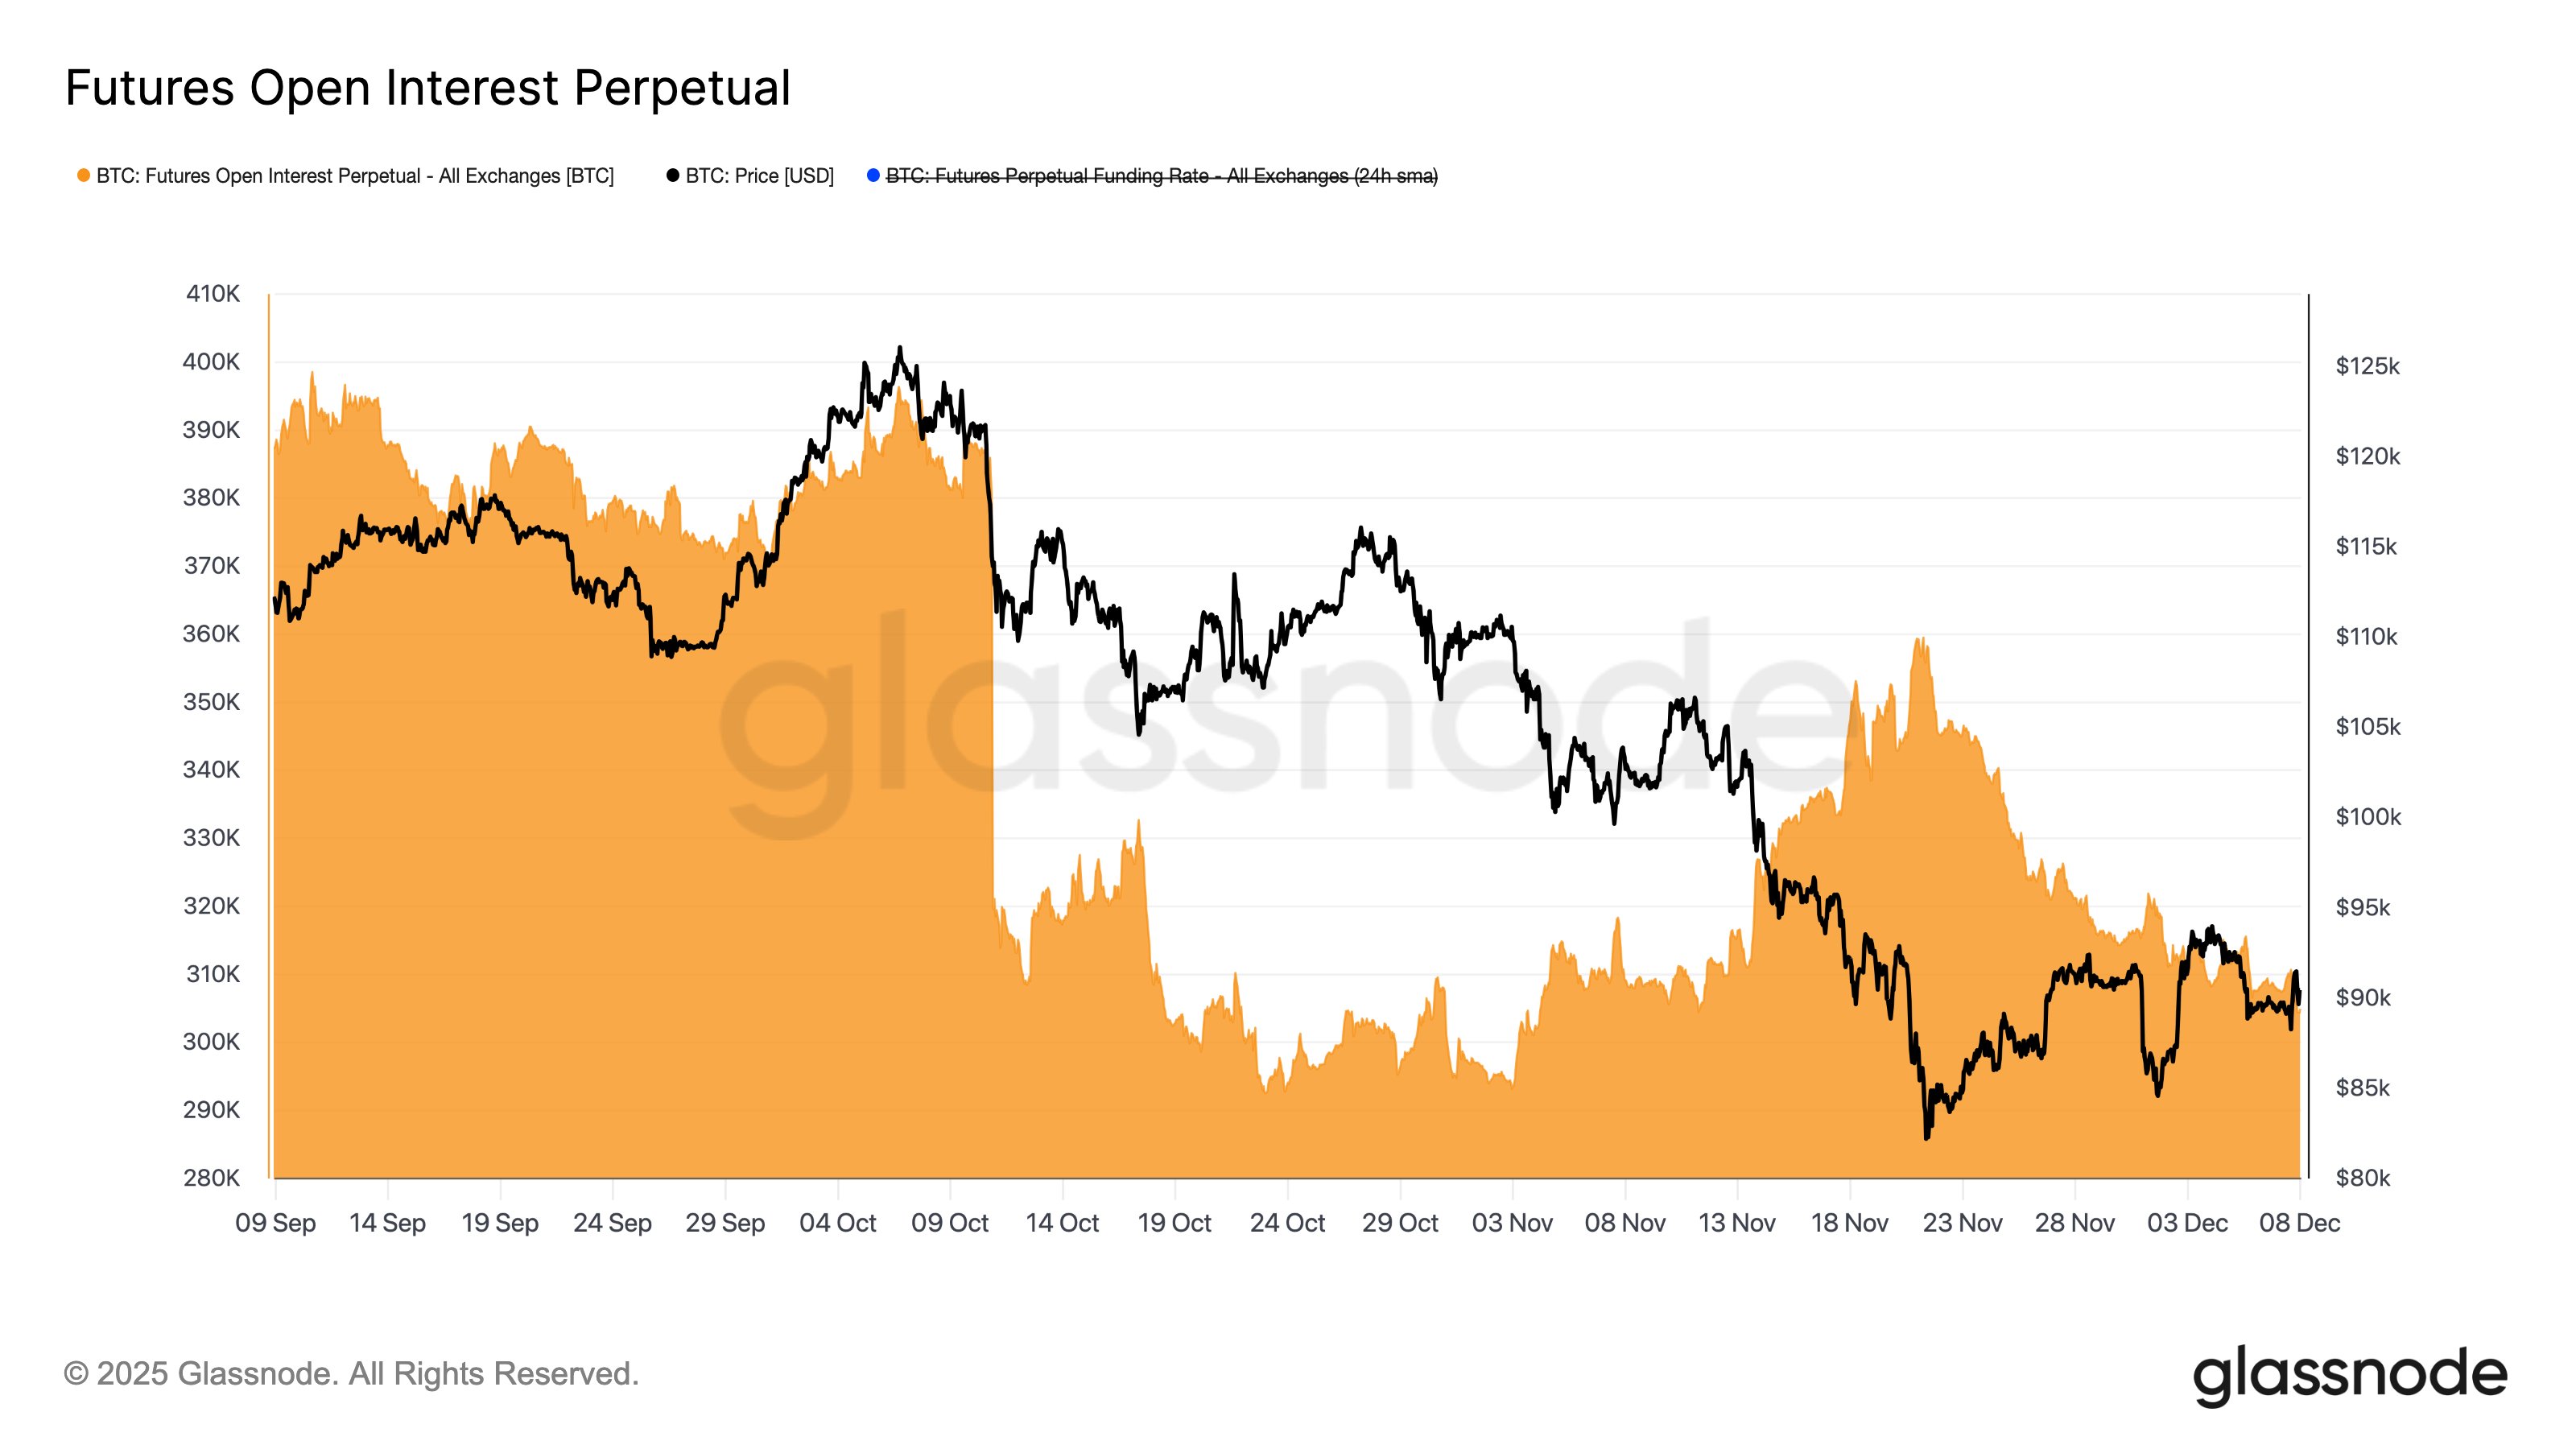
Speculative interest in Bitcoin, measured by the value of open futures positions, has declined and remains subdued compared to the levels observed before October 10.
Source: Glassnode

Daily Summary: Chip War Weighs on Wall Street as Oil Plunges After US–Iran Ceasefire ⭐

Nasdaq-100 under pressure after chip sell-off

China Is Building Its Own Chip-Making Machines. ASML Under Pressure as the Technology War Enters a New Phase

Ethereum close to $2,000
The content of this report has been created by XTB S.A., with its registered office in Warsaw, at Prosta 67, 00-838 Warsaw, Poland, (KRS number 0000217580) and supervised by Polish Supervision Authority ( No. DDM-M-4021-57-1/2005). This material is a marketing communication within the meaning of Art. 24 (3) of Directive 2014/65/EU of the European Parliament and of the Council of 15 May 2014 on markets in financial instruments and amending Directive 2002/92/EC and Directive 2011/61/EU (MiFID II). Marketing communication is not an investment recommendation or information recommending or suggesting an investment strategy within the meaning of Regulation (EU) No 596/2014 of the European Parliament and of the Council of 16 April 2014 on market abuse (market abuse regulation) and repealing Directive 2003/6/EC of the European Parliament and of the Council and Commission Directives 2003/124/EC, 2003/125/EC and 2004/72/EC and Commission Delegated Regulation (EU) 2016/958 of 9 March 2016 supplementing Regulation (EU) No 596/2014 of the European Parliament and of the Council with regard to regulatory technical standards for the technical arrangements for objective presentation of investment recommendations or other information recommending or suggesting an investment strategy and for disclosure of particular interests or indications of conflicts of interest or any other advice, including in the area of investment advisory, within the meaning of the Trading in Financial Instruments Act of 29 July 2005 (i.e. Journal of Laws 2019, item 875, as amended). The marketing communication is prepared with the highest diligence, objectivity, presents the facts known to the author on the date of preparation and is devoid of any evaluation elements. The marketing communication is prepared without considering the client’s needs, his individual financial situation and does not present any investment strategy in any way. The marketing communication does not constitute an offer of sale, offering, subscription, invitation to purchase, advertisement or promotion of any financial instruments. XTB S.A. is not liable for any client’s actions or omissions, in particular for the acquisition or disposal of financial instruments, undertaken on the basis of the information contained in this marketing communication. In the event that the marketing communication contains any information about any results regarding the financial instruments indicated therein, these do not constitute any guarantee or forecast regarding the future results.