
Looking at the chart, the current rebound phase following the decline is clearly longer than the previous one, and its percentage range is also greater. However, this alone does not guarantee a return to an uptrend. The $82–83k zone, where the 200 EMA (red line) is located, may prove to be a निर्णujący resistance area in the event of a more durable break above $80k. At this stage, the rebound still appears fragile, while the 14-day RSI has risen above 65.
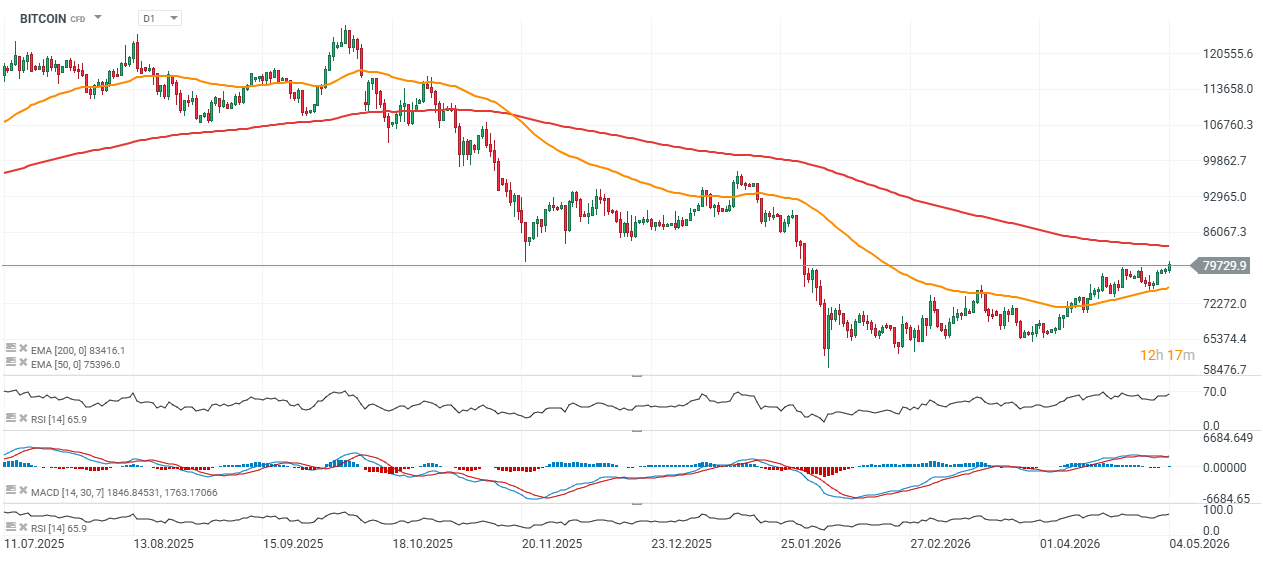
Source: xStation5
The recent slowdown in Bitcoin’s upward momentum around the short-term holder cost basis has been confirmed by on-chain data. As the price approached $80k, short-term holders began aggressively realizing profits. The 24-hour SMA of STH realized profit surged to approximately $4 million per hour — around four times higher than the baseline observed since mid-April. Short-term investors used the rally as a selling opportunity, while demand lacked sufficient liquidity to absorb this wave of profit-taking. The question remains: will this time be different?
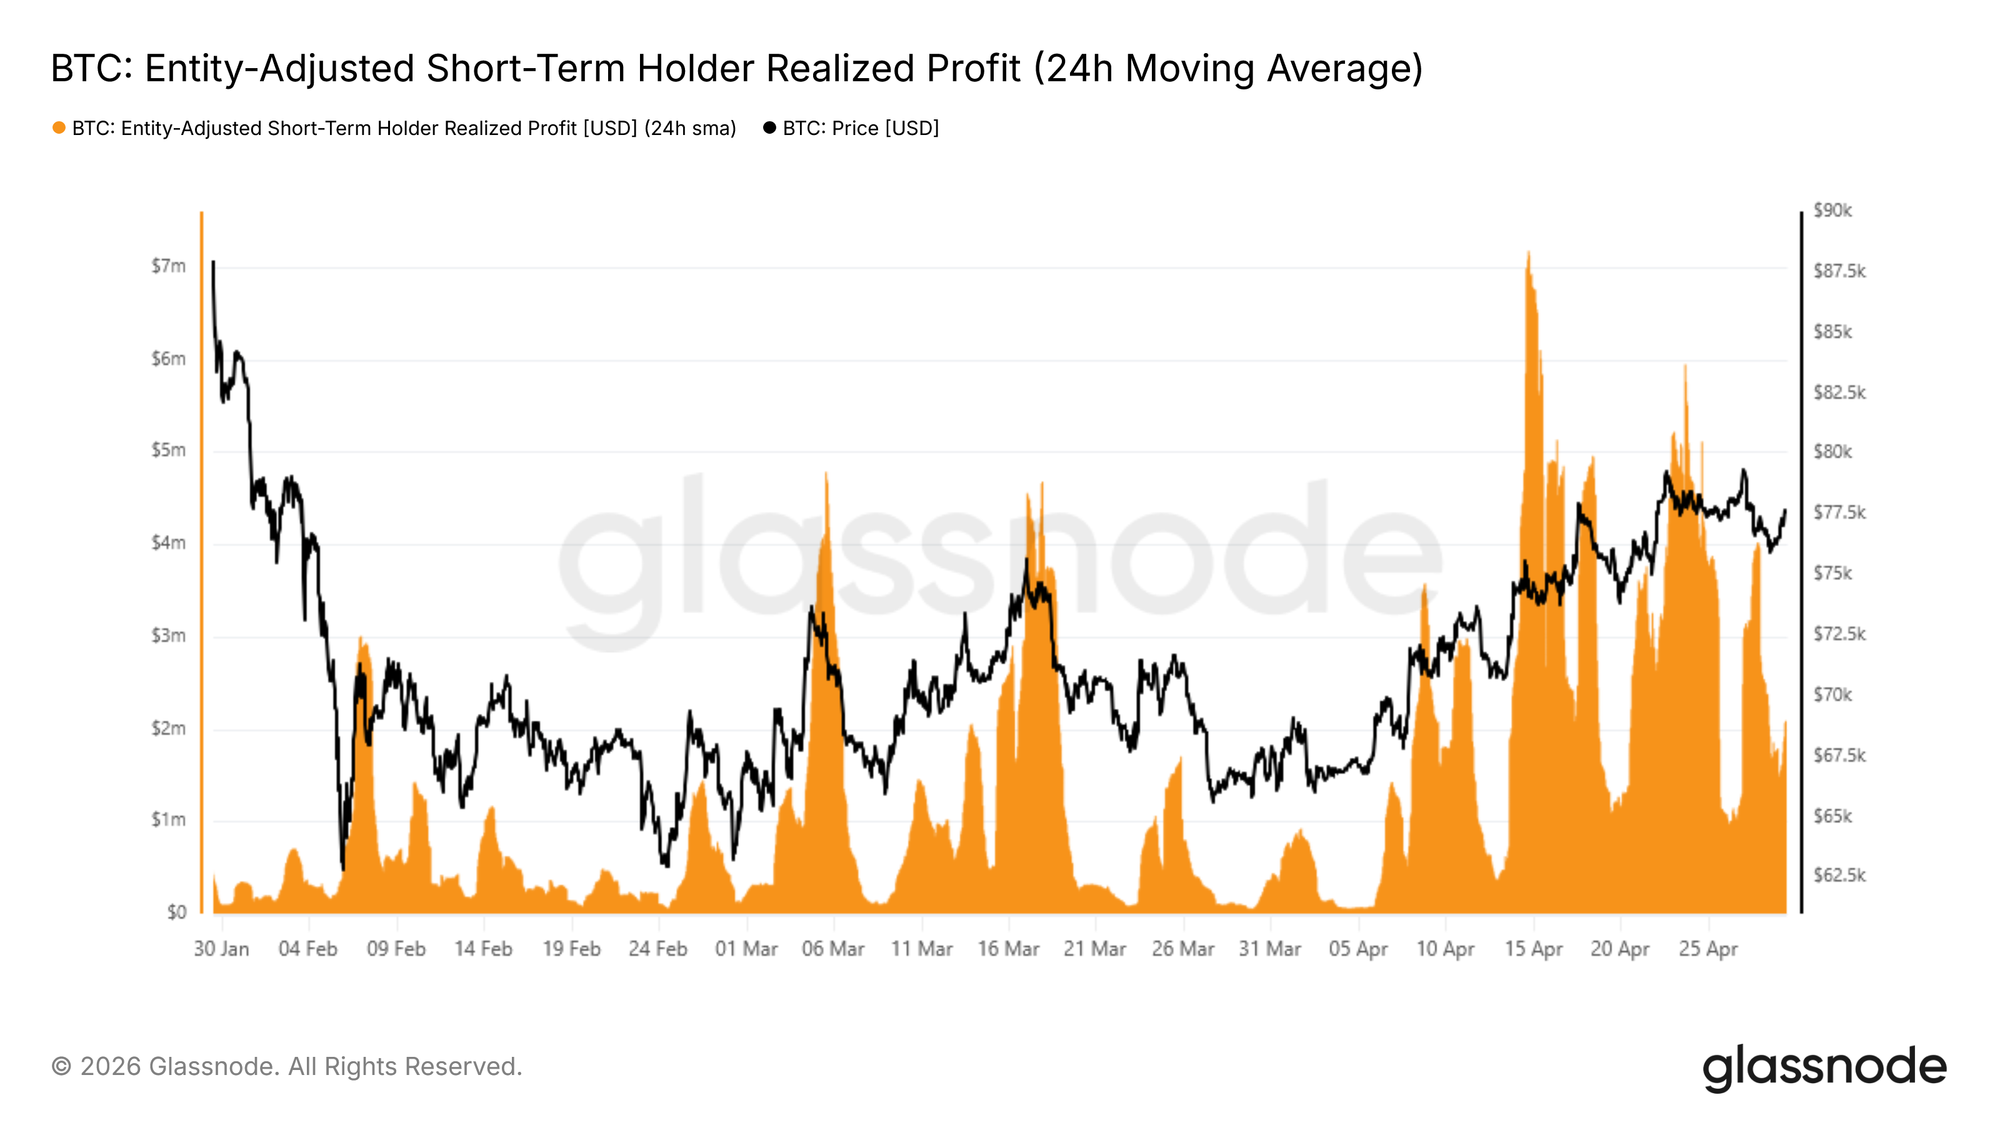
Source: Glassnode
Following the decline in implied volatility, the 25 Delta Skew illustrates how demand for protection evolved throughout April. The overall trend shows a decline in put premium, with the 1-month skew falling from around 18% to 12%. This reflects reduced demand for downside hedging as market conditions stabilized.
At the short end, the 1-week skew has been more reactive, repeatedly moving toward neutral levels of 2–4%. These moves were largely tactical, with pullbacks used to buy calls and sell downside protection. More recently, as the price approaches the $80k resistance, demand for puts has increased again. This has pushed skew back toward the 11 - 12% range across maturities. The market continues to maintain downside protection — reacting tactically in the short term while remaining cautious further along the curve.
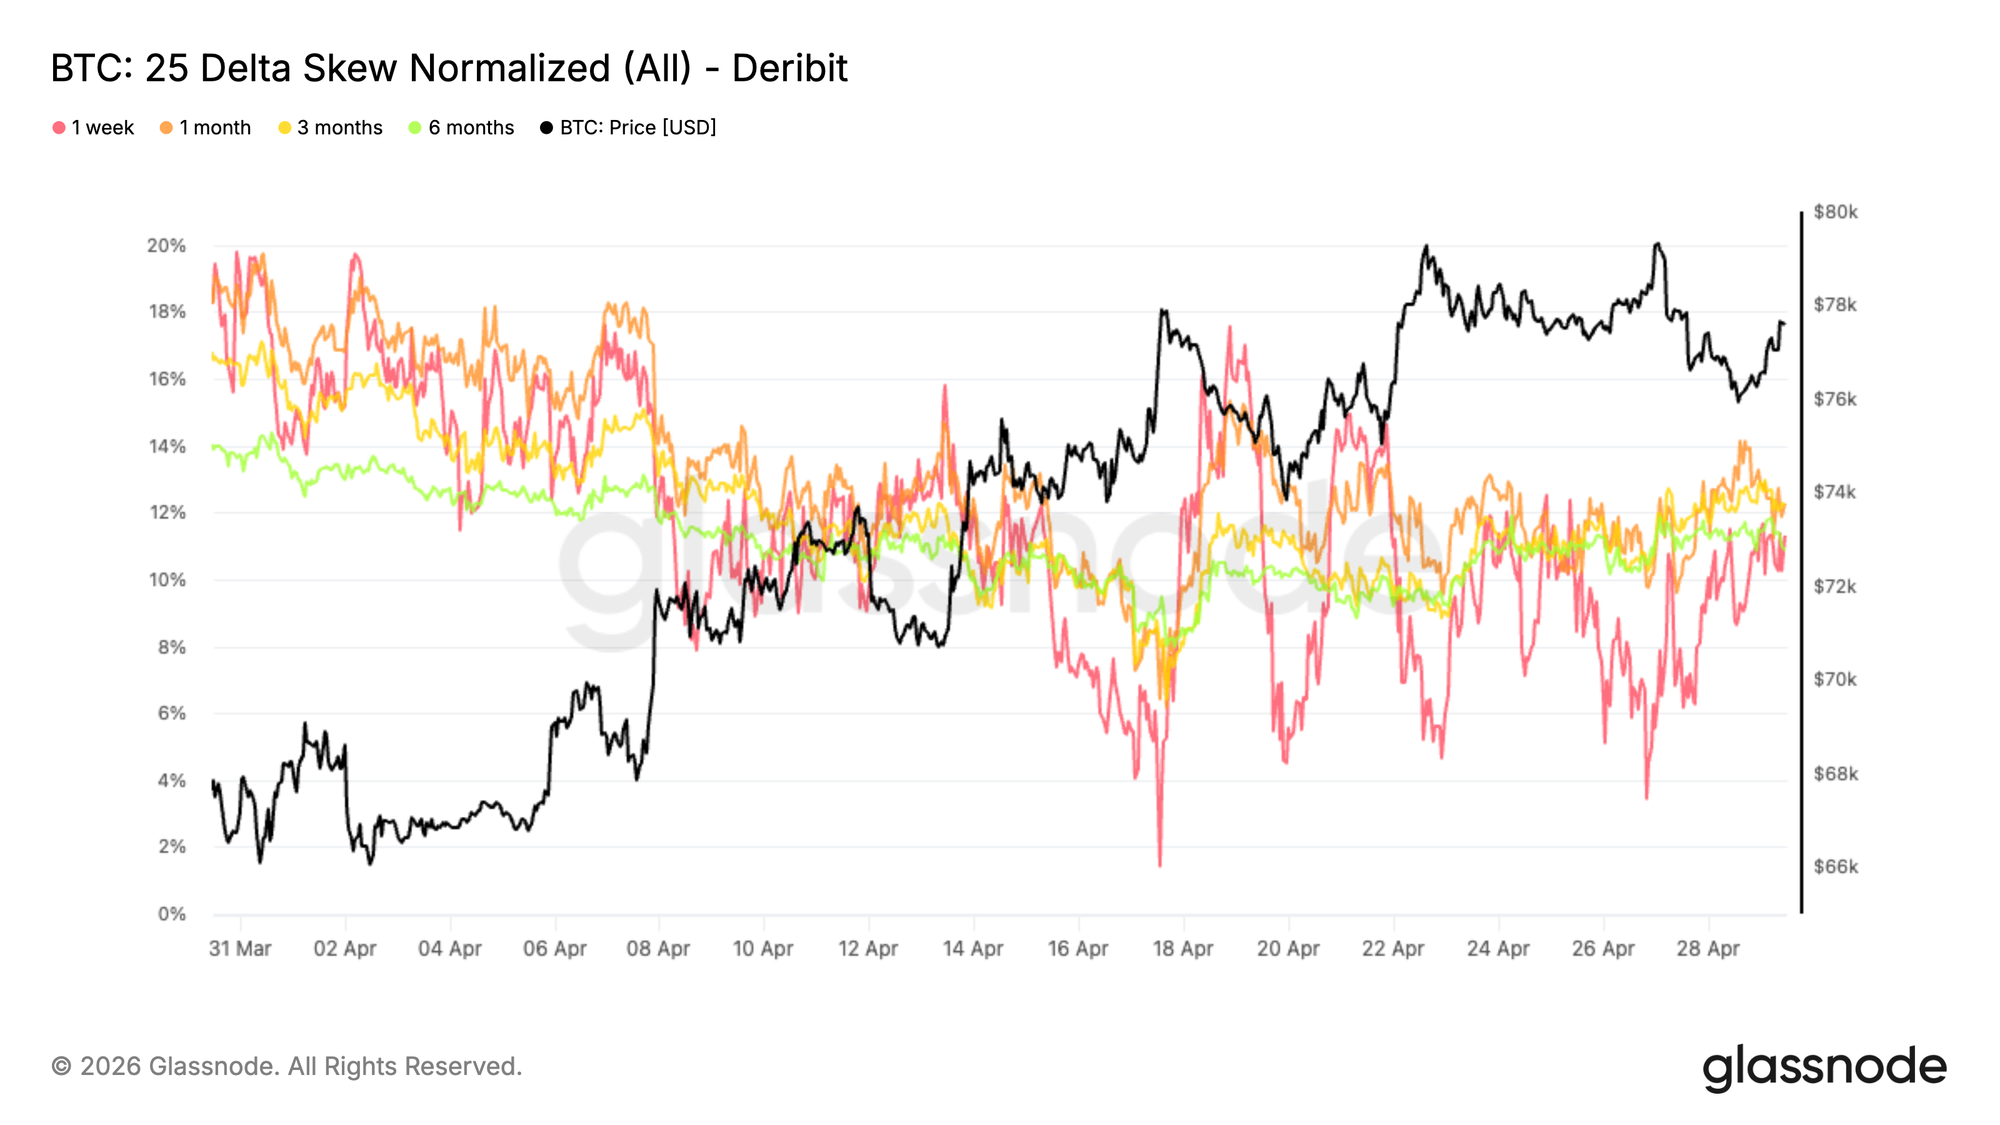
Source: Glassnode
With declining volatility and lower skew, the market is increasingly focused on positioning, with the $80k level emerging as a key pivot. Sustained demand at the 80K strike across short and mid-term maturities suggests growing interest in upside exposure, rather than positioning for a rejection at resistance.
Key short gamma zones are located at $76k on the downside and $82k on the upside. In these areas, hedging flows can amplify price movements, especially in a low-liquidity environment. A break above $80k could bring spot closer to the $82k zone, where short gamma may force dealers to buy into strength, reinforcing the move. Positioning remains cautious, but the market is increasingly exposed to a sharper upside reaction if resistance is cleared.
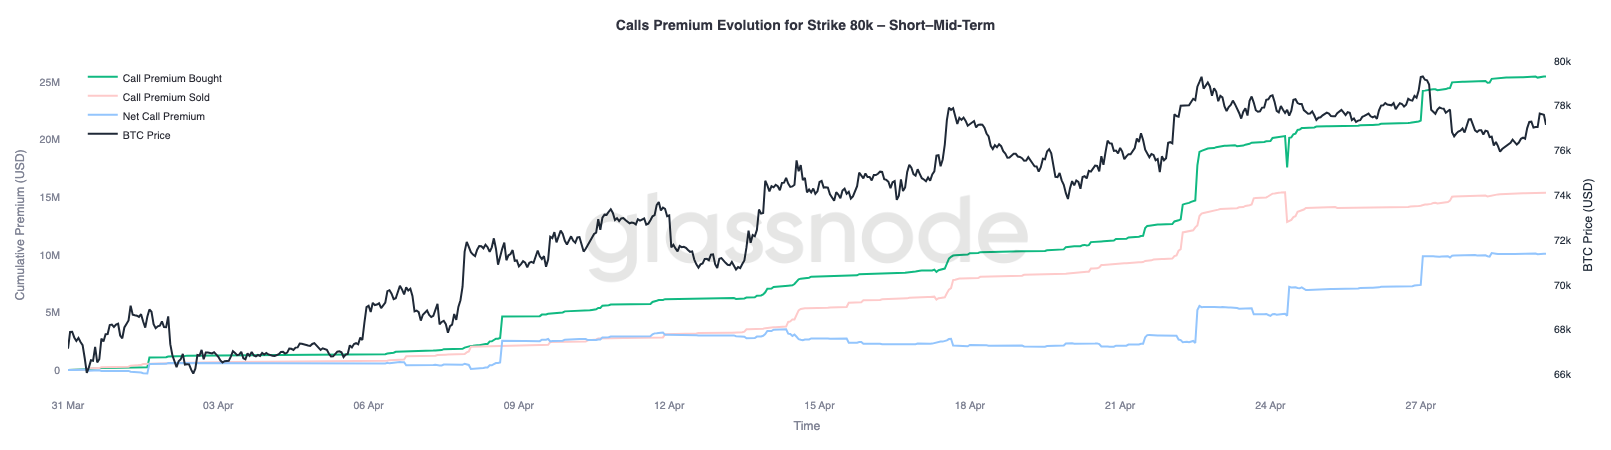
Source: Glassnode

When will the rise in oil prices reach us?

Daily Summary: Equities Diverge as Tech Lags, Europe Rallies on Earnings & PMIs (24.07.2026)

Three markets to watch next week (24.07.2026)

Oil Slides Ahead of the Weekend!
The content of this report has been created by XTB S.A., with its registered office in Warsaw, at Prosta 67, 00-838 Warsaw, Poland, (KRS number 0000217580) and supervised by Polish Supervision Authority ( No. DDM-M-4021-57-1/2005). This material is a marketing communication within the meaning of Art. 24 (3) of Directive 2014/65/EU of the European Parliament and of the Council of 15 May 2014 on markets in financial instruments and amending Directive 2002/92/EC and Directive 2011/61/EU (MiFID II). Marketing communication is not an investment recommendation or information recommending or suggesting an investment strategy within the meaning of Regulation (EU) No 596/2014 of the European Parliament and of the Council of 16 April 2014 on market abuse (market abuse regulation) and repealing Directive 2003/6/EC of the European Parliament and of the Council and Commission Directives 2003/124/EC, 2003/125/EC and 2004/72/EC and Commission Delegated Regulation (EU) 2016/958 of 9 March 2016 supplementing Regulation (EU) No 596/2014 of the European Parliament and of the Council with regard to regulatory technical standards for the technical arrangements for objective presentation of investment recommendations or other information recommending or suggesting an investment strategy and for disclosure of particular interests or indications of conflicts of interest or any other advice, including in the area of investment advisory, within the meaning of the Trading in Financial Instruments Act of 29 July 2005 (i.e. Journal of Laws 2019, item 875, as amended). The marketing communication is prepared with the highest diligence, objectivity, presents the facts known to the author on the date of preparation and is devoid of any evaluation elements. The marketing communication is prepared without considering the client’s needs, his individual financial situation and does not present any investment strategy in any way. The marketing communication does not constitute an offer of sale, offering, subscription, invitation to purchase, advertisement or promotion of any financial instruments. XTB S.A. is not liable for any client’s actions or omissions, in particular for the acquisition or disposal of financial instruments, undertaken on the basis of the information contained in this marketing communication. In the event that the marketing communication contains any information about any results regarding the financial instruments indicated therein, these do not constitute any guarantee or forecast regarding the future results.