
The EUR/USD exchange rate is trading around 1.1719 on Monday, and despite seemingly positive industrial data, the eurozone is sending out worrying signals. The final reading of the PMI index for the manufacturing sector stood at 52.2 points in April, up from 51.6 a month earlier, which at first glance looks like a solid improvement. In reality, however, the rise in manufacturing activity is not driven by real demand, but by increased stockpiling by firms seeking to secure goods against further shortages and price rises resulting from the escalation of tensions in the Middle East. This is a seemingly positive result, which in fact says more about the fear of supply chain disruptions than about the actual strength of the European economy.
The devil is in the details, and it is these details that are shaping the outlook for both growth and inflation in the eurozone. Delivery delays have reached their worst level since July 2022, input cost inflation has risen to a 46-month high, and price pressures are increasingly being passed on to selling prices, marking the largest monthly jump since records began in 1997. As a result, the ECB faces a real dilemma: the data suggest a recovery, but leading indicators of producer sentiment and expectations merely confirm the growing risk of stagflation. For EUR/USD, this implies an environment of heightened uncertainty, in which the exchange rate may be prone to sharp movements depending on further signals from the Fed and the ECB, and any stronger US inflation data could push the pair back towards the support level at 1.1650.
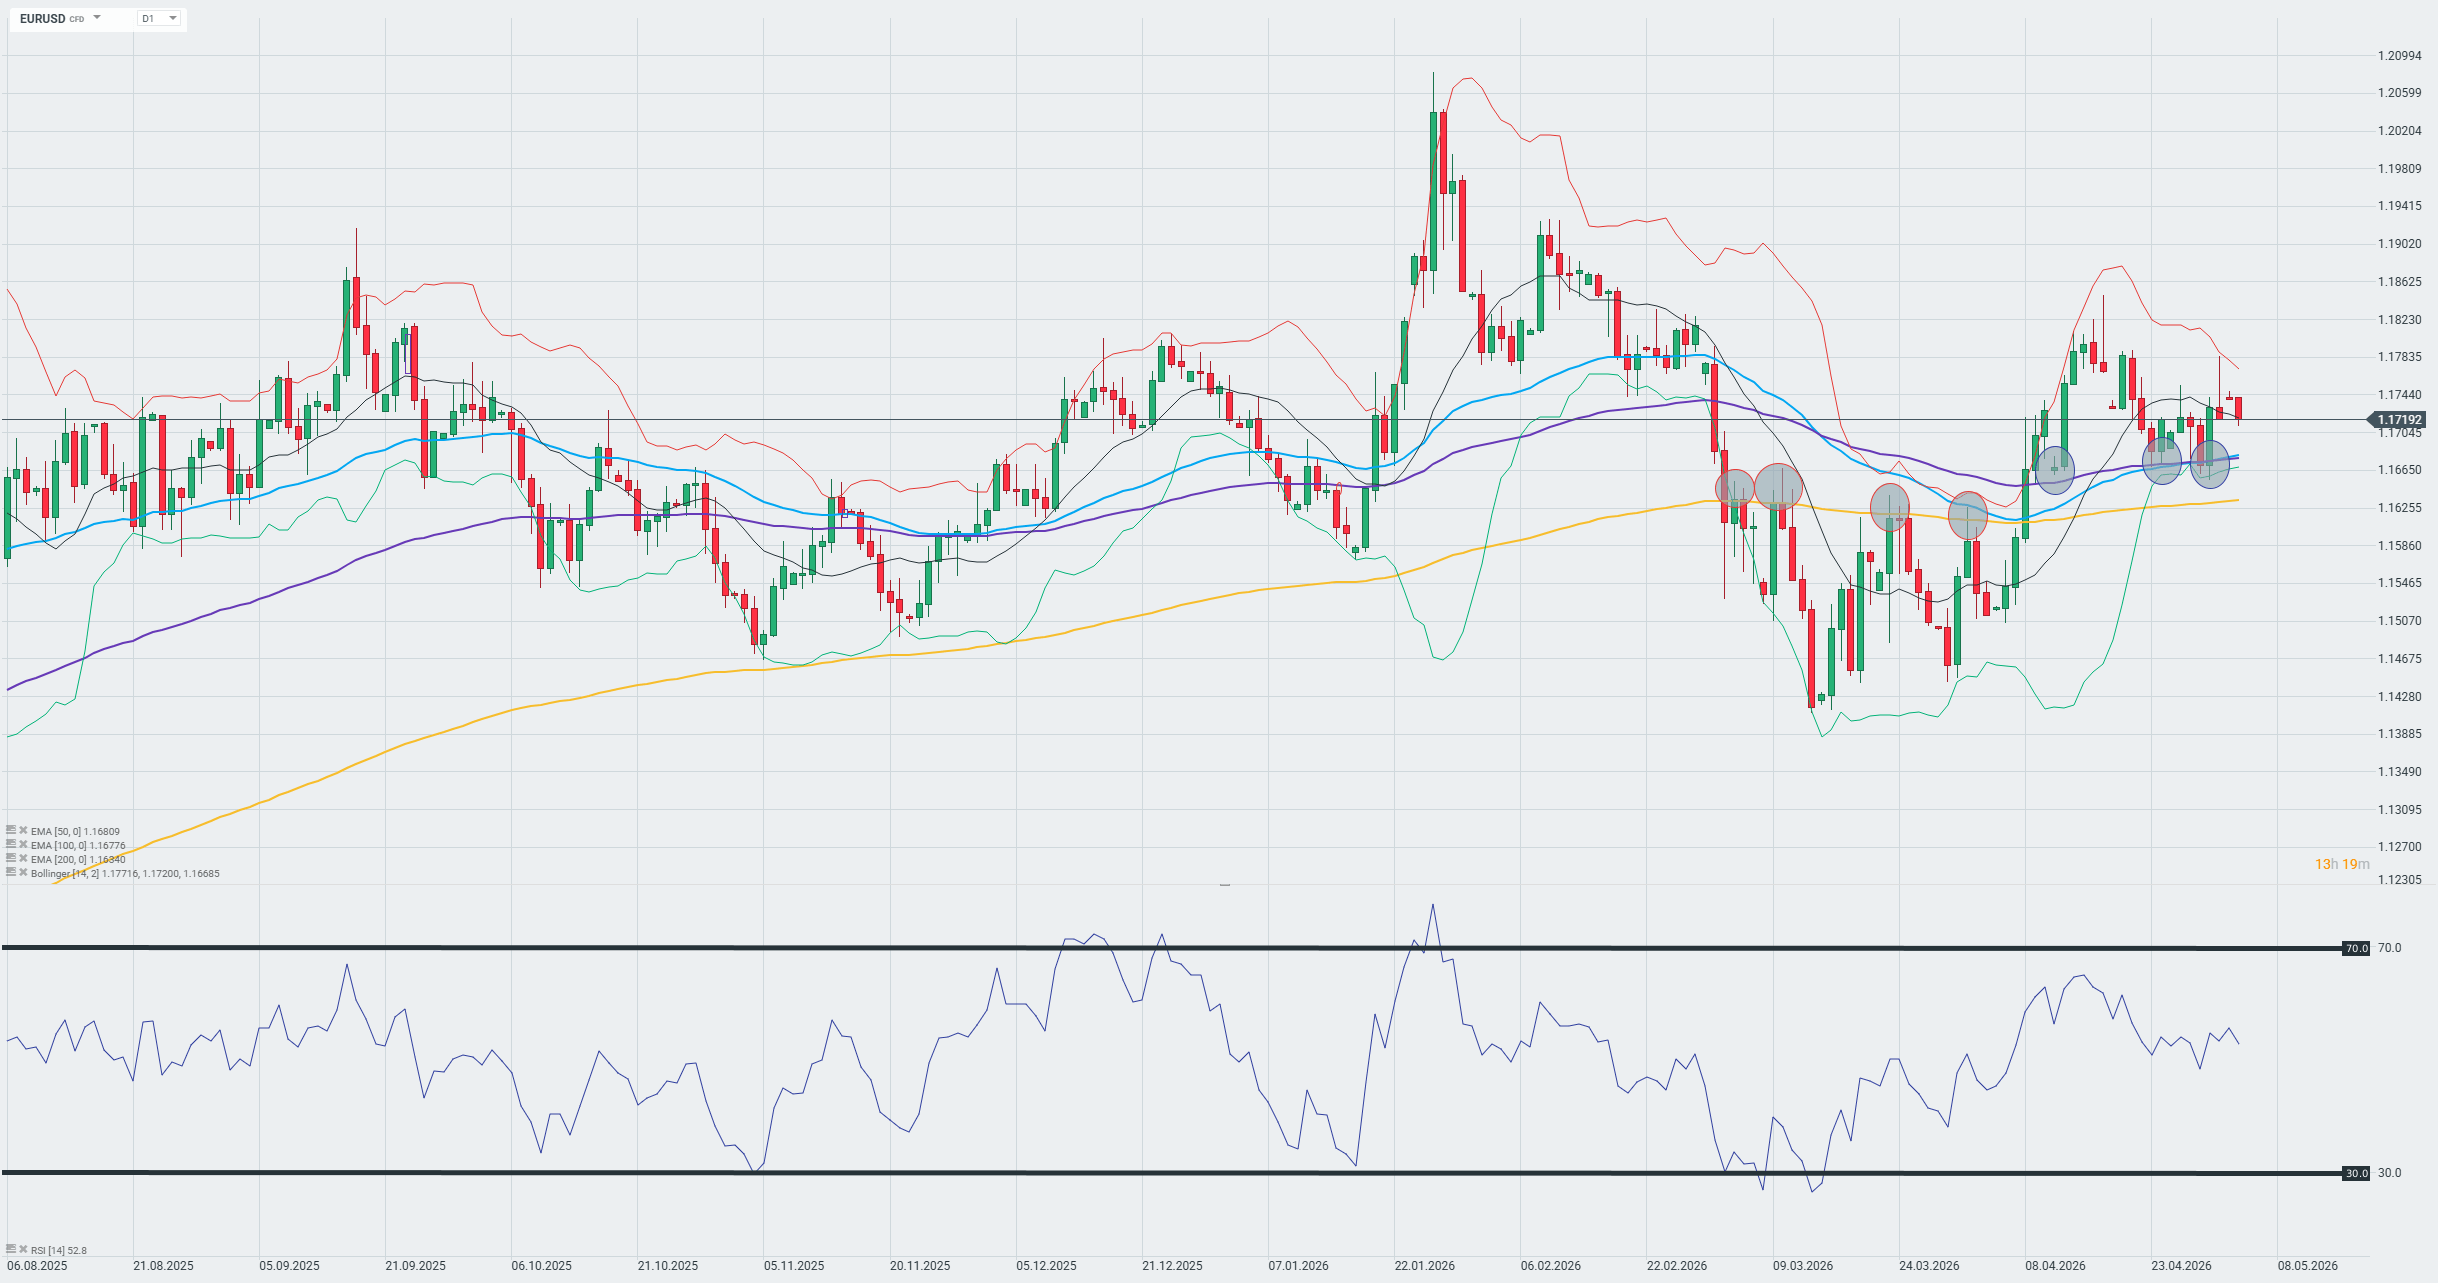
On the EUR/USD daily chart, following a sharp rally to around 1.2060 at the start of the year, the exchange rate underwent a significant correction that brought prices down to lows around 1.1380, from where a rebound occurred. Currently, the pair is trading at 1.1719, oscillating near the 50-day EMA (1.1681) and the 100-day EMA (1.1678), which together form a dynamic support zone, while the 200-day EMA at 1.1634 serves as another line of defense for the bulls. Bollinger Bands indicate narrowing volatility, with the upper band at 1.1771 and the lower band at 1.1669, signaling a potential breakout in the coming sessions. The RSI is hovering around the neutral level of 52, which does not provide a clear directional signal and suggests that the market is still looking for momentum for a decisive move above the resistance at 1.1800 or a deeper correction toward the aforementioned 200-day EMA support.
Source: xStation

US Open: Wall Street Rebounds After US Iran Ceasefire

🔴European TTF gas prices fall by 7.5%

Economic Calendar: What you need to watch closely this week❓ (27.07.2026)

Morning Wrap: The weekend slump in oil prices is accelerating 💥 (27.07.2026)
The content of this report has been created by XTB S.A., with its registered office in Warsaw, at Prosta 67, 00-838 Warsaw, Poland, (KRS number 0000217580) and supervised by Polish Supervision Authority ( No. DDM-M-4021-57-1/2005). This material is a marketing communication within the meaning of Art. 24 (3) of Directive 2014/65/EU of the European Parliament and of the Council of 15 May 2014 on markets in financial instruments and amending Directive 2002/92/EC and Directive 2011/61/EU (MiFID II). Marketing communication is not an investment recommendation or information recommending or suggesting an investment strategy within the meaning of Regulation (EU) No 596/2014 of the European Parliament and of the Council of 16 April 2014 on market abuse (market abuse regulation) and repealing Directive 2003/6/EC of the European Parliament and of the Council and Commission Directives 2003/124/EC, 2003/125/EC and 2004/72/EC and Commission Delegated Regulation (EU) 2016/958 of 9 March 2016 supplementing Regulation (EU) No 596/2014 of the European Parliament and of the Council with regard to regulatory technical standards for the technical arrangements for objective presentation of investment recommendations or other information recommending or suggesting an investment strategy and for disclosure of particular interests or indications of conflicts of interest or any other advice, including in the area of investment advisory, within the meaning of the Trading in Financial Instruments Act of 29 July 2005 (i.e. Journal of Laws 2019, item 875, as amended). The marketing communication is prepared with the highest diligence, objectivity, presents the facts known to the author on the date of preparation and is devoid of any evaluation elements. The marketing communication is prepared without considering the client’s needs, his individual financial situation and does not present any investment strategy in any way. The marketing communication does not constitute an offer of sale, offering, subscription, invitation to purchase, advertisement or promotion of any financial instruments. XTB S.A. is not liable for any client’s actions or omissions, in particular for the acquisition or disposal of financial instruments, undertaken on the basis of the information contained in this marketing communication. In the event that the marketing communication contains any information about any results regarding the financial instruments indicated therein, these do not constitute any guarantee or forecast regarding the future results.