
Cryptocurrencies attempt a rebound on Monday after sharp declines, during which BTC fell about 20% from its all-time high, while Ethereum pulled back to around $3,000 from $4,900 seen in the summer. Today, both of the largest cryptocurrencies are gaining along with U.S. stock indices, where improving sentiment may signal higher inflows into ETF funds. Hopes for a U.S. government reopening have increased, as Republicans continue to negotiate details with Democrats. Importantly, reopening the government would also boost market liquidity, which—beyond improved sentiment about the economy—could serve as a more structural driver for the trend.
CryptoQuant noted that spot order size data suggests the return of institutional investors to the Ethereum market, which, if it holds the $3,000–$3,400 support zone, may be entering a low-volatility accumulation phase.
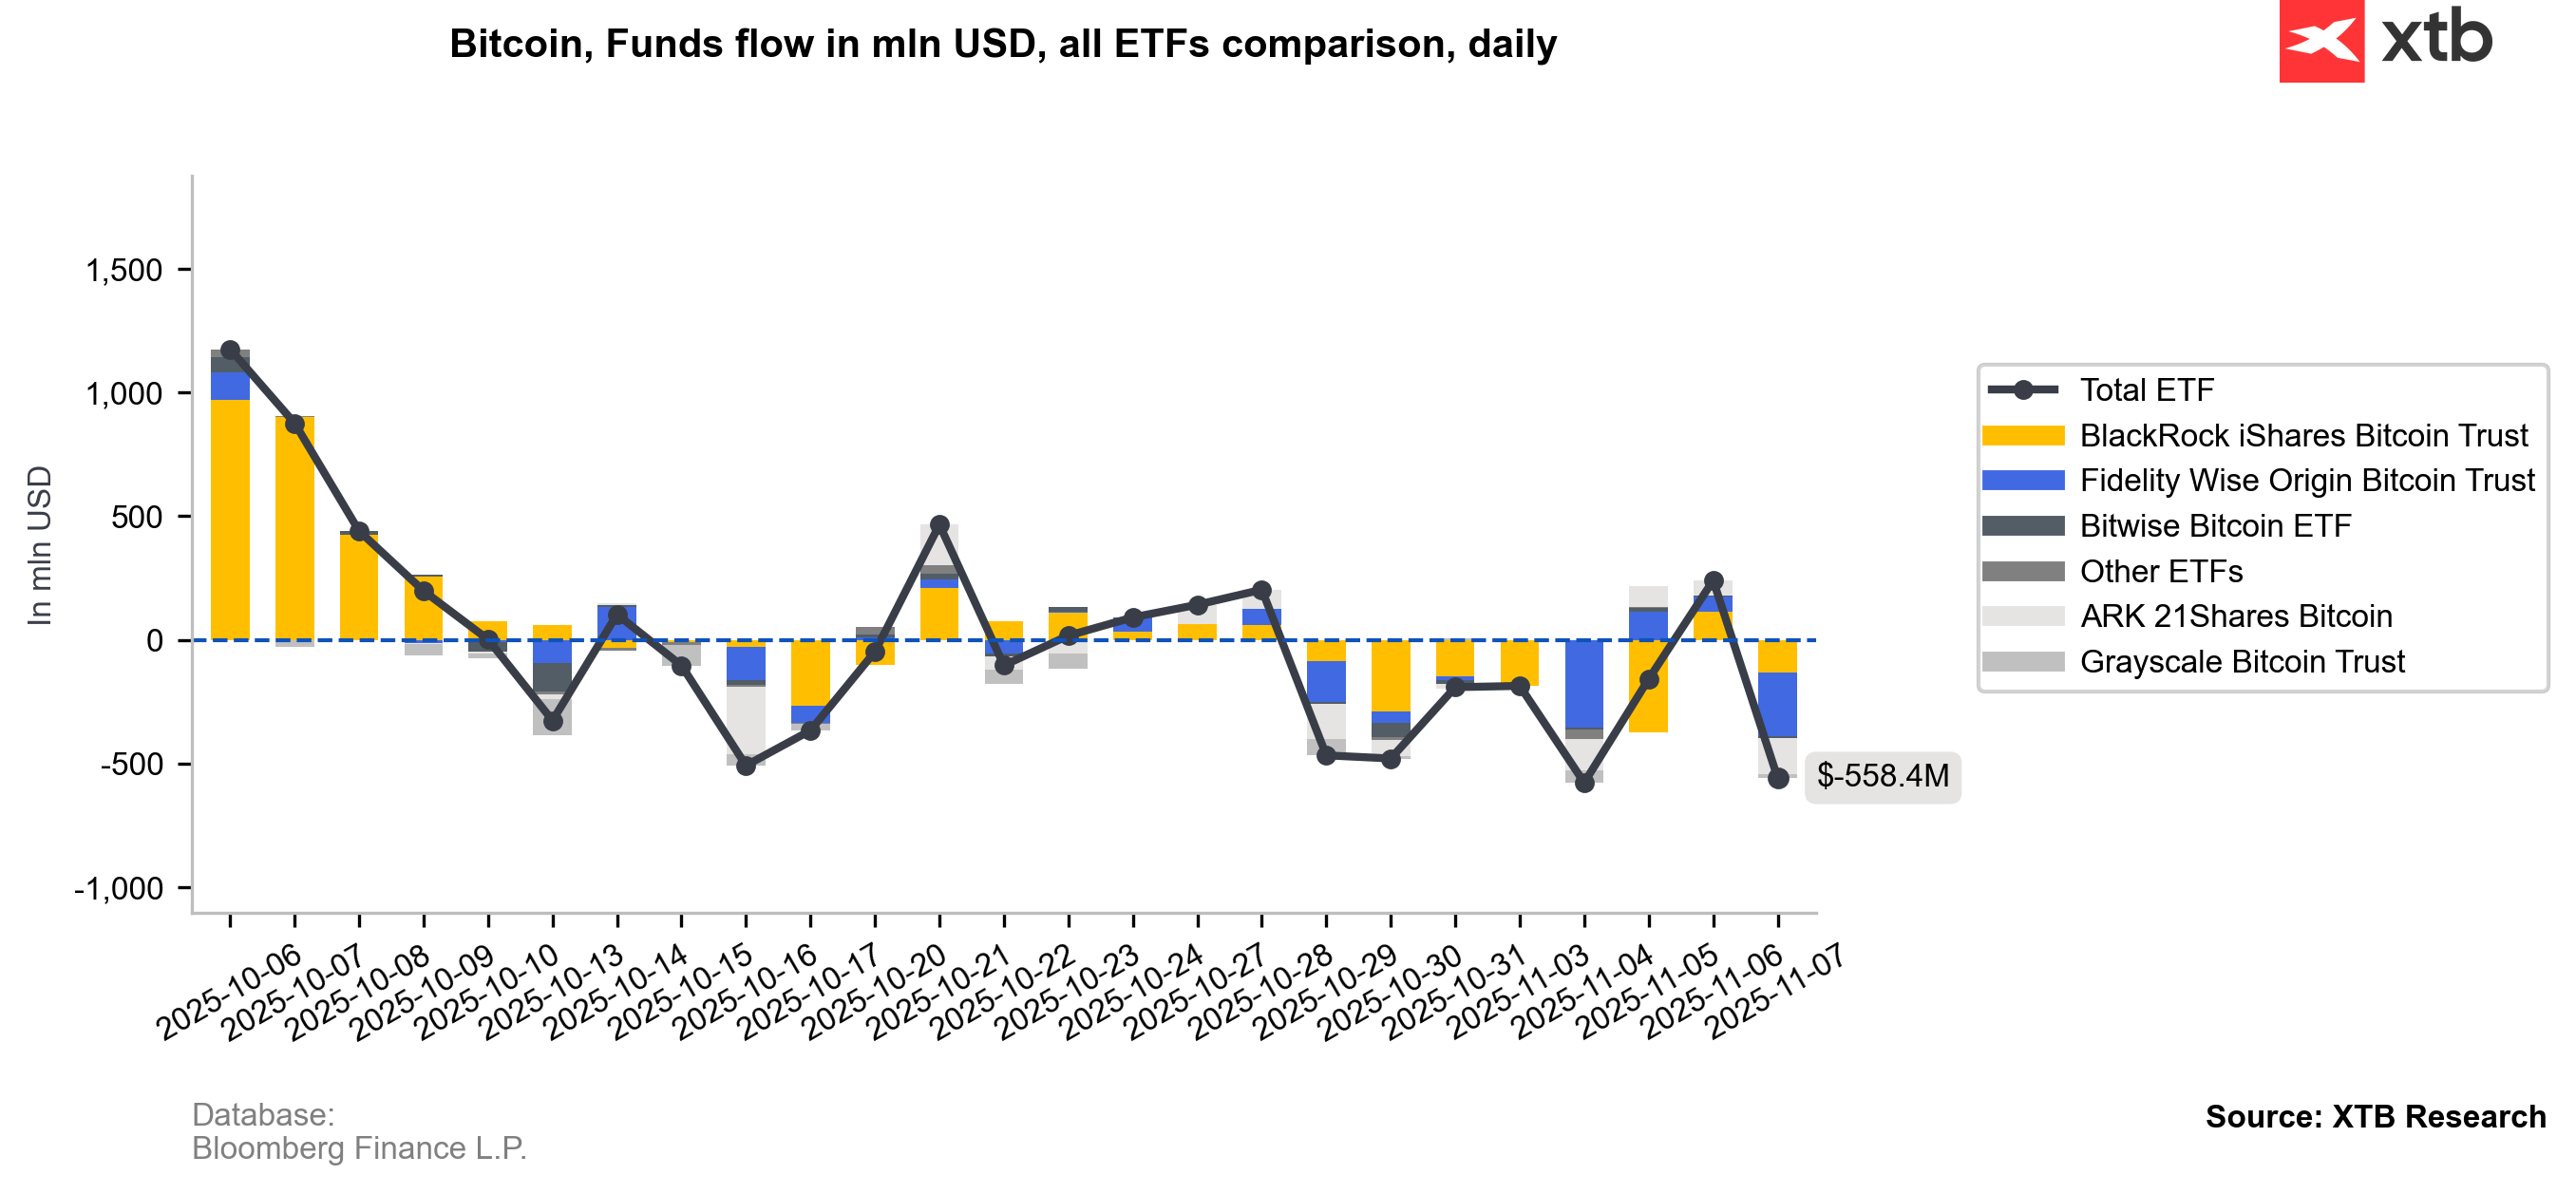
Meanwhile, older Bitcoin wallets have recently been transferring their crypto reserves to Binance at the largest scale since July, indicating strong selling pressure among that group of investors. Bitcoin ETF inflows have fallen by about $2.3 billion from their peak, marking the biggest outflow since May 2025.
Since October, long-term investors (LTHs) have resumed selling, but this time demand has weakened, preventing the market from absorbing their supply at higher prices. For instance, during January–March and November–December 2024, increased selling from LTHs was offset by rising demand. The market is now clearly in a correction phase, which is also evident in on-chain flows. Analysis of Glassnode’s on-chain Cost Basis Distribution indicator shows the key price levels where Bitcoin positions are being built or closed on a large scale. Two levels currently stand out:
-
$110,000 – a zone showing high supply concentration, where many market participants have been eager to sell BTC
-
$102,000 – where accumulation is starting to appear, though still relatively weak
It will be crucial to watch whether selling around $110,000 remains strong and if demand near $102,000–$105,000 continues to develop.
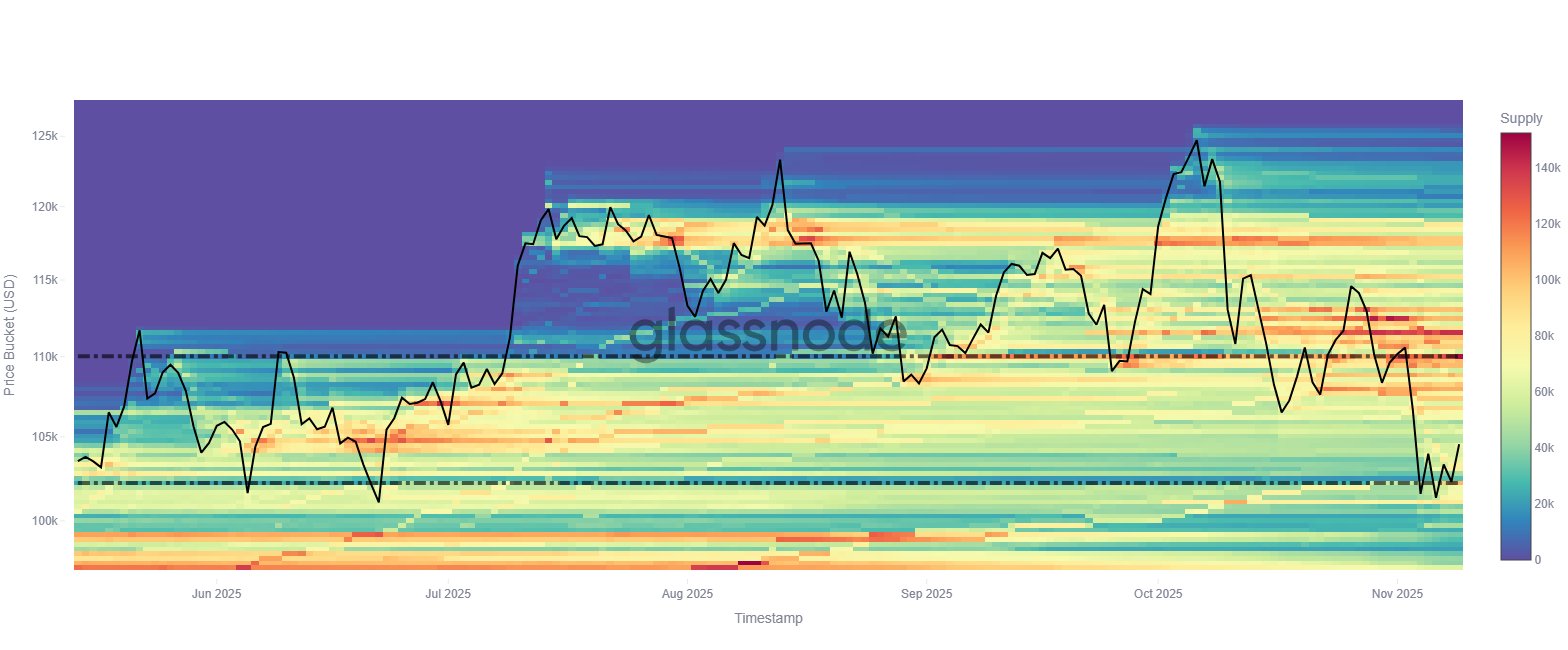
Source: Glassnode
CryptoQuant’s on-chain indicators still point to solid accumulation among broad investor groups, despite intense BTC selling from long-term addresses and falling prices.
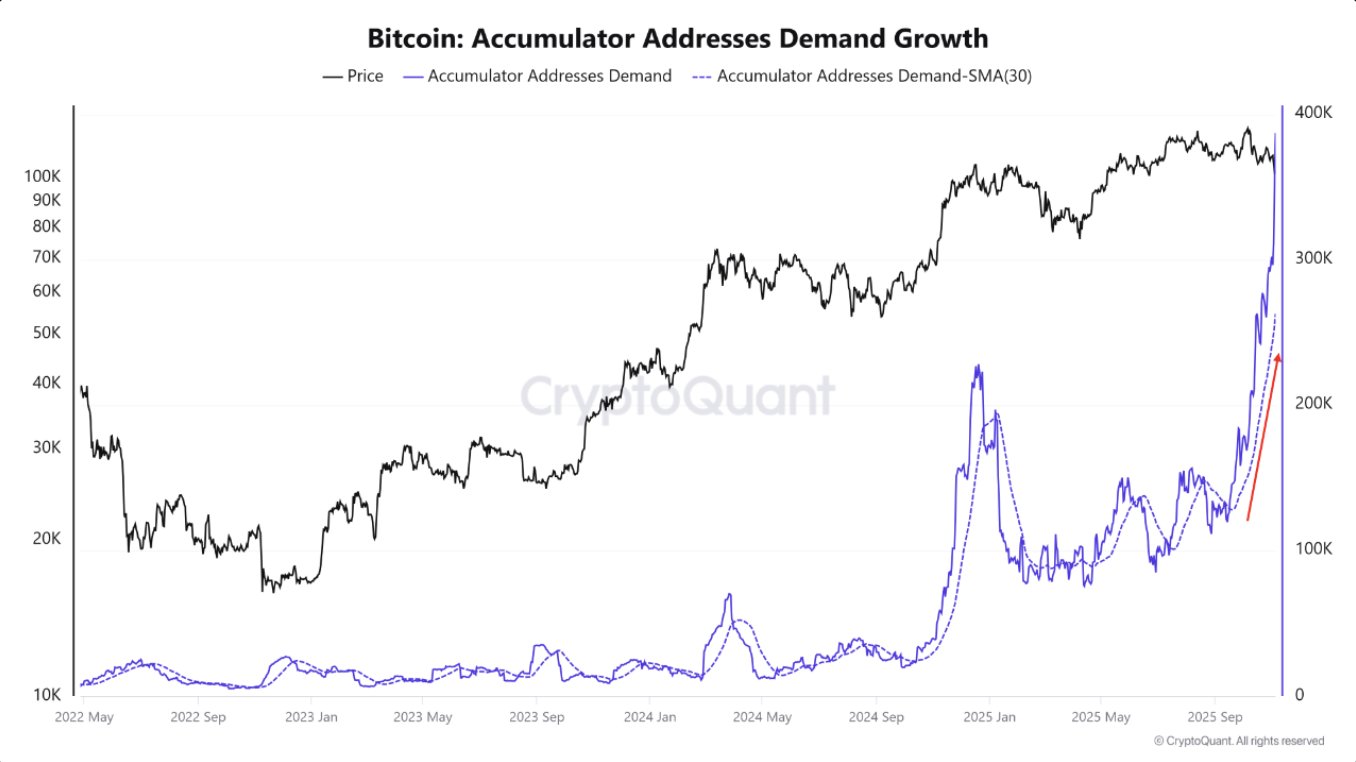
Source: CryptoQuant
Bitcoin and Ethereum Charts (D1)
Looking at the charts of the two largest cryptocurrencies, we can see that both are currently attempting to reclaim the 200-day EMA (red line), with Ethereum showing a stronger rebound. The token is trading roughly around the key moving average near $3,600. The RSI indicator for both cryptocurrencies is gradually rising toward 50, suggesting a significant easing of selling pressure.
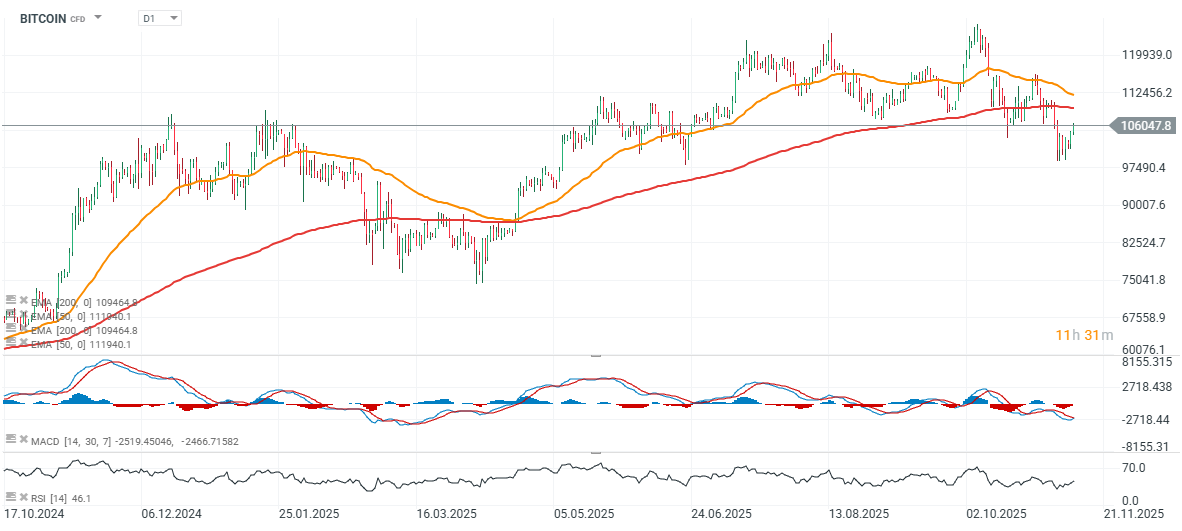
Source: xStation5
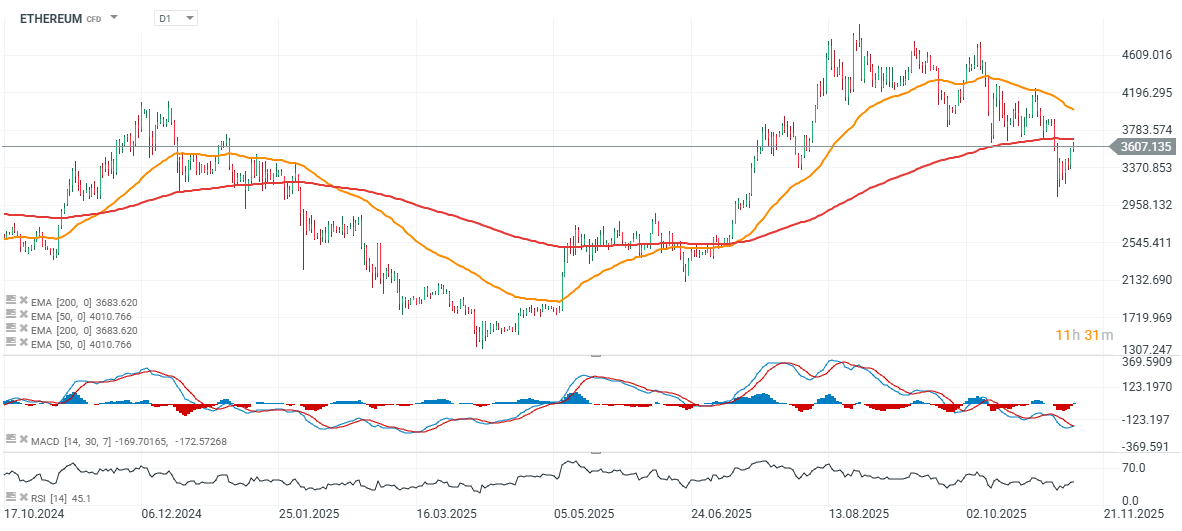
Source: xStation5
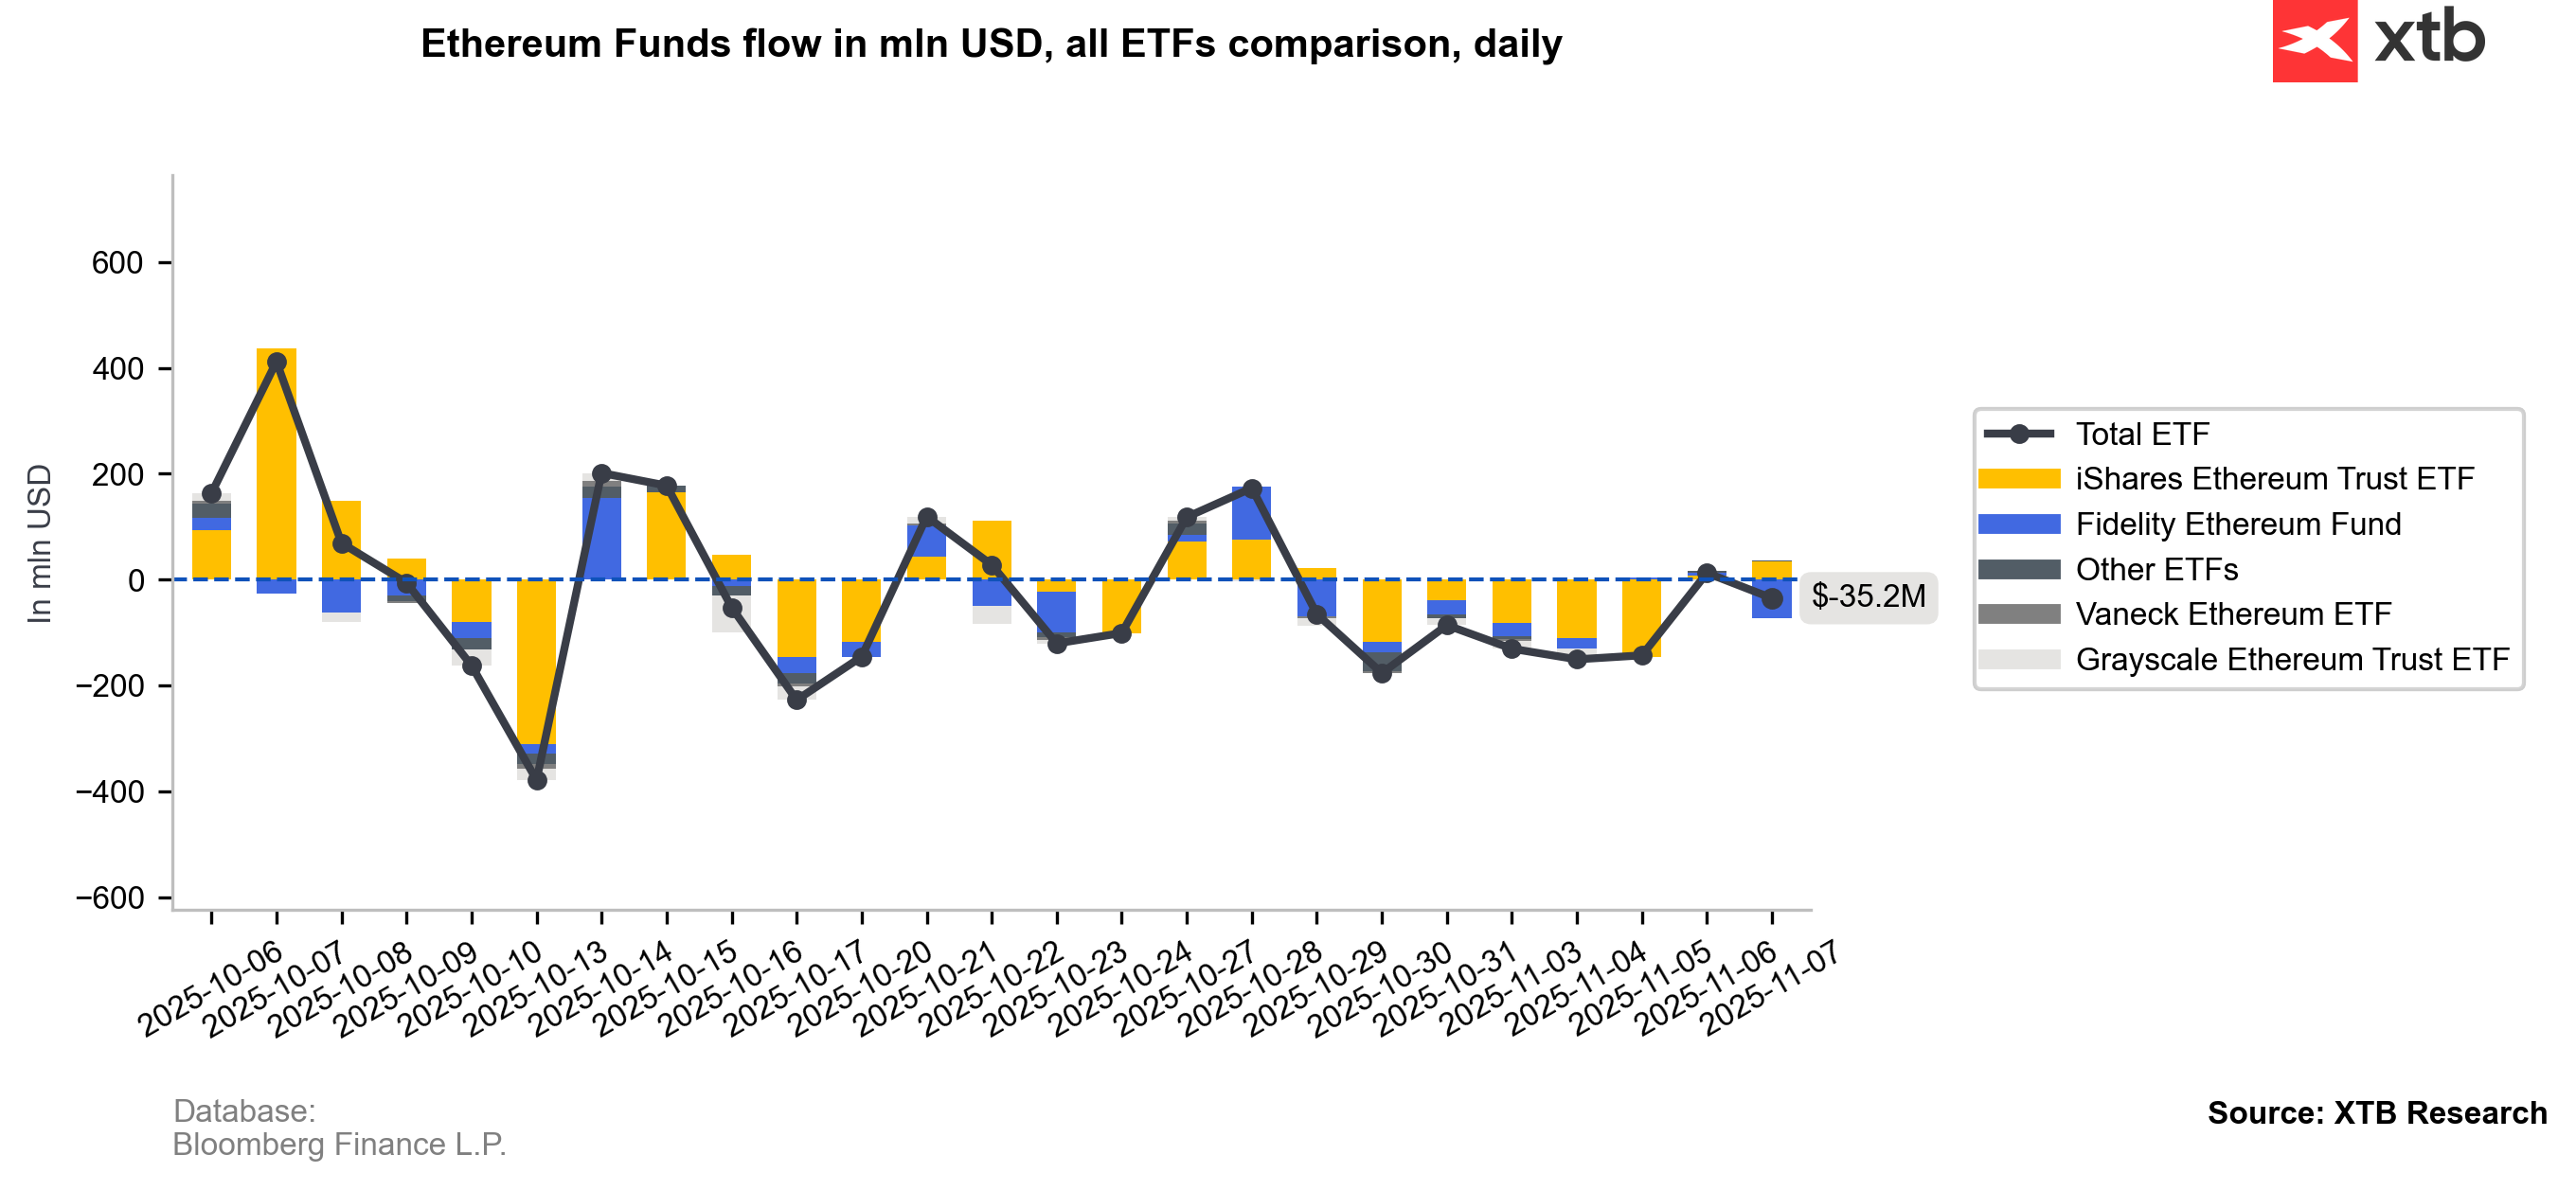
ETFs Are Selling (for Now)
Recent days have seen outflows from crypto ETFs, but the long-term trend appears intact—especially if the U.S. government reopens and stocks resume their upward trend. ETFs remain a key measure of buying momentum in the crypto market, closely monitored by hedge funds and dealers. Renewed demand from this group could serve as a key signal of a potential trend reversal.
Source: Bloomberg Finance L.P., XTB Research
 Source: Bloomberg Finance L.P., XTB Research

Daily Summary: Trump's War Threats Weigh on Markets. Wall Street Sinks into the Red
Tensions around Iran weigh on markets!

US Open: Alphabet and Tesla Weigh on Wall Street, While Oil Prices Renew Investor Concerns

Wheat climbs to the highest level since May 2024 🚜 Black Sea export risks fuel rally
The content of this report has been created by XTB S.A., with its registered office in Warsaw, at Prosta 67, 00-838 Warsaw, Poland, (KRS number 0000217580) and supervised by Polish Supervision Authority ( No. DDM-M-4021-57-1/2005). This material is a marketing communication within the meaning of Art. 24 (3) of Directive 2014/65/EU of the European Parliament and of the Council of 15 May 2014 on markets in financial instruments and amending Directive 2002/92/EC and Directive 2011/61/EU (MiFID II). Marketing communication is not an investment recommendation or information recommending or suggesting an investment strategy within the meaning of Regulation (EU) No 596/2014 of the European Parliament and of the Council of 16 April 2014 on market abuse (market abuse regulation) and repealing Directive 2003/6/EC of the European Parliament and of the Council and Commission Directives 2003/124/EC, 2003/125/EC and 2004/72/EC and Commission Delegated Regulation (EU) 2016/958 of 9 March 2016 supplementing Regulation (EU) No 596/2014 of the European Parliament and of the Council with regard to regulatory technical standards for the technical arrangements for objective presentation of investment recommendations or other information recommending or suggesting an investment strategy and for disclosure of particular interests or indications of conflicts of interest or any other advice, including in the area of investment advisory, within the meaning of the Trading in Financial Instruments Act of 29 July 2005 (i.e. Journal of Laws 2019, item 875, as amended). The marketing communication is prepared with the highest diligence, objectivity, presents the facts known to the author on the date of preparation and is devoid of any evaluation elements. The marketing communication is prepared without considering the client’s needs, his individual financial situation and does not present any investment strategy in any way. The marketing communication does not constitute an offer of sale, offering, subscription, invitation to purchase, advertisement or promotion of any financial instruments. XTB S.A. is not liable for any client’s actions or omissions, in particular for the acquisition or disposal of financial instruments, undertaken on the basis of the information contained in this marketing communication. In the event that the marketing communication contains any information about any results regarding the financial instruments indicated therein, these do not constitute any guarantee or forecast regarding the future results.