
Cryptocurrencies traded higher today, fuel for the industry's gains added by the major indices rising during yesterday's Fed conference. Will digital assets maintain the bullish momentum?
- Total market capitalisation is back above US$1 trillion. Bitcoin soared above USD 23,000, Ethereum above USD 1,600. The major cryptocurrencies have traditionally been followed by altcoins like Uniswap and Bitcoincash, with gains of up to a dozen per cent. The unwinding has led to the liquidation of nearly USD 202 million worth of short positions;
- Cryptocurrencies remain extremely volatile instruments. A negative US GDP reading (-0.9% vs 0.5% expectations) weakened US indices. Yesterday, the cryptocurrency market also received news of the sale of more than 1.4 million shares of cryptocurrency exchange Coinbase by the ArkInvest fund. The fund is managed by Cathie Wood, who has an interest in blockchain technology;
- Cryptocurrency exchange FTX has challenged Coinbase to make shares available for trading in all US states. The FTX exchange has acquired securities trade settlement provider Embed Financial Technologies. The FTX token registered 10 per cent gains.
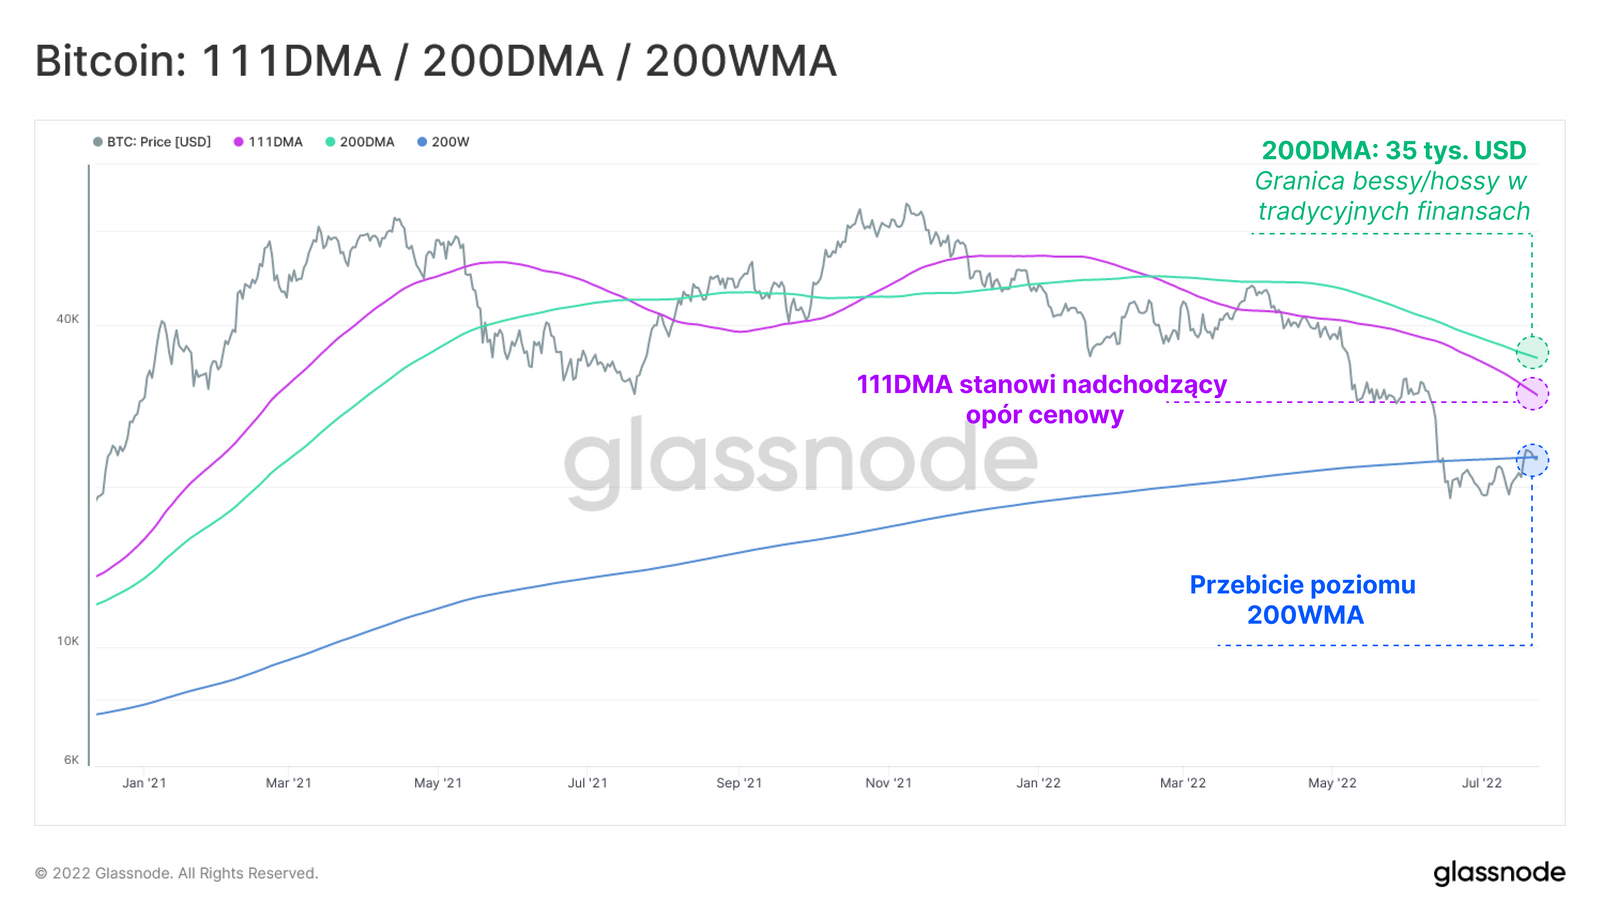
Bitcoin entering above $22,600 has once again pierced the 200-session moving average (200WMA) on the weekly interval and is defending the upside scenario. The average has historically indicated a ramming price bottom. At the same time, we see 2 other key averages 111DMA and 200DMA. The first average represents short-term, psychological resistance which stems from the Pi Cycle Top which runs around $35,000 and will act as long-term resistance for the bulls. Source: Glassnode

Market Wrap: Geopolitical déjà vu. Hormuz once again in the center of investors' attention.

Daily Wrap: Technology Leads Wall Street Higher. Markets Shrug Off US–Iran Tensions

Morning Wrap It's getting hot in the Persian Gulf again, oil is back in the spotlight.

📈 Bitcoin climbs above $62K
The content of this report has been created by XTB S.A., with its registered office in Warsaw, at Prosta 67, 00-838 Warsaw, Poland, (KRS number 0000217580) and supervised by Polish Supervision Authority ( No. DDM-M-4021-57-1/2005). This material is a marketing communication within the meaning of Art. 24 (3) of Directive 2014/65/EU of the European Parliament and of the Council of 15 May 2014 on markets in financial instruments and amending Directive 2002/92/EC and Directive 2011/61/EU (MiFID II). Marketing communication is not an investment recommendation or information recommending or suggesting an investment strategy within the meaning of Regulation (EU) No 596/2014 of the European Parliament and of the Council of 16 April 2014 on market abuse (market abuse regulation) and repealing Directive 2003/6/EC of the European Parliament and of the Council and Commission Directives 2003/124/EC, 2003/125/EC and 2004/72/EC and Commission Delegated Regulation (EU) 2016/958 of 9 March 2016 supplementing Regulation (EU) No 596/2014 of the European Parliament and of the Council with regard to regulatory technical standards for the technical arrangements for objective presentation of investment recommendations or other information recommending or suggesting an investment strategy and for disclosure of particular interests or indications of conflicts of interest or any other advice, including in the area of investment advisory, within the meaning of the Trading in Financial Instruments Act of 29 July 2005 (i.e. Journal of Laws 2019, item 875, as amended). The marketing communication is prepared with the highest diligence, objectivity, presents the facts known to the author on the date of preparation and is devoid of any evaluation elements. The marketing communication is prepared without considering the client’s needs, his individual financial situation and does not present any investment strategy in any way. The marketing communication does not constitute an offer of sale, offering, subscription, invitation to purchase, advertisement or promotion of any financial instruments. XTB S.A. is not liable for any client’s actions or omissions, in particular for the acquisition or disposal of financial instruments, undertaken on the basis of the information contained in this marketing communication. In the event that the marketing communication contains any information about any results regarding the financial instruments indicated therein, these do not constitute any guarantee or forecast regarding the future results.