
- European bourses finished in red
- US stocks slumped pressured by financials and tech shares
- US bond yields hit two-year high
Majority of European indices finished today's session 1% lower as government bond yields extended recent upward move, with the German 10-year Bund yield approaching its highest level since early 2019. Amid individual sectors, travel and tech stocks fell over 2.0%, while energy segment increased 0.6%, as oil futures rallied to a more than seven-year high on concerns over rising tensions in the Arabian peninsula. On the data front, Germany’s ZEW economic sentiment survey surged to 51.7 in January, well above analysts’ estimates of 32.0.
Major Wall Street indices fell sharply on Tuesday amid soaring Treasury yields which put pressure on the tech sector. The closely watched 2-year yield jumped above 1% for the first time since February 2020, while the benchmark 10-year note rose to 1.85%, its highest since January 2020. The Dow Jones dropped 1.54% and reached its lowest level since December 20th, the S&P lost 1.8% and is testing December lows while the Nasdaq tanked 2.3% to the lowest since October 12th. Also weak earnings from Goldman Sachs weighed on market sentiment. On the other hand, Bank of New York Mellon quarterly results beat market consensus. Meanwhile Microsoft stock lost over 1.0% after the tech giant announced it will buy Activision Blizzard for $68.7 billion.
Mixed moods prevail today in most commodity markets. Gold managed to partially erase early losses but is still trading 0.30% lower, while silver at one point rose 2.70% despite stronger dollar and higher treasury yields. WTI oil added over 1% and tested $85.20 level, while Brent price jumped to 7-year high around $88.00. Some downward pressure can be spotted on the cryptocurrency market. Bitcoin price fell to $41 500 level, while Ethereum broke below $3100 handle.
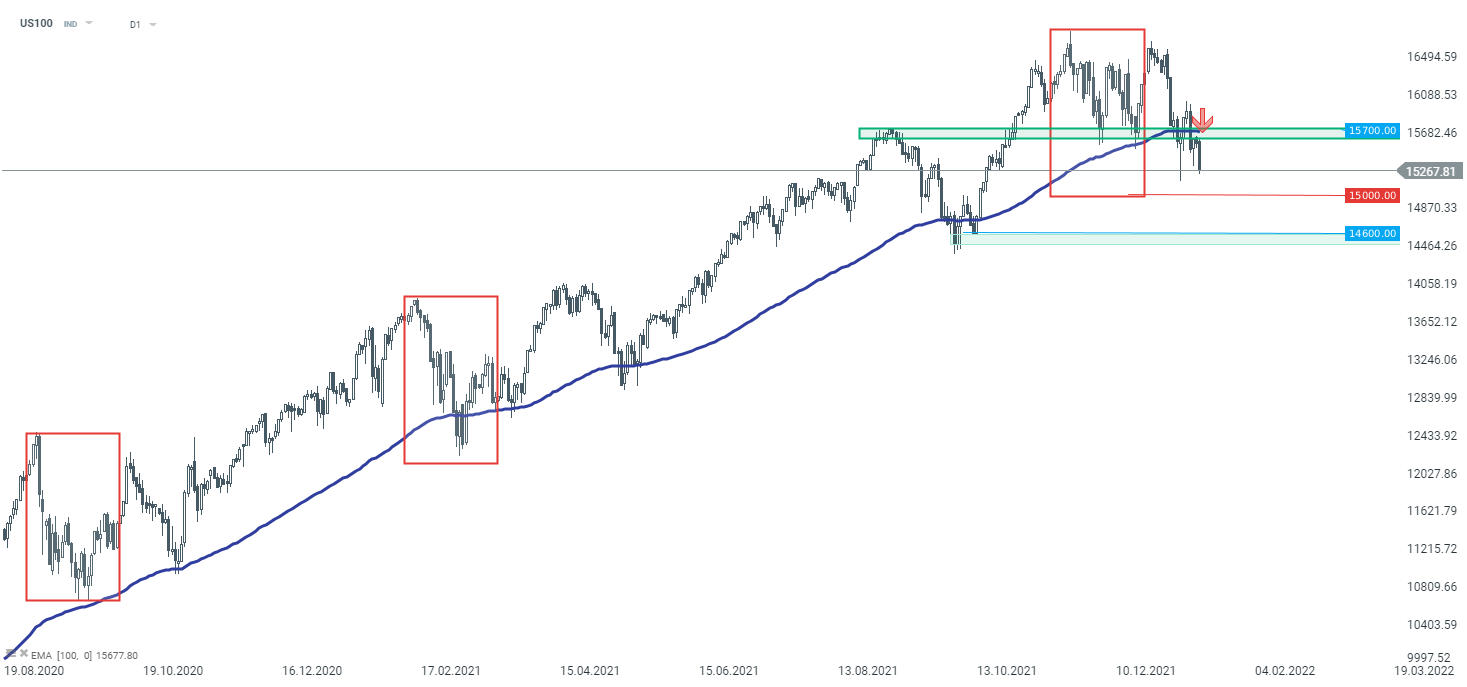 US stock indices are under pressure and the US100 lost more than 2%. Looking at the chart from the technical analysis perspective, the key support zone has been breached at 15700 pts, which causes a risk that downward correction may deepen. The nearest key support is located around the psychological 15 000 pts level and is marked with a lower limit of the 1: 1 structure (red rectangle). Source: xStation5

SK Hynix earnings: Did market over-sold?

Morning Wrap: Asia dips on SK Hynix earnings and Iranian attacks! Dollar stalls before Fed (29.07.2026)

Daily Summary: Markets limit the pullback while awaiting the Fed

France Challenges Palantir, Market Reacts.
The content of this report has been created by XTB S.A., with its registered office in Warsaw, at Prosta 67, 00-838 Warsaw, Poland, (KRS number 0000217580) and supervised by Polish Supervision Authority ( No. DDM-M-4021-57-1/2005). This material is a marketing communication within the meaning of Art. 24 (3) of Directive 2014/65/EU of the European Parliament and of the Council of 15 May 2014 on markets in financial instruments and amending Directive 2002/92/EC and Directive 2011/61/EU (MiFID II). Marketing communication is not an investment recommendation or information recommending or suggesting an investment strategy within the meaning of Regulation (EU) No 596/2014 of the European Parliament and of the Council of 16 April 2014 on market abuse (market abuse regulation) and repealing Directive 2003/6/EC of the European Parliament and of the Council and Commission Directives 2003/124/EC, 2003/125/EC and 2004/72/EC and Commission Delegated Regulation (EU) 2016/958 of 9 March 2016 supplementing Regulation (EU) No 596/2014 of the European Parliament and of the Council with regard to regulatory technical standards for the technical arrangements for objective presentation of investment recommendations or other information recommending or suggesting an investment strategy and for disclosure of particular interests or indications of conflicts of interest or any other advice, including in the area of investment advisory, within the meaning of the Trading in Financial Instruments Act of 29 July 2005 (i.e. Journal of Laws 2019, item 875, as amended). The marketing communication is prepared with the highest diligence, objectivity, presents the facts known to the author on the date of preparation and is devoid of any evaluation elements. The marketing communication is prepared without considering the client’s needs, his individual financial situation and does not present any investment strategy in any way. The marketing communication does not constitute an offer of sale, offering, subscription, invitation to purchase, advertisement or promotion of any financial instruments. XTB S.A. is not liable for any client’s actions or omissions, in particular for the acquisition or disposal of financial instruments, undertaken on the basis of the information contained in this marketing communication. In the event that the marketing communication contains any information about any results regarding the financial instruments indicated therein, these do not constitute any guarantee or forecast regarding the future results.