
Heico (HEI.US) shares have been among the biggest winners of the past several months, performing strongly and leading gains in the U.S. industrial sector alongside names such as Curtiss Wright and RTX Corp. On the other hand, the stock has slipped nearly 10% from its all-time high, while the euphoric reaction to recent earnings was quickly met with selling pressure. It is clear that U.S. companies with secure, short supply chains, providing components and services not only to private businesses but also to the Pentagon and the space sector, should perform at least solidly in the coming quarters. So why did Heico shares fall?
Heico is dominating the aerospace niche markets
- Heico is one of the leaders in this field. The company provides aircraft servicing, critical spare parts, and top-quality OEM replacements, allowing businesses and institutions to save on critical components ranging from electronics to structural elements. In recent months, speculation has persisted around potential increases in Pentagon orders, given that the Department of Defense often “overpays” OEM suppliers, making Heico a natural alternative.
- In Q3 2025, the company reported $1.15 billion in sales and $177.34 million in net profit, reflecting year-over-year growth of nearly 20% and 30%, respectively. For decades, Heico has pursued an aggressive acquisition strategy, absorbing niche, strategic businesses to build long-term market strength. This has made the company an almost irreplaceable link in the aerospace sector, with growing orders for both military and space missions. In 2025 alone, it acquired five additional companies.
- Heico estimates its annual revenues will reach $5.4 billion by 2028, implying an average annual sales growth rate of about 8%. More importantly, it expects to generate nearly $1 billion in net profit by then, representing roughly 15% average growth compared to about $700 million in net profit this year. This outlook suggests acquisitions will not significantly dilute margins, while associated costs help build a “snowball effect” of scaling growth.
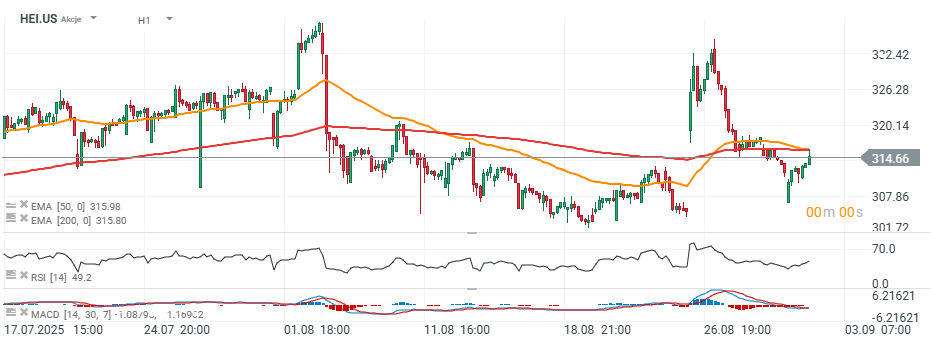
Heico shares (H1, D1 interval)
Yesterday, the stock closed at $315 per share. Just above this level lie the hourly EMA50 and EMA200. A breakout above $316 today could potentially open the way for a retest of historical highs. The market broadly agrees that Heico’s business is thriving. The only concern is valuation, which even after the recent pullback remains at historically elevated price-to-earnings and price-to-sales multiples.
Average annual revenue growth of 8% and net profit growth of about 15% do not fully justify multiples of around 60 times earnings—although Heico’s predictable business and dominance in niche industries make its long-term scaling prospects nearly certain. This dynamic has led to periodic episodes of overvaluation. On the other hand, the company expectations may be too defensive, leaving the market with the upside potential if investors will see improving margins and positive effects from acquisitions in the near-term.
Source: xStation5
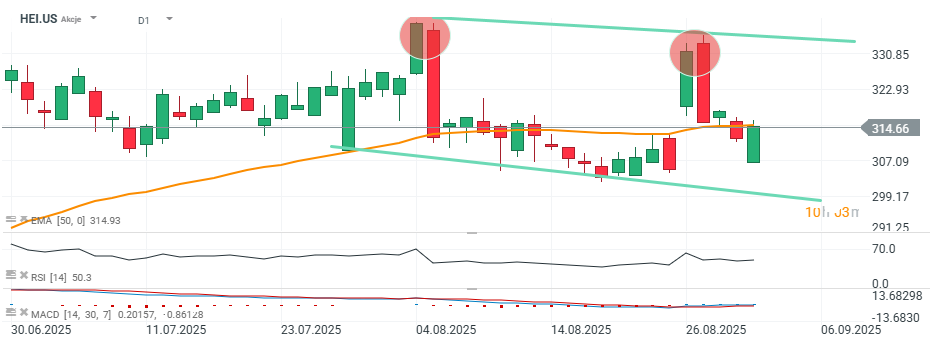
The company’s shares are currently testing the 50-day exponential moving average (EMA50, orange line) on the daily timeframe. A decline below this level could potentially open the way for a test of the EMA200 near 282 USD per share. Conversely, a breakout above would suggest a renewed test of the upper boundary of the price channel around 328 USD.

Daily Summary: Equities Diverge as Tech Lags, Europe Rallies on Earnings & PMIs (24.07.2026)

US OPEN: Nasdaq hits 1-month low! Geopolitics bring AI trade down!

Market Wrap: European Stocks Are Trying to Rebound as the Week Comes to an End💡

Alphabet shares are down 22% from their all-time high 🚩 Is Google ready to resume its bull run?
The content of this report has been created by XTB S.A., with its registered office in Warsaw, at Prosta 67, 00-838 Warsaw, Poland, (KRS number 0000217580) and supervised by Polish Supervision Authority ( No. DDM-M-4021-57-1/2005). This material is a marketing communication within the meaning of Art. 24 (3) of Directive 2014/65/EU of the European Parliament and of the Council of 15 May 2014 on markets in financial instruments and amending Directive 2002/92/EC and Directive 2011/61/EU (MiFID II). Marketing communication is not an investment recommendation or information recommending or suggesting an investment strategy within the meaning of Regulation (EU) No 596/2014 of the European Parliament and of the Council of 16 April 2014 on market abuse (market abuse regulation) and repealing Directive 2003/6/EC of the European Parliament and of the Council and Commission Directives 2003/124/EC, 2003/125/EC and 2004/72/EC and Commission Delegated Regulation (EU) 2016/958 of 9 March 2016 supplementing Regulation (EU) No 596/2014 of the European Parliament and of the Council with regard to regulatory technical standards for the technical arrangements for objective presentation of investment recommendations or other information recommending or suggesting an investment strategy and for disclosure of particular interests or indications of conflicts of interest or any other advice, including in the area of investment advisory, within the meaning of the Trading in Financial Instruments Act of 29 July 2005 (i.e. Journal of Laws 2019, item 875, as amended). The marketing communication is prepared with the highest diligence, objectivity, presents the facts known to the author on the date of preparation and is devoid of any evaluation elements. The marketing communication is prepared without considering the client’s needs, his individual financial situation and does not present any investment strategy in any way. The marketing communication does not constitute an offer of sale, offering, subscription, invitation to purchase, advertisement or promotion of any financial instruments. XTB S.A. is not liable for any client’s actions or omissions, in particular for the acquisition or disposal of financial instruments, undertaken on the basis of the information contained in this marketing communication. In the event that the marketing communication contains any information about any results regarding the financial instruments indicated therein, these do not constitute any guarantee or forecast regarding the future results.