
-
Strong Growth, Negative Reaction: Microsoft beat revenue and earnings consensus, yet shares fell 3% after-hours amid investor anxiety over AI investment ROI.
-
Azure Maintains Momentum: The key Azure segment grew 39% (above forecast), confirming the robust strength of the company's cloud business.
-
CapEx Concerns Emerge: Lower-than-expected Capital Expenditure (CapEx) and warnings on future margin pressure fueled market doubts regarding the pace of monetization of costly AI projects.
-
Strong Growth, Negative Reaction: Microsoft beat revenue and earnings consensus, yet shares fell 3% after-hours amid investor anxiety over AI investment ROI.
-
Azure Maintains Momentum: The key Azure segment grew 39% (above forecast), confirming the robust strength of the company's cloud business.
-
CapEx Concerns Emerge: Lower-than-expected Capital Expenditure (CapEx) and warnings on future margin pressure fueled market doubts regarding the pace of monetization of costly AI projects.
Microsoft delivered solid financial results for the first quarter of fiscal year 2026 (ended September 30, 2025), surpassing analyst expectations across key metrics, particularly showing robust growth in its cloud business segments. Despite the strong performance, the company's shares fell by as much as 3% in after-hours trading, reflecting persistent investor anxiety over the Return on Investment (ROI) from massive AI infrastructure spending.
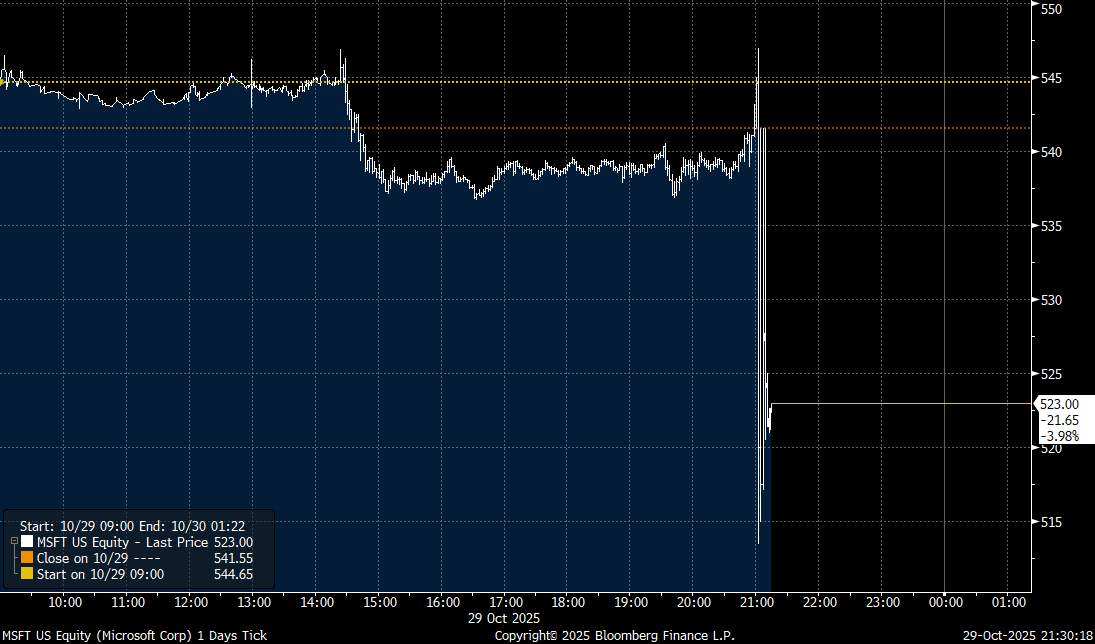
Microsoft shares decline in after-hours trading. Source: Bloomberg
Key Quarterly Financial Highlights
Revenue and Profitability:
-
Revenue: $77.7 Billion (+18% YoY, +17% in constant currency) vs. $75.55 Billion consensus.
-
Operating Income: $38.0 Billion (+24% YoY) vs. $35.1 Billion consensus.
-
EPS (GAAP): $3.72 (+13% YoY).
-
EPS (non-GAAP): $4.13 (+23% YoY), excluding the impact of the OpenAI investment.
-
Net Income (GAAP): $27.7 Billion (+12% YoY).
Capital Expenditure (CapEx):
-
CapEx: $19.39 Billion — significantly below the $23.04 Billion consensus. This divergence may be seen as a disappointment by those seeking aggressive spending, but could also suggest that further expenditure may not substantially accelerate the revenue outlook.
Business Segment Results
Intelligent Cloud (Core Growth Driver):
-
Revenue: $30.9 Billion (+28% YoY) vs. $30.18 Billion consensus.
-
Azure and other cloud services: +39% YoY (ex-FX) vs. +37.1% consensus.
Productivity and Business Processes:
-
Revenue: $33.02 Billion (+17% YoY) vs. $32.29 Billion consensus.
-
Microsoft 365 Commercial cloud: +17% YoY (+15% in constant currency).
-
Microsoft 365 Consumer cloud: +26% YoY.
-
LinkedIn: +10% YoY.
-
Dynamics 365: +18% YoY.
More Personal Computing:
-
Revenue: $13.76 Billion (+4% YoY) vs. $12.88 Billion consensus.
-
Windows OEM: +6% YoY.
-
Search and Advertising (ex-TAC): +16% YoY.
Why Are Shares Declining?
Despite beating expectations on revenue and earnings, the market reacted negatively due to several factors:
-
ROI Concerns over AI Investment: Microsoft is spending tens of billions of dollars on AI infrastructure (approx. $80 Billion in FY2025), yet investors are demanding more convincing evidence of proportional returns from this outlay.
-
Guidance and Future CapEx: The market was looking for clear signals of accelerating AI monetization. The lower-than-expected CapEx ($19.39 Billion vs. $23 Billion consensus) may suggest Microsoft is adjusting the pace of investment, raising questions about demand momentum.
-
AI Infrastructure Competition: Reports of Oracle reportedly taking on some infrastructure orders from OpenAI (a key Microsoft partner) may signal a loss of momentum in the hyperscale segment.
-
Margin Pressure: CFO Amy Hood had previously warned that margins could be pressured amid the expansion of data centers. While the operating margin was 45% this quarter, continued heavy investment could erode it further.
-
Valuation Premium: Microsoft shares trade at a forward P/E of around 35, commanding a premium over the broader market. Investors expect this high valuation to be justified by spectacular AI revenue growth, which has yet to fully materialize.
Positive Indicators
-
Microsoft Cloud Revenue: $49.1 Billion (+26% YoY).
-
Remaining Performance Obligations: Increased by 51% to $392 Billion — a strong signal of future demand.
-
Free Cash Flow: The company generated $45.1 Billion from operating activities during the quarter.
-
Capital Return to Shareholders: $10.7 Billion returned via dividends and share repurchases.
Summary
Microsoft delivered solid results, surpassing consensus on revenue, operating profit, and EPS. Azure's 39% growth (above the 37% forecast) confirms the strength of the cloud platform. However, the market appears to be penalising the company for the lack of clear indication on how its past investments will translate into greater future profits. Furthermore, emerging competition in the cloud infrastructure segment raises question marks for one of the market leaders. Nevertheless, it must be acknowledged that the company's prospects for continued growth and development remain extremely strong.
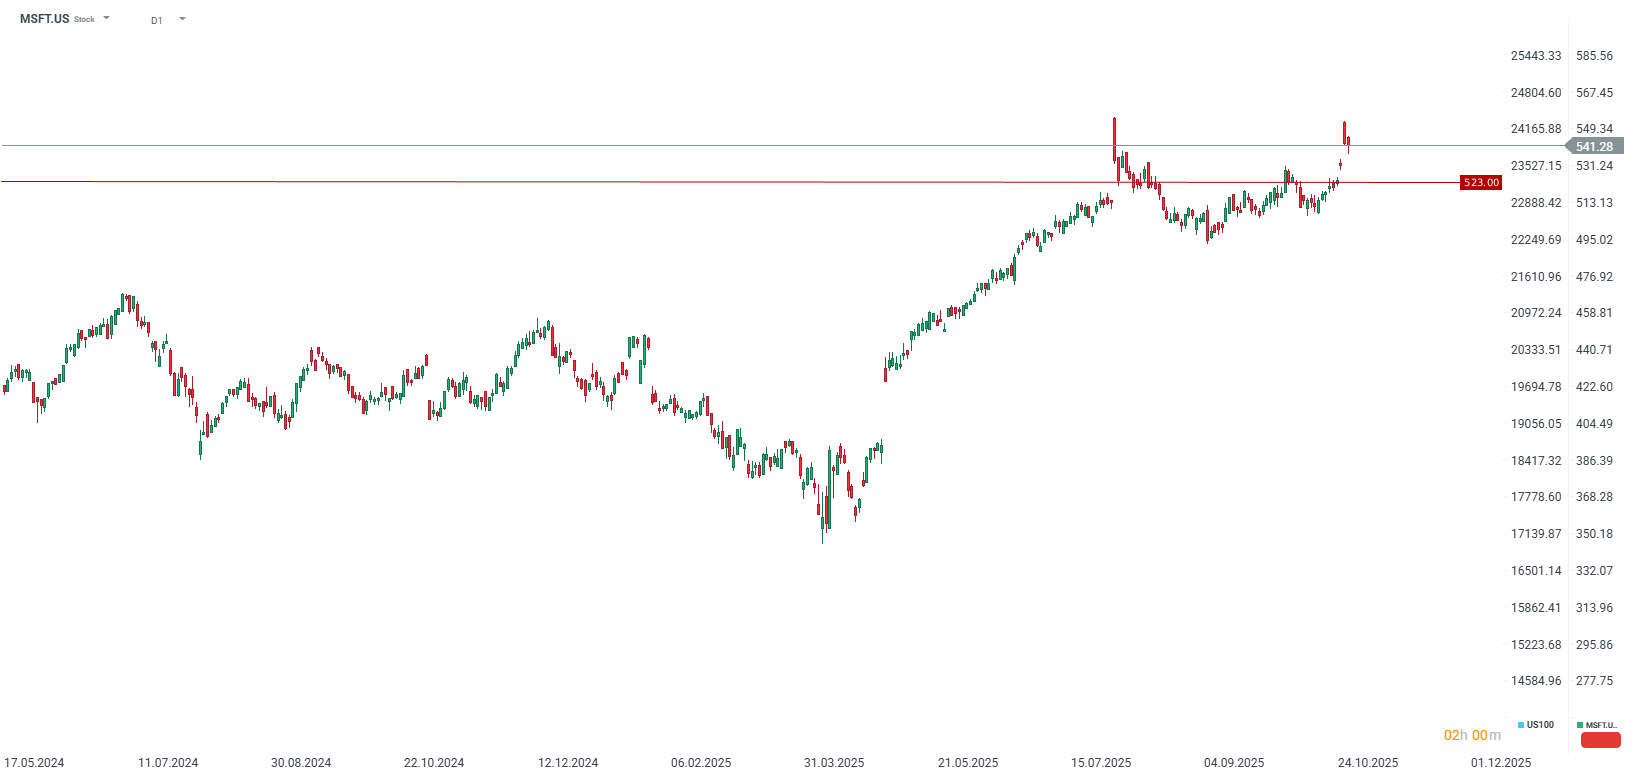
The company's shares lost 3-4% in after-hours trading. Source: xStation5

Daily Summary - The market starts to doubt rate hikes after Warsh, but Trump destroys the rebound

US OPEN: Wall Street Holds Its Breath Ahead of Fed Decision and Tech Giant Earnings

SK Hynix earnings: Did market over-sold?

France Challenges Palantir, Market Reacts.
The content of this report has been created by XTB S.A., with its registered office in Warsaw, at Prosta 67, 00-838 Warsaw, Poland, (KRS number 0000217580) and supervised by Polish Supervision Authority ( No. DDM-M-4021-57-1/2005). This material is a marketing communication within the meaning of Art. 24 (3) of Directive 2014/65/EU of the European Parliament and of the Council of 15 May 2014 on markets in financial instruments and amending Directive 2002/92/EC and Directive 2011/61/EU (MiFID II). Marketing communication is not an investment recommendation or information recommending or suggesting an investment strategy within the meaning of Regulation (EU) No 596/2014 of the European Parliament and of the Council of 16 April 2014 on market abuse (market abuse regulation) and repealing Directive 2003/6/EC of the European Parliament and of the Council and Commission Directives 2003/124/EC, 2003/125/EC and 2004/72/EC and Commission Delegated Regulation (EU) 2016/958 of 9 March 2016 supplementing Regulation (EU) No 596/2014 of the European Parliament and of the Council with regard to regulatory technical standards for the technical arrangements for objective presentation of investment recommendations or other information recommending or suggesting an investment strategy and for disclosure of particular interests or indications of conflicts of interest or any other advice, including in the area of investment advisory, within the meaning of the Trading in Financial Instruments Act of 29 July 2005 (i.e. Journal of Laws 2019, item 875, as amended). The marketing communication is prepared with the highest diligence, objectivity, presents the facts known to the author on the date of preparation and is devoid of any evaluation elements. The marketing communication is prepared without considering the client’s needs, his individual financial situation and does not present any investment strategy in any way. The marketing communication does not constitute an offer of sale, offering, subscription, invitation to purchase, advertisement or promotion of any financial instruments. XTB S.A. is not liable for any client’s actions or omissions, in particular for the acquisition or disposal of financial instruments, undertaken on the basis of the information contained in this marketing communication. In the event that the marketing communication contains any information about any results regarding the financial instruments indicated therein, these do not constitute any guarantee or forecast regarding the future results.