
Morgan Stanley (MS.US) revenues in Q3 was slighlty higher on yearly basis and earnings per share were not enough high to cause the optimistic reaction on the financial report. Provision for credit losses surged more than 350% y/y. Now bank shares loses 2% before the market open after revenues from wealth management and especially investment banking disappointed investors.
- Revenues: 13,3 mld USD vs 13,25 mld USD expected
- Earnings per share (EPS): 1,38 USD vs 1,32 USD expected
What's more revenue from the fixed-income trading (FICC) slumped 11% with lower fees from dealmaking. Finally net income dropped. Net new assets slumped to $35.7 billion from $89.5 billion the prior quarter.
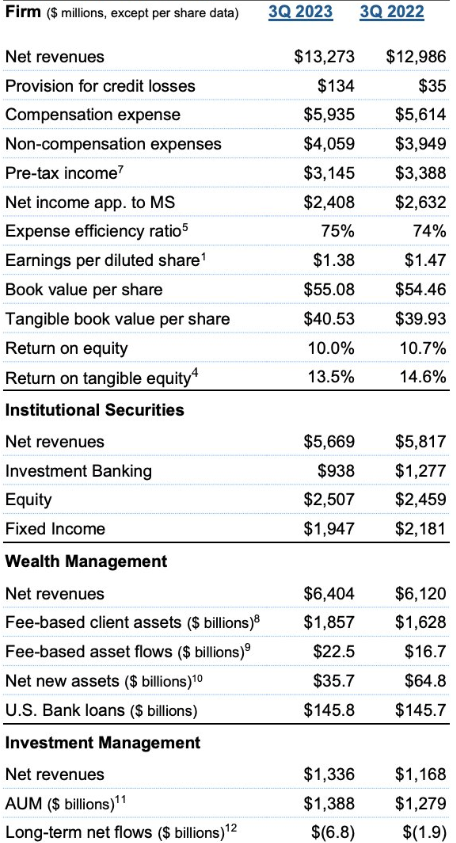
Morgan Stanley revenues on y/y basis. Investment Management revenues dynamics was higher y/y with increasing AUM but it wasn't enough to boost earnings. Revenues from Fixed Income and even Investment Banking were lower y/y. US bank loans increased just by $1 milion to $145,8 million. Source: Morgan Stanley report
Morgan Stanley (MS.US) chart on W1 interval
We can see that the price of Morgan Stanley shares dropped below SMA200 on W1 (red line) and 38,2 Fibonacci retracement level of upward wave from April 2020. Levels below 78 USD per share may signalize further and longer weakness. Last time when price dropped below SMA200 was in 2020 and 2008 during GFC.
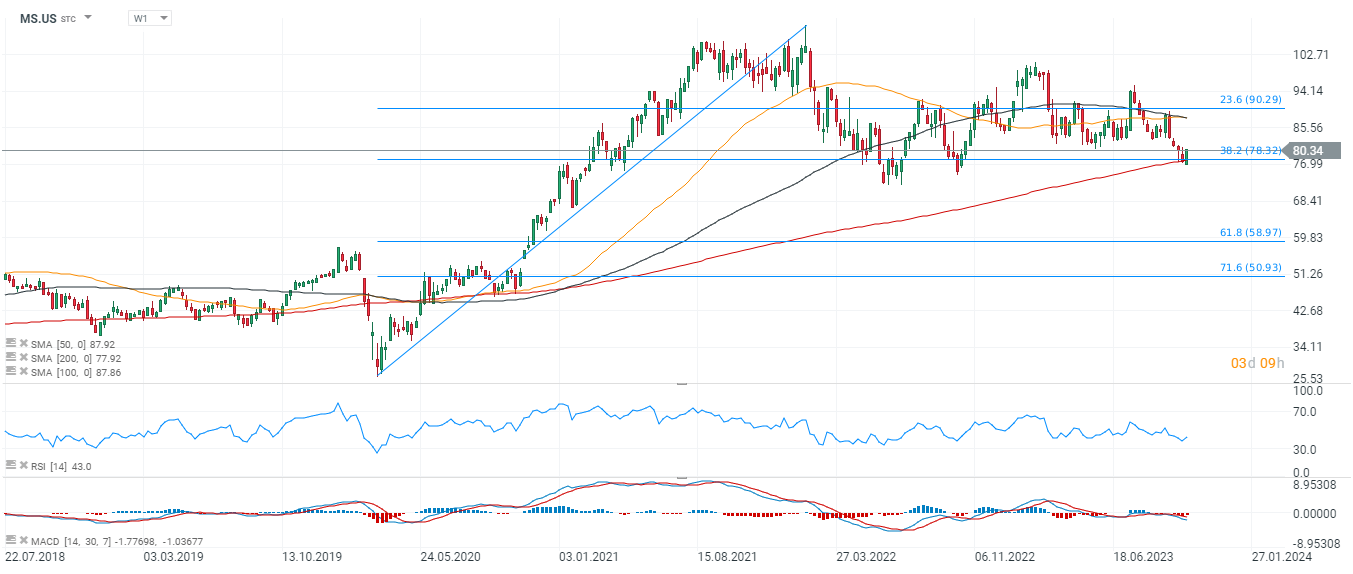 Source: xStation5

Meta Announces Its Own AI Chips. Is the Era of Full Dependence on NVIDIA Slowly Coming to an End?

Vodafone shares surge 13% after Xavier Niel's £4.4 billion investment. What's next for the stock?

🚩 Apollo Global warns on AI: Has the market become too optimistic?

Stock of the Week: Seagate Technology. How an old technology found a new role in the era of artificial intelligence
The content of this report has been created by XTB S.A., with its registered office in Warsaw, at Prosta 67, 00-838 Warsaw, Poland, (KRS number 0000217580) and supervised by Polish Supervision Authority ( No. DDM-M-4021-57-1/2005). This material is a marketing communication within the meaning of Art. 24 (3) of Directive 2014/65/EU of the European Parliament and of the Council of 15 May 2014 on markets in financial instruments and amending Directive 2002/92/EC and Directive 2011/61/EU (MiFID II). Marketing communication is not an investment recommendation or information recommending or suggesting an investment strategy within the meaning of Regulation (EU) No 596/2014 of the European Parliament and of the Council of 16 April 2014 on market abuse (market abuse regulation) and repealing Directive 2003/6/EC of the European Parliament and of the Council and Commission Directives 2003/124/EC, 2003/125/EC and 2004/72/EC and Commission Delegated Regulation (EU) 2016/958 of 9 March 2016 supplementing Regulation (EU) No 596/2014 of the European Parliament and of the Council with regard to regulatory technical standards for the technical arrangements for objective presentation of investment recommendations or other information recommending or suggesting an investment strategy and for disclosure of particular interests or indications of conflicts of interest or any other advice, including in the area of investment advisory, within the meaning of the Trading in Financial Instruments Act of 29 July 2005 (i.e. Journal of Laws 2019, item 875, as amended). The marketing communication is prepared with the highest diligence, objectivity, presents the facts known to the author on the date of preparation and is devoid of any evaluation elements. The marketing communication is prepared without considering the client’s needs, his individual financial situation and does not present any investment strategy in any way. The marketing communication does not constitute an offer of sale, offering, subscription, invitation to purchase, advertisement or promotion of any financial instruments. XTB S.A. is not liable for any client’s actions or omissions, in particular for the acquisition or disposal of financial instruments, undertaken on the basis of the information contained in this marketing communication. In the event that the marketing communication contains any information about any results regarding the financial instruments indicated therein, these do not constitute any guarantee or forecast regarding the future results.