
Netflix shares plunged more than 9% after the market close, despite the company reporting solid results for the first quarter of 2026. The negative market reaction was mainly driven by more cautious forward guidance, which came in below expectations in several key areas. The most important Q1 figures were earnings per share and revenue - both beat market expectations, but this was not what investors focused on, as future outlook proved more critical. The streaming pioneer also announced that chairman and co-founder, Reed Hastings is stepping down from the board after 29 years.
- EPS: $1.23 vs. $0.66 y/y
- Revenue: $12.25B vs. $12.17B expected
Other elements of the report present a more nuanced picture. Free cash flow reached $5.09B compared to expectations of $2.67B, representing a clear positive surprise. At the same time, guidance for the second quarter came in below consensus: the company expects EPS of $0.78 (vs. $0.84), revenue of $12.57B (vs. $12.64B), and operating income of $4.11B (vs. $4.34B). Operating margin is projected at 32.6%, compared to expectations of 34.4%.
For the full year, Netflix still anticipates relatively stable growth, although some metrics differ from market expectations. The company sees free cash flow at around $12.5B (previously about $11B; vs. $12.05B expected). Annual revenue is projected in the range of $50.7B to $51.7B (vs. $51.37B), implying growth of 12% to 14%. Full-year operating margin is expected at 31.5% (vs. 32%), while 2026 advertising revenue remains on track to reach around $3B. The market may have quietly hoped for an upward revision of this figure.
Record engagement with content?
Importantly, Netflix reached a record level of user engagement in Q1, which is one of the company’s key internal metrics for platform quality. The company is expanding into new content formats, including video podcasts and live events (such as the World Baseball Classic, which set viewership records in Japan). This indicates a shift beyond the traditional streaming model.
Netflix is also pushing further into gaming, launching a standalone app for children—signaling product diversification. At the same time, AI is becoming a core element of its technology strategy, highlighted by the acquisition of InterPositive (a GenAI tool for creators) and the use of AI to enhance user experience. This points to continued investment in production efficiency and personalization.
A redesign of the mobile app is also planned, including the introduction of vertical video formats, which may be a response to competition from platforms like TikTok. Recent price increases have been well received by the market, suggesting relatively low price sensitivity among users (pricing power). Netflix also emphasizes strong confidence in its long-term growth, referring to a “long runway of growth”—indicating further expansion potential. While acknowledging the highly competitive nature of the industry, the company highlights that its strategy is based on continuous product improvement and faster execution than its competitors.
Netflix key financial figures
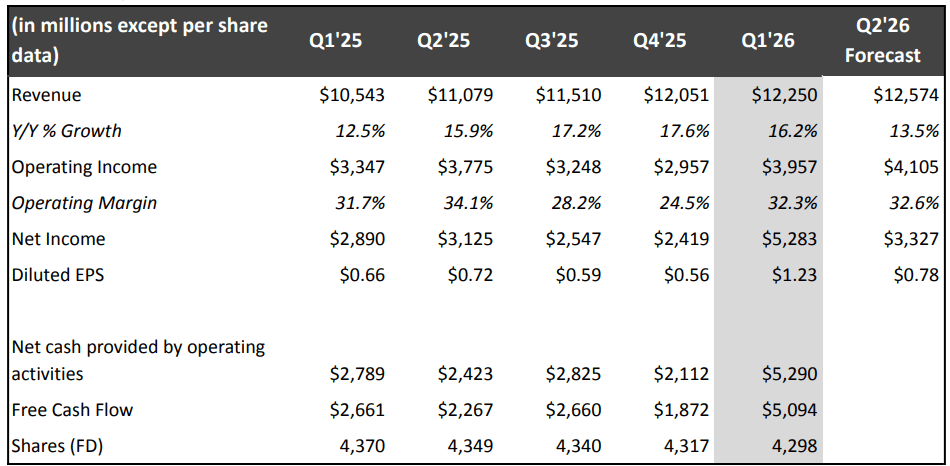
Source: Netflix
Netflix revenue breakdown by region
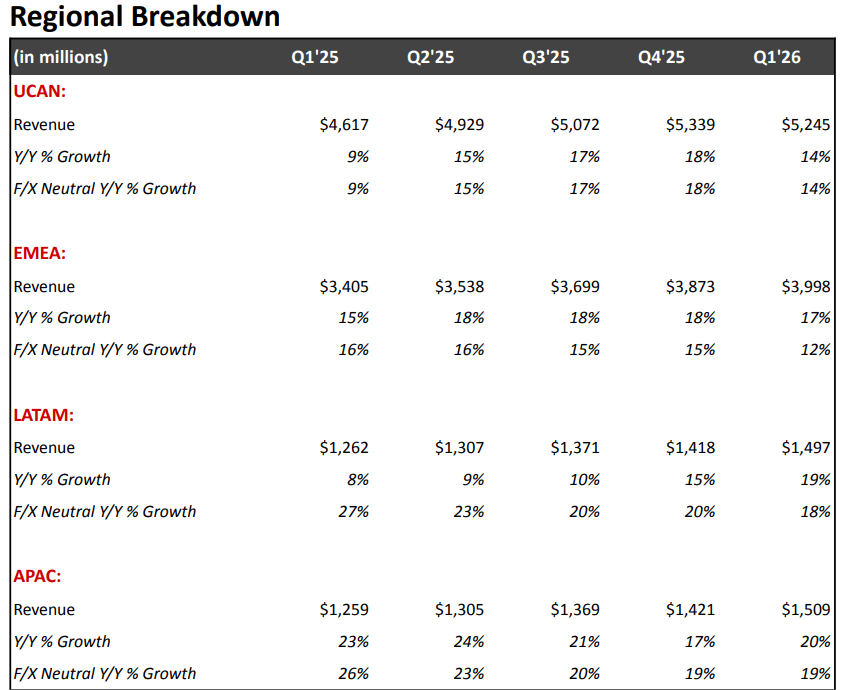
Source: Netflix
Key insights from the results
Revenue growth was driven by a combination of subscriber growth, price increases, and rising advertising revenue. This indicates that Netflix’s business model is becoming increasingly diversified.
- Foreign exchange (FX) had a positive impact on results, meaning that part of the revenue growth was supported not only by operational performance but also by macroeconomic factors.
- A significant portion of the EPS increase was influenced by a one-off $2.8 billion termination fee related to the Warner Bros. transaction, recorded under “interest and other income.” This suggests that part of the profit improvement is not recurring.
Operating margin is expanding year over year, confirming improving operational efficiency rather than just scaling effects. At the same time, Netflix is clearly communicating its financial priorities, pointing to a gradual shift away from a “growth at all costs” approach toward a more balanced model focused on:
→ revenue growth
→ operating margin
→ free cash flow
Advertising is becoming an increasingly important segment, with the company expecting it to nearly double in 2026, making it one of the key growth drivers. Content costs (content amortization) are expected to be front-loaded in the first half of the year, which explains weaker margins in Q2 and highlights cost seasonality. Netflix signals margin improvement in the second half of the year (Q3–Q4), suggesting that current cost pressures are temporary rather than structural. Revenue growth in Q2 is expected to remain solid (~13%), despite weaker profitability guidance, indicating a divergence between revenue dynamics and cost trends.
Key cash flow insights
The cash flow section shows that Netflix entered 2026 with a very strong liquidity position. Operating cash flow increased to $5.3 billion from $2.8 billion a year earlier, while free cash flow rose to $5.1 billion from $2.7 billion in the same period.
- This represents a significant improvement, although it is important to note that a large portion of the increase was driven by the one-off $2.8 billion termination fee related to the Warner Bros. deal. This means that while cash generation appears strong, not all of the improvement is recurring.
- The company also raised its full-year 2026 free cash flow guidance to approximately $12.5 billion from the previous $11 billion estimate, again largely due to this one-off effect. At the same time, Netflix has not changed its capital allocation approach.
- The company continues to prioritize reinvestment in the business—both organically and through selective M&A while maintaining liquidity, and only then returning excess cash to shareholders. This suggests that management remains focused on long-term growth and financial flexibility rather than short-term shareholder returns.
At the end of the quarter, Netflix reported $14.4 billion in gross debt and $12.3 billion in cash and cash equivalents. The elevated cash position reflects the earlier pause in share buybacks during the Warner Bros. transaction, followed by the receipt of the termination fee. After deciding not to increase its offer for Warner Bros., Netflix resumed share repurchases, buying back 13.5 million shares for $1.3 billion during the quarter, with $6.8 billion remaining under the current authorization. This highlights strong capital flexibility while maintaining a disciplined balance sheet approach.
Netflix shares (D1 timeframe)
The after-hours reaction suggests that the price may retest the key support level tomorrow, defined by the 200-day EMA (red line) around $97 per share. Holding this level could indicate a return to upward momentum, while a break below it may be interpreted as confirmation of a prevailing downtrend - following nearly a 40% rebound from the January lows.
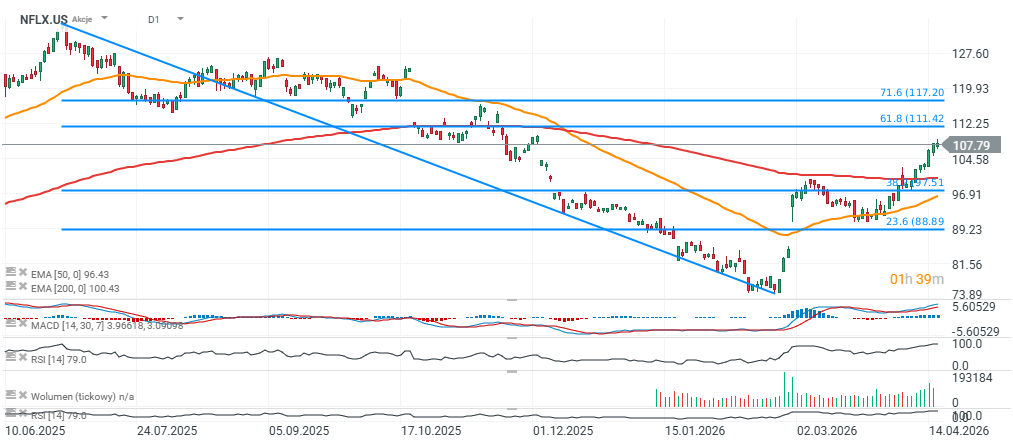
Source: xStation5

Market Wrap: European equities at 3-week highs! Apple dips in US premarket!

Morning Wrap: AI Fuels the Rebound. Technology Makes a Strong Comeback
Apple is still impressive, but the market is no longer impressed
Amazon’s massive AI bet is starting to pay off
The content of this report has been created by XTB S.A., with its registered office in Warsaw, at Prosta 67, 00-838 Warsaw, Poland, (KRS number 0000217580) and supervised by Polish Supervision Authority ( No. DDM-M-4021-57-1/2005). This material is a marketing communication within the meaning of Art. 24 (3) of Directive 2014/65/EU of the European Parliament and of the Council of 15 May 2014 on markets in financial instruments and amending Directive 2002/92/EC and Directive 2011/61/EU (MiFID II). Marketing communication is not an investment recommendation or information recommending or suggesting an investment strategy within the meaning of Regulation (EU) No 596/2014 of the European Parliament and of the Council of 16 April 2014 on market abuse (market abuse regulation) and repealing Directive 2003/6/EC of the European Parliament and of the Council and Commission Directives 2003/124/EC, 2003/125/EC and 2004/72/EC and Commission Delegated Regulation (EU) 2016/958 of 9 March 2016 supplementing Regulation (EU) No 596/2014 of the European Parliament and of the Council with regard to regulatory technical standards for the technical arrangements for objective presentation of investment recommendations or other information recommending or suggesting an investment strategy and for disclosure of particular interests or indications of conflicts of interest or any other advice, including in the area of investment advisory, within the meaning of the Trading in Financial Instruments Act of 29 July 2005 (i.e. Journal of Laws 2019, item 875, as amended). The marketing communication is prepared with the highest diligence, objectivity, presents the facts known to the author on the date of preparation and is devoid of any evaluation elements. The marketing communication is prepared without considering the client’s needs, his individual financial situation and does not present any investment strategy in any way. The marketing communication does not constitute an offer of sale, offering, subscription, invitation to purchase, advertisement or promotion of any financial instruments. XTB S.A. is not liable for any client’s actions or omissions, in particular for the acquisition or disposal of financial instruments, undertaken on the basis of the information contained in this marketing communication. In the event that the marketing communication contains any information about any results regarding the financial instruments indicated therein, these do not constitute any guarantee or forecast regarding the future results.