
The recent FOMC meeting stirred significant emotions. The hawkish Dot Plot, the committee members' interest rate projection, led to a considerable strengthening of the dollar. Consequently, the EURUSD pair fell to its lowest level in over a year.
Figure 1: EURUSD (2025 - 2026)
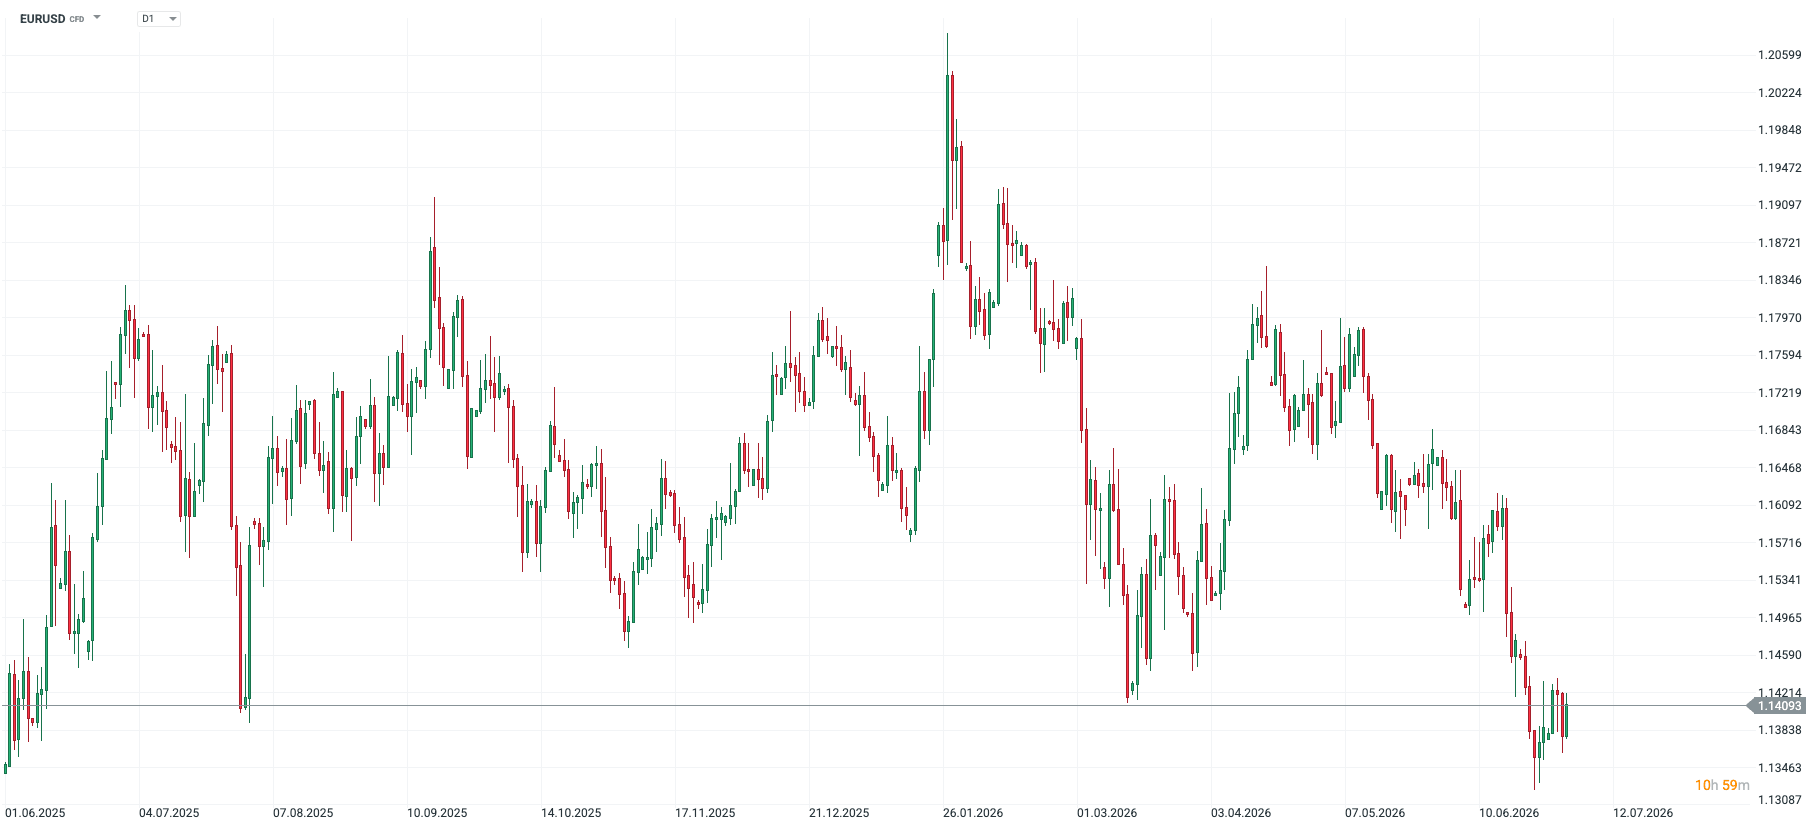 Source: xStation, 02.07.2026
Half of the policymakers indicated a rate hike before the end of the year, expressing concern about the inflationary situation and placing faith in the strength of the labour market. Today's NFP data release, scheduled for 1:30 PM, will be a significant test for this narrative.
Figure 2: FOMC Dot Plot (2026 - 2028+)
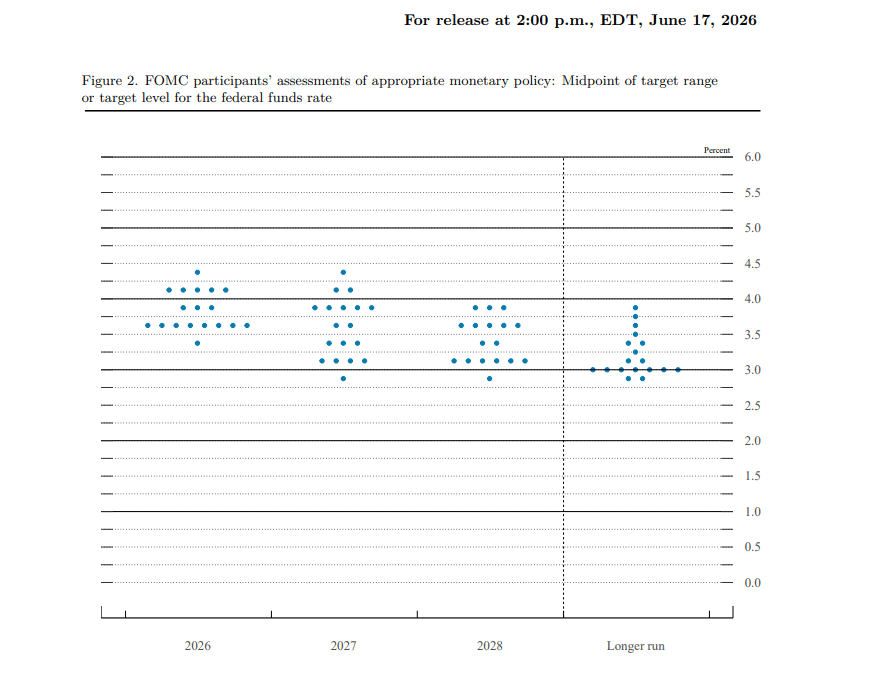 Source: FOMC, 02.07.2026
What do we already know about the US labour market?
The latest NFP reading
In May, the number of jobs in the US labour market increased by 172k. This result was not just better than the consensus (86k), but significantly exceeds even the most optimistic forecasts (125k). Data for the two previous months (March and April) were also revised upwards. Since the Bureau of Labour Statistics has accustomed us to significant downward revisions, this was an exceptionally large surprise. At the same time, the unemployment rate remained unchanged (4.3%).
Figure 3: Change in Non-Farm Payrolls (NFP) and the US Unemployment Rate (2023 - 2026)
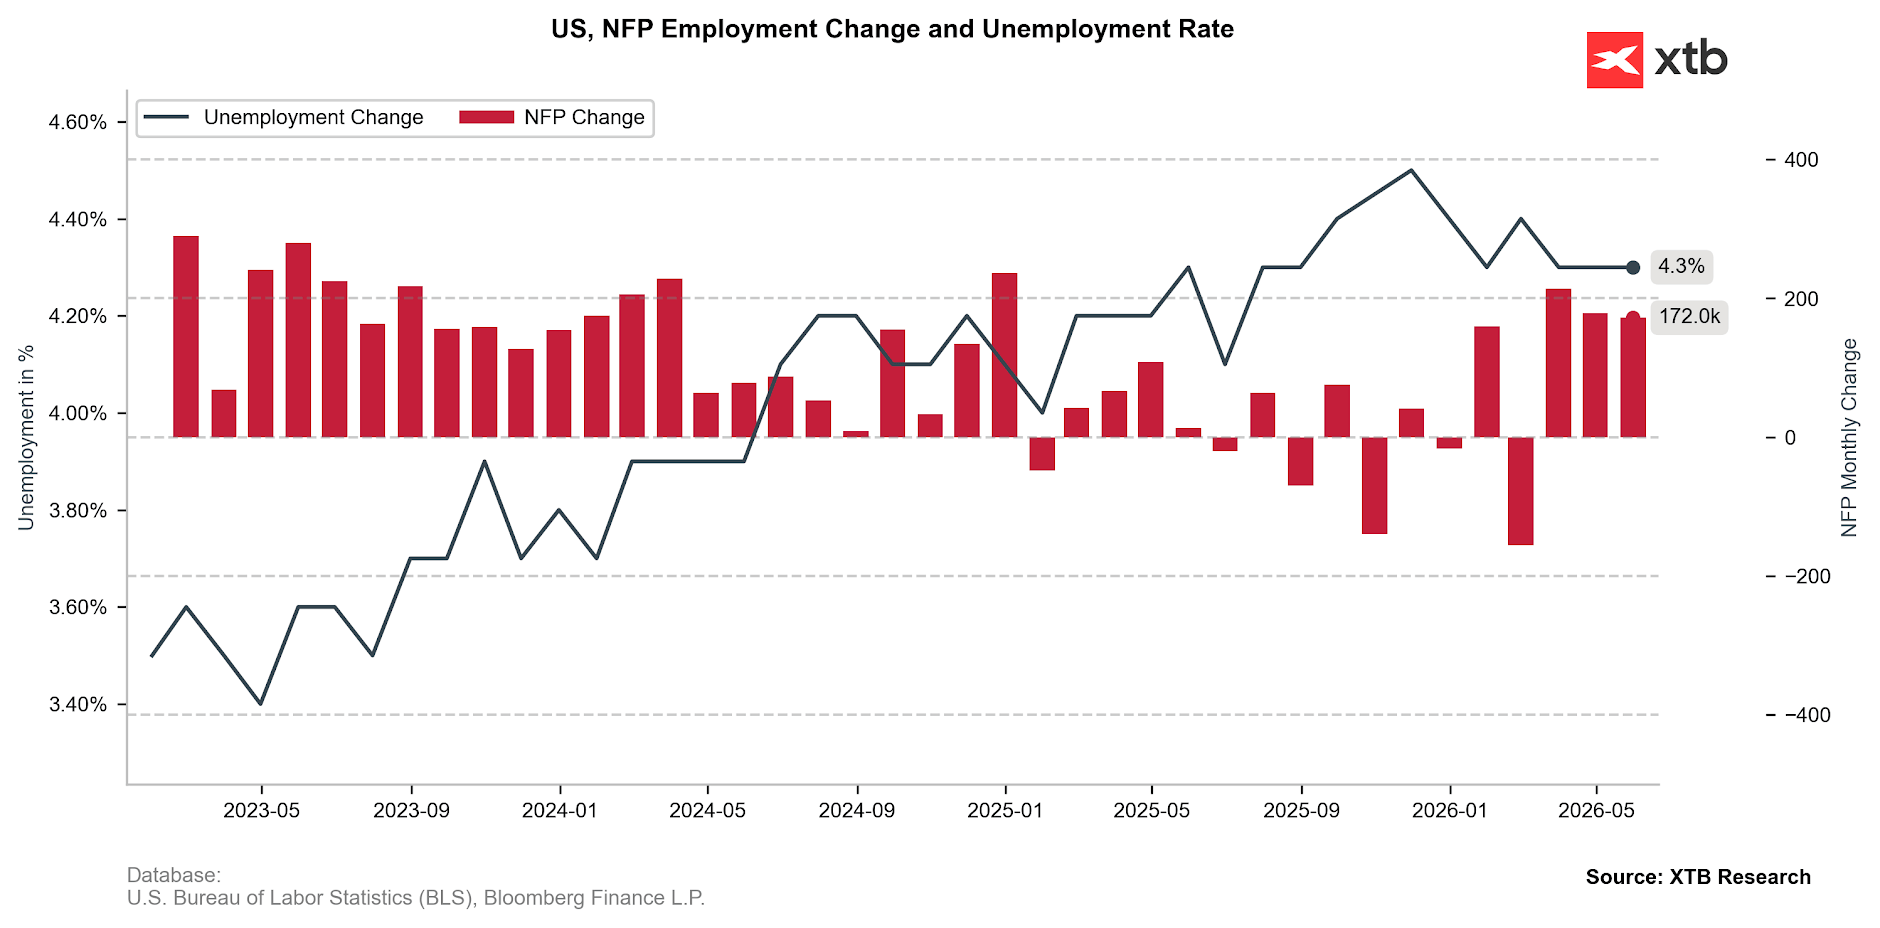 Source: XTB Research, 02.07.2026
ADP
Although the data published yesterday was an unpleasant surprise for the markets, it still showed at least decent job creation (+98k).
- We see a significant disparity between the services sector (+96k) and the industrial sector.
- This was largely driven by the education and healthcare sector (+48k).
- Trade/logistics (+15k) and finance (+14k) also performed well.
- Weakness was observed once again in the leisure and hospitality industry (+2k), despite the World Cup taking place in the US.
- The situation in mining also does not look great (-5k).
Wage growth for those deciding to stay with their current employer reached 4.4%, and 6.6% for those changing jobs.
- Employees in the financial sector (5.1%) and industry (4.9%) could count on the highest raises.
- We saw a significant disparity between micro-enterprises employing fewer than 20 people (+2.9%) and companies with 50 or more employees contracted (+4.7%-4.8%).
The pace of job creation is slowing, but it is consistent with the "soft landing" narrative. In many sectors, finding employment takes longer than previously (the average unemployment duration has extended to 26 weeks), but this is not a comprehensive picture. In key industries, employers still encounter problems finding the right hands to work.
JOLTS
The JOLTS data, it is worth noting at the start, is delayed by one month relative to other readings. Therefore, it does not present as current a picture of the situation currently prevailing in the American economy. Especially in a period of such dynamic changes on the geopolitical front and the volatility of key energy commodity prices.
Nevertheless, the data for May does not give us major reasons for concern.
- The number of new vacancies grew at a pace similar to April's (and at that time we recorded a very significant improvement, which was perceived by many as temporary).
- The number of job quits remained at a low, albeit stable, level (3.1m). Only 1.9% of employees decided to voluntarily resign from their current position, which indicates a certain mistrust regarding the possibility of quickly finding a new vacancy.
- However, layoffs also remain at a low level – 1.7m, or 1.1%.
- The ratio of unemployed people actively looking for work to new vacancies remains around 1, which also does not raise major concern.
The data shows a picture of a stable labour market with little employee turnover. A clear reluctance to take the risk of resigning from the current position is visible. At the same time, however, employers are not inclined to mass layoffs.
Weekly jobless claims
The jobless claims data published last week also provide proof of this. These fell to 215k, remaining close to multi-year lows.
- The 4-week moving average also remains at a low level (224k).
- Continued claims (1.8m) remain below several-year averages but show a clear upward trend.
PMI Indicators
ISM: The sub-component for employment (49.7) still indicates a cut in vacancies in the industrial sector. And this is despite the increase in production and new orders, which may indicate cost-cutting in the face of rising expenses. However, the reduction in employment is clearly slowing down, and the trend is positive.
S&P: The picture outlined by S&P data looks much less positive. The data indicates the strongest reduction in vacancies since May 2020, i.e., the peak of pandemic lockdowns. Crucial in this respect is the increase in the prices of production components and raw materials.
What will investors pay attention to today?
Apart from the main reading, which will show the change in the number of people employed in non-farm sectors (consensus: 113k), we will look towards:
- Revision of data for the last two months.
- Unemployment rate (consensus: 4.3%).
- Wage growth, both annually and monthly (consensus: 3.5%; 0.3%).
In the face of rising inflationary concerns (inflation at 4.2% and core measure reaching 2.9%), wage growth may draw particular attention. The consensus assumes a reading of 3.5%, which means a drop in earnings in real terms.
Figure 4: CPI inflation and wage growth in the US (2007 - 2026)
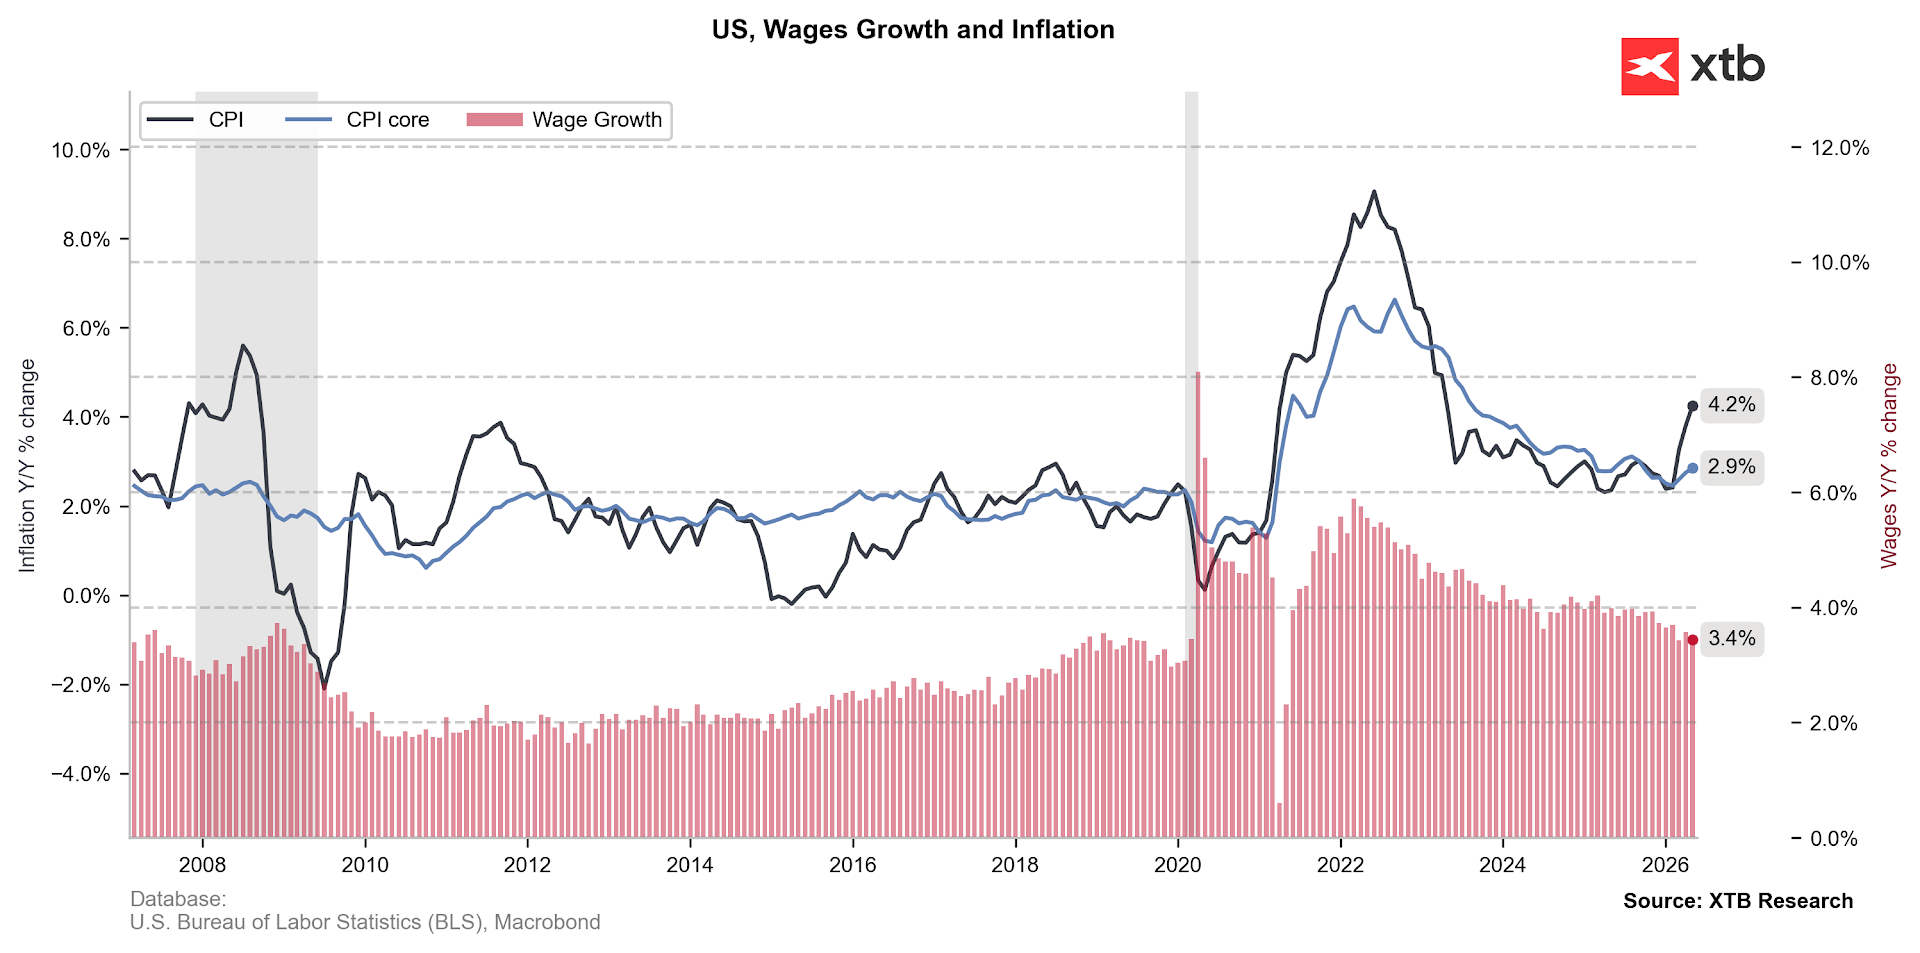 Source: XTB Research, 02.07.2026
Lower-than-expected data would increase concerns about the American consumer, which are already quite strongly outlined at this moment. Consumption is largely taking place at the expense of savings (the savings rate has fallen to just 3%), and its growth is very uneven. The increase in consumption among the quintile (20%) of the highest earners in the US after accounting for inflation reached 3.8% in Q1. In the remaining part (80% of citizens), it essentially stood still (+0.6%).
On the other hand, a strong increase in employment may confirm the hawkish FOMC axis in the conviction about the need for interest rate hikes. Maintaining the "low fire-low hire" state should allow policymakers to focus their attention fully on the inflationary pressure, which remains uncomfortably high.
Figure 5: Market-implied interest rate path in the United States (2026 - 2027)
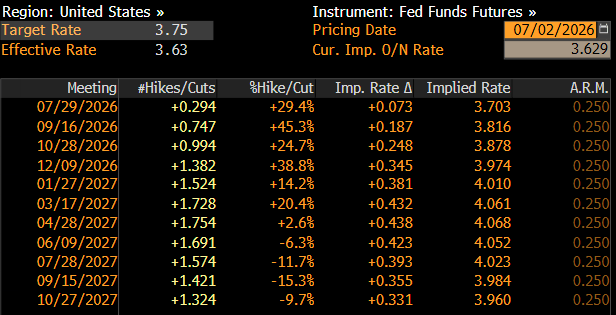 Source: Bloomberg, 02.07.2026
—
Michał Jóźwiak, Financial Markets Analyst at XTB

Economic Calendar: Big Tech, Tensions Over Iran, and the ECB’s Decision ⏰

Daily Summary: Wall Street Stabilizes Despite Higher Oil Prices

Chart of the Day: AI supports gains – can Tesla and Google sustain them? (22.07.2026)

Economic Calendar: Time for Tesla and Google Earnings (22.07.2026)
The content of this report has been created by XTB S.A., with its registered office in Warsaw, at Prosta 67, 00-838 Warsaw, Poland, (KRS number 0000217580) and supervised by Polish Supervision Authority ( No. DDM-M-4021-57-1/2005). This material is a marketing communication within the meaning of Art. 24 (3) of Directive 2014/65/EU of the European Parliament and of the Council of 15 May 2014 on markets in financial instruments and amending Directive 2002/92/EC and Directive 2011/61/EU (MiFID II). Marketing communication is not an investment recommendation or information recommending or suggesting an investment strategy within the meaning of Regulation (EU) No 596/2014 of the European Parliament and of the Council of 16 April 2014 on market abuse (market abuse regulation) and repealing Directive 2003/6/EC of the European Parliament and of the Council and Commission Directives 2003/124/EC, 2003/125/EC and 2004/72/EC and Commission Delegated Regulation (EU) 2016/958 of 9 March 2016 supplementing Regulation (EU) No 596/2014 of the European Parliament and of the Council with regard to regulatory technical standards for the technical arrangements for objective presentation of investment recommendations or other information recommending or suggesting an investment strategy and for disclosure of particular interests or indications of conflicts of interest or any other advice, including in the area of investment advisory, within the meaning of the Trading in Financial Instruments Act of 29 July 2005 (i.e. Journal of Laws 2019, item 875, as amended). The marketing communication is prepared with the highest diligence, objectivity, presents the facts known to the author on the date of preparation and is devoid of any evaluation elements. The marketing communication is prepared without considering the client’s needs, his individual financial situation and does not present any investment strategy in any way. The marketing communication does not constitute an offer of sale, offering, subscription, invitation to purchase, advertisement or promotion of any financial instruments. XTB S.A. is not liable for any client’s actions or omissions, in particular for the acquisition or disposal of financial instruments, undertaken on the basis of the information contained in this marketing communication. In the event that the marketing communication contains any information about any results regarding the financial instruments indicated therein, these do not constitute any guarantee or forecast regarding the future results.