
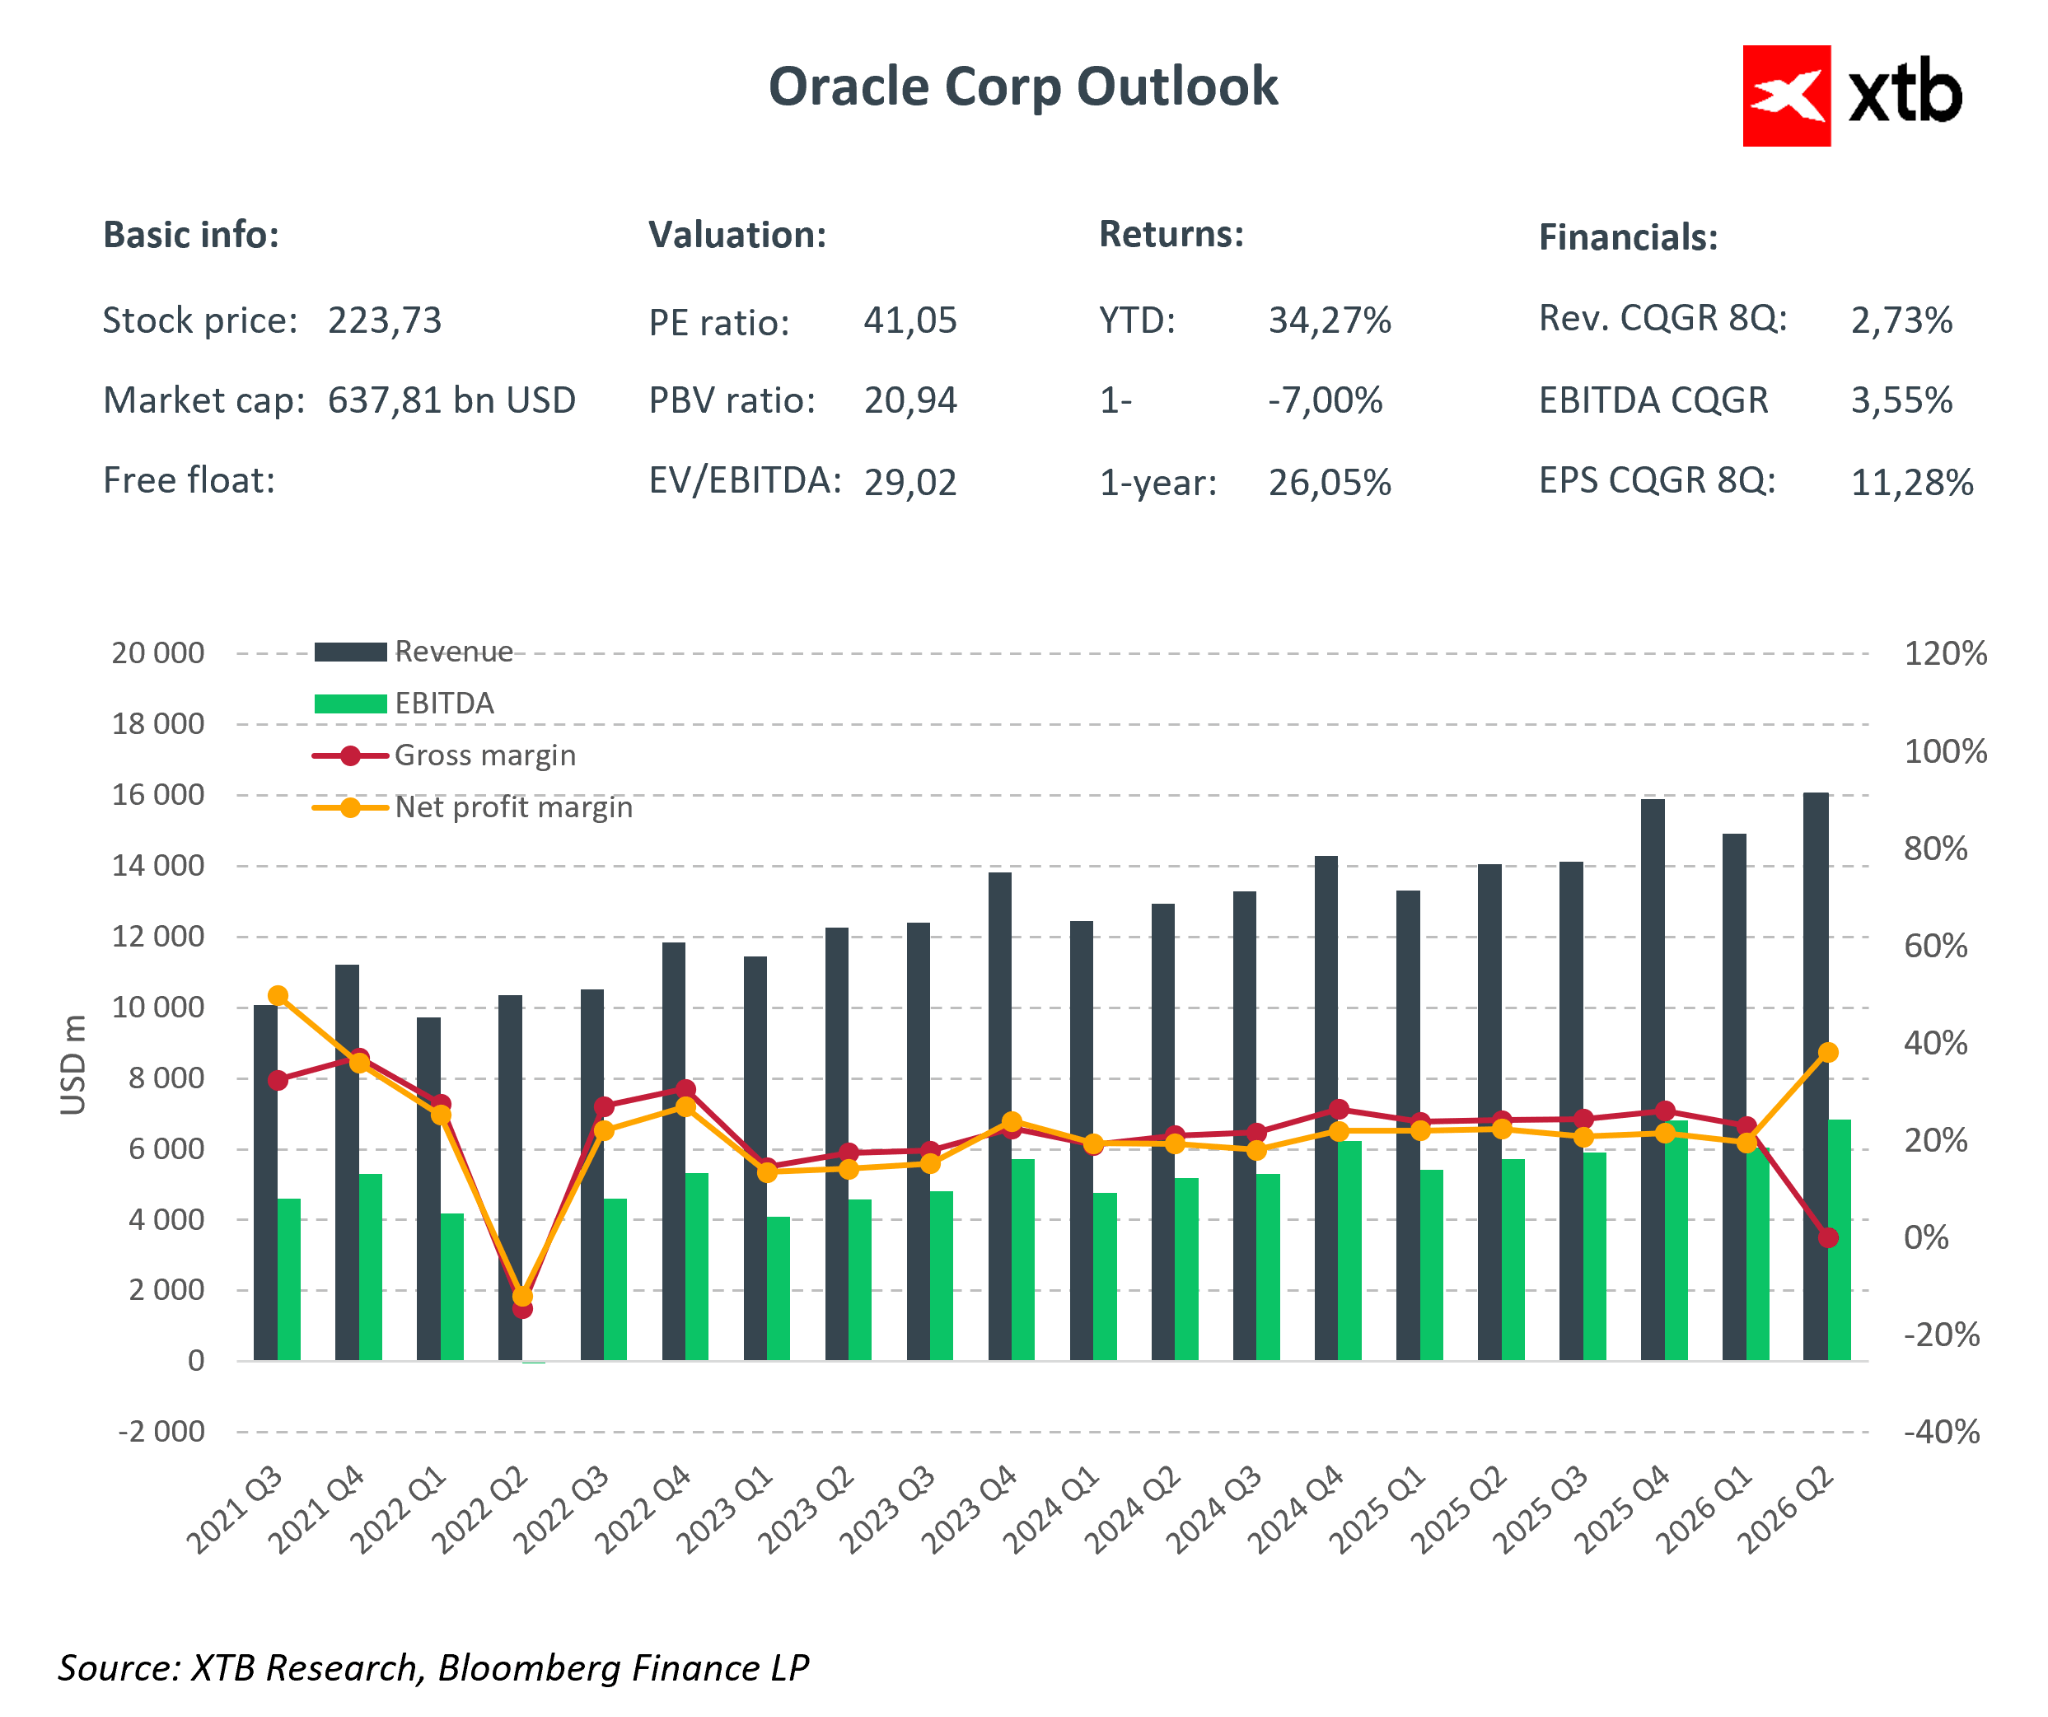
Oracle reported Q2 FY2026 results that can be described as “mixed, with a strong focus on the future.” Revenues reached approximately $16.1 billion, up 14% year-over-year, slightly below the market consensus of $16.2 billion. While this was a minor miss, it was enough to trigger a post-market stock drop of over 10%. At the same time, adjusted EPS significantly exceeded market expectations, and GAAP EPS was boosted by a one-time gain from the sale of Ampere shares. The market focused on cautious revenue growth, aggressive AI investments, and whether Oracle may have over-leveraged.
Financial Highlights Q2 FY2026
-
Total Revenues: $16.1B (+14% YoY; consensus $16.2B) – modestly below expectations, prompting market reaction.
-
Cloud (IaaS + SaaS): $8.0B (+34% YoY) – growth engine:
-
OCI: $4.1B (+66–68% YoY) – AI and GPU infrastructure growing rapidly, offering significant future revenue potential.
-
SaaS: $3.9B (+11% YoY) – steady growth, slower than OCI, indicating the growth focus is shifting toward infrastructure.
-
-
Net Income: $6.13B
-
Software: $5.9B (-3% YoY) – decline continues as customers migrate to the cloud, reducing top-line growth.
-
Adjusted EPS (non-GAAP): $2.26 (+40% vs. consensus, +50% YoY) – strong surprise driven by operational leverage and one-off items.
-
Reported GAAP EPS: $2.10 (+80–90% YoY) – includes a one-time $2.7B pre-tax gain from Ampere.
-
Adjusted Operating Income: $6.7B (margin ~40%) – high operational efficiency despite rising CAPEX and sales costs.
-
Annual Operating Cash Flow: $22.3B – solid base for further investments and potential debt reduction.
-
Remaining Performance Obligations (RPO): $523B, up 438% YoY. Massive contract backlog and future revenue visibility.
Revenue, Margins, and One-Offs
Oracle’s revenue structure clearly shows it is now a cloud-first company. Cloud, including infrastructure and SaaS, accounts for roughly half of total sales and grows much faster than other business segments. OCI infrastructure revenue grows ~60–70% YoY, while cloud application revenue grows ~10% annually. Traditional software continues to decline, reducing overall top-line growth but confirming real customer migration to the cloud. This shift increases subscription revenue predictability, though it limits headline revenue spikes in the short term.
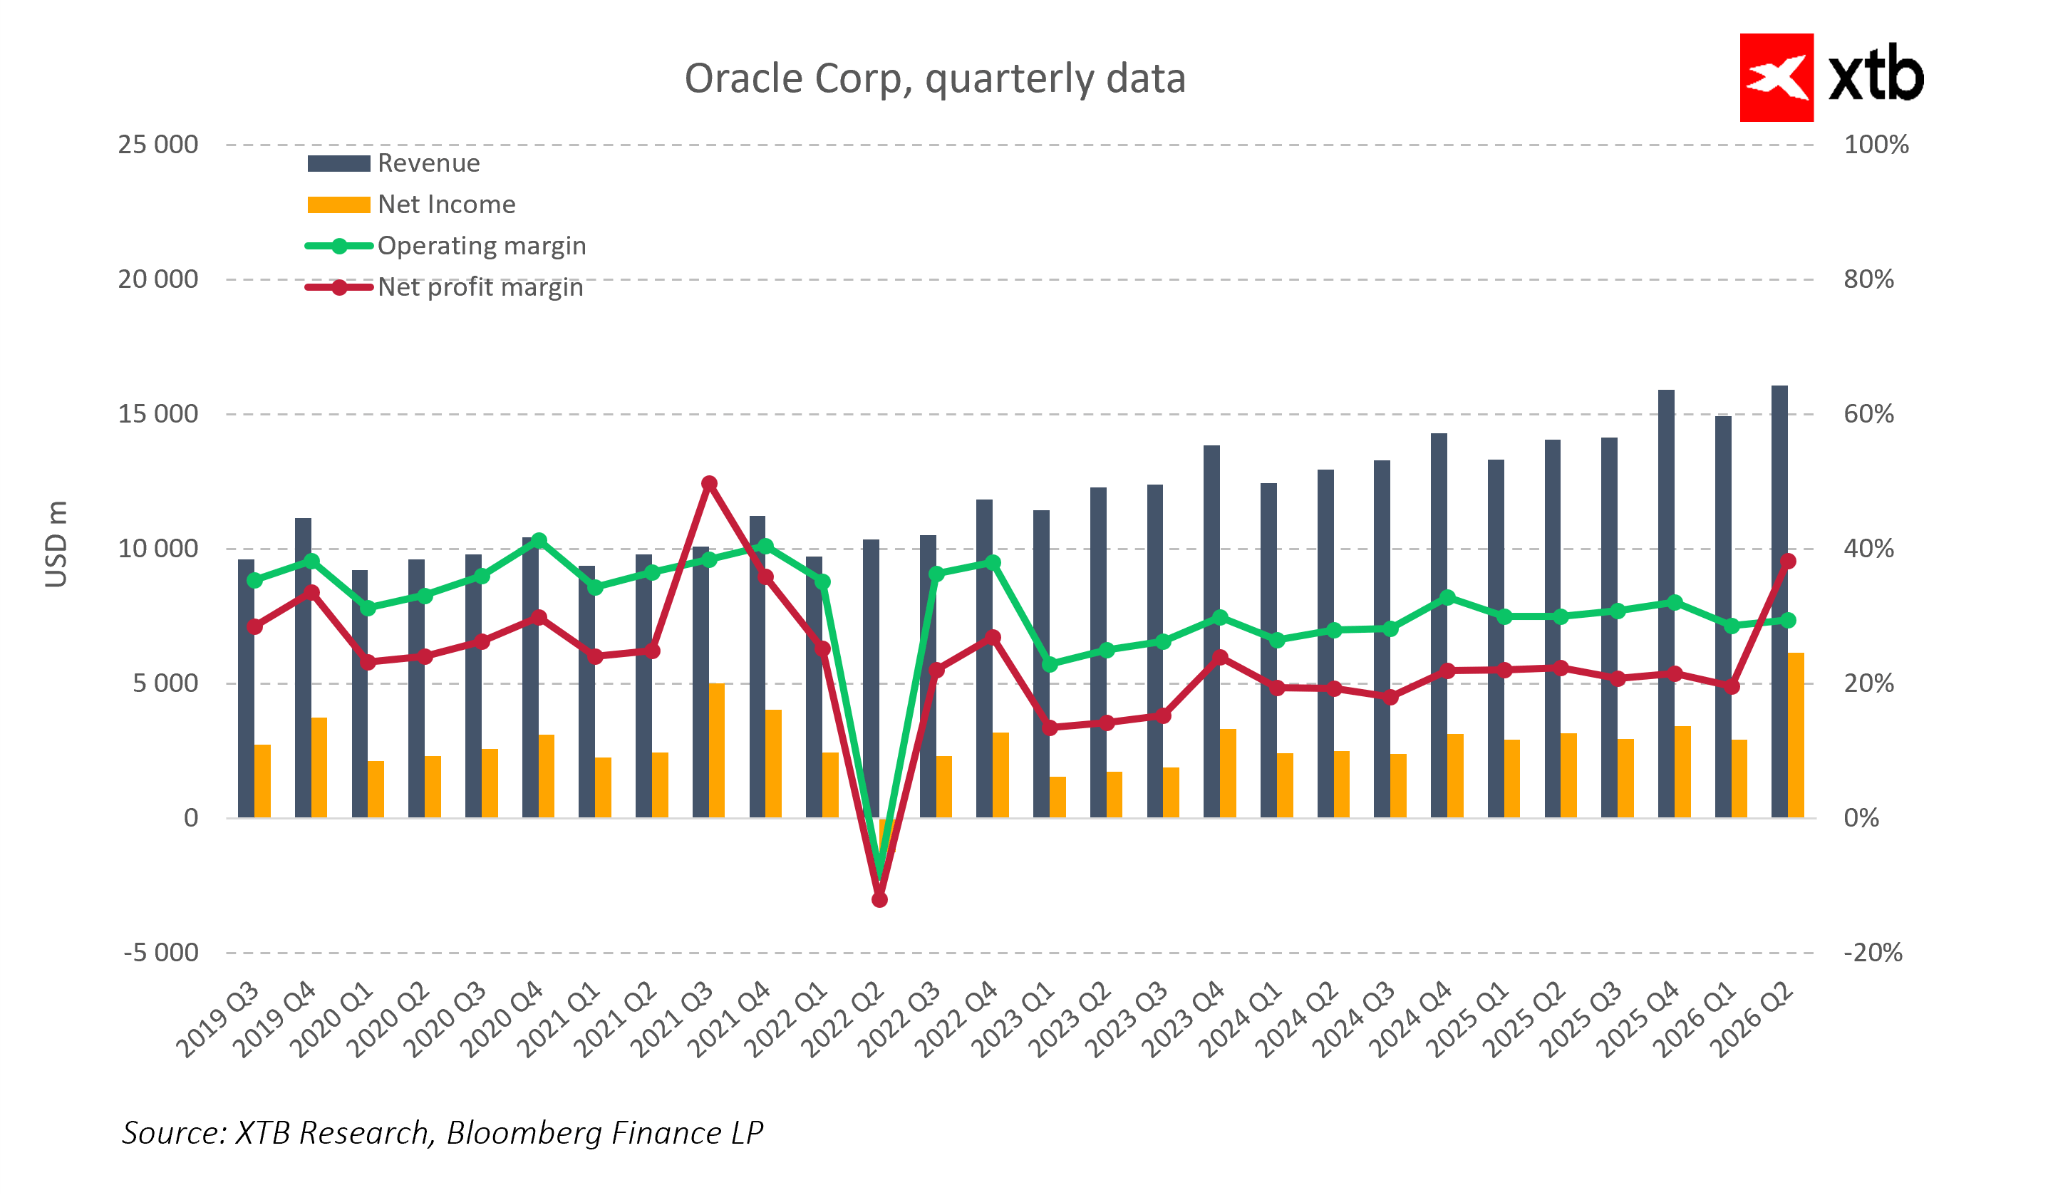
Net income remains volatile, with a notable trough around 2022 and subsequent recovery. Q2 FY2026 shows a clear net margin spike, mainly due to the one-time Ampere sale rather than pure operational improvement. Operating margin remains relatively stable at 30–35%, showing strong efficiency despite rising product development and sales costs. Net margin is influenced more by financial items, taxes, and one-offs.
EBITDA, ROIC, and Cost of Capital
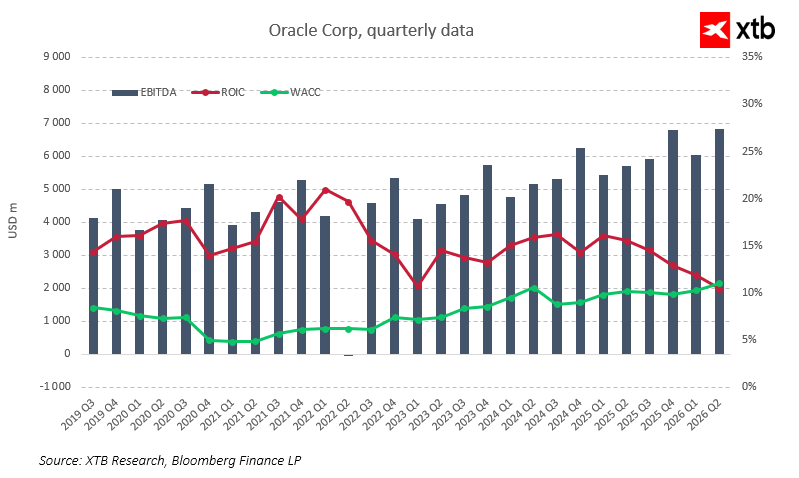
EBITDA has grown steadily, from ~$4B per quarter in 2019–2020 to nearly $7B in Q2 FY2026, accelerating as cloud revenues grow, confirming the scalability of the cloud model. ROIC has consistently exceeded WACC, historically creating shareholder value. The ROIC-WACC spread was particularly high in 2020–2022. Recently, the spread has narrowed, with ROIC falling from over 20% to the teens, while WACC has risen slightly due to higher interest rates and growing debt. This indicates that rising AI investments and infrastructure expansion are starting to reduce capital efficiency.
EPS, especially adjusted, remains strong and correlates with improving EBITDA, but higher capital costs mean each new investment must generate a proportionally higher return. The speed and quality of AI contract monetization are crucial, as nominal backlog value alone is insufficient if ROIC trends toward WACC.
RPO $523B – A Buffer for Future Revenues
Oracle’s backlog has attracted significant attention. RPO stands at ~$523B, up several hundred percent YoY, with tens of billions added in a single quarter. Growth is driven by multi-year infrastructure and database contracts for AI projects with major clients, including global social platforms, semiconductor manufacturers, and financial institutions building proprietary AI models and analytics systems.
Some contracts are long-term, but management notes that short-term RPO—due within the next 12 months—is growing ~40% YoY, up from 25% last quarter. This suggests faster conversion of backlog into revenue, especially in the cloud infrastructure segment, where consumption-based contracts begin generating revenue almost immediately. Management estimates the additional RPO added in Q2 could increase FY2027 revenue by ~$4B versus prior plans, confirming the backlog as a real growth buffer rather than just a marketing figure.
However, the market notes that most RPO remains long-term, with only a small portion converting to revenue within a year. Investors are increasingly focusing on the pace of contract conversion to revenue, cash flows, and contract terms such as discounts, price indexation, and usage clauses.
Debt, Liquidity, and Scenarios
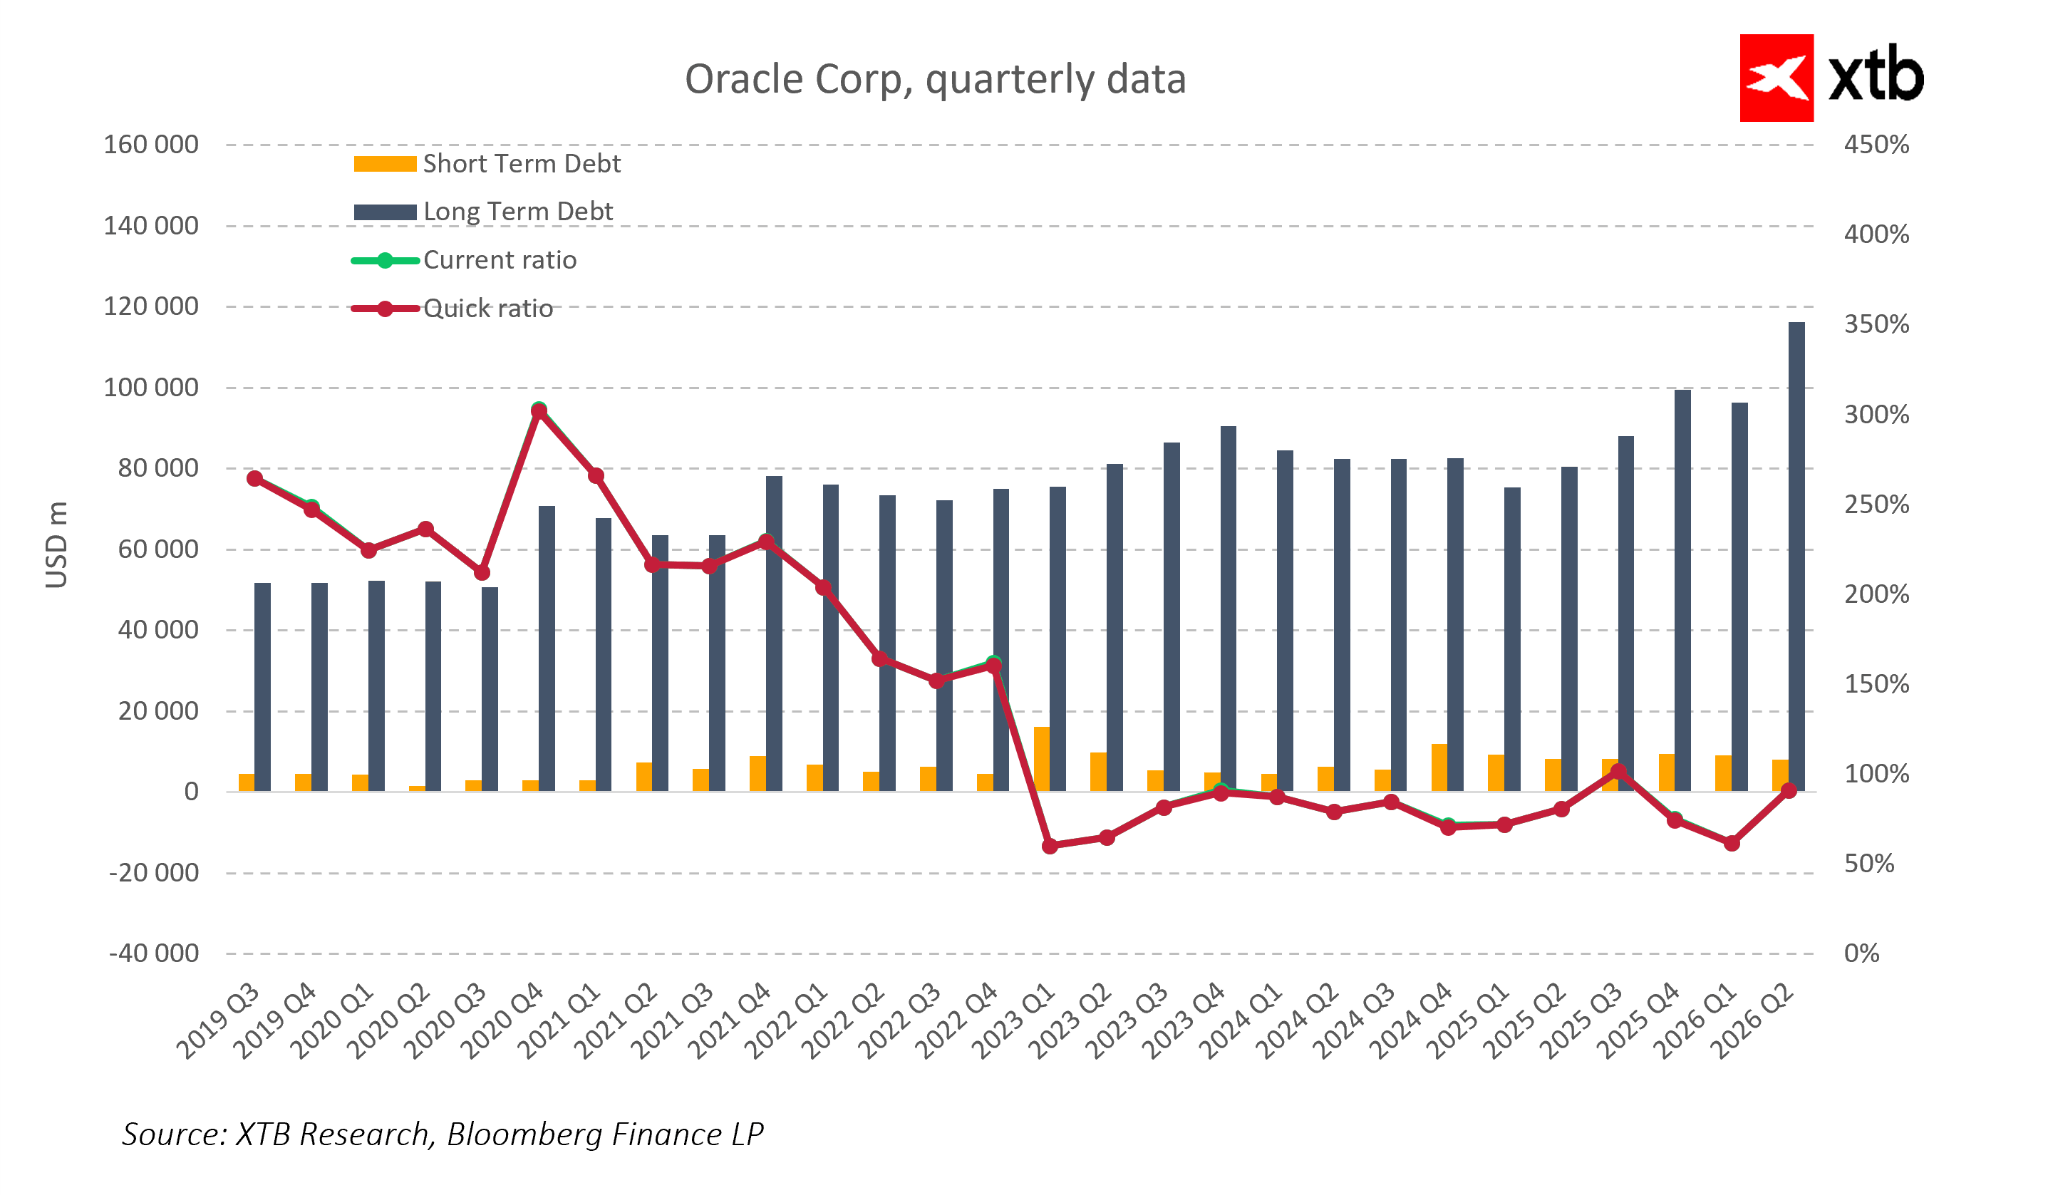
Oracle has moved from a moderately leveraged software company to one of the most highly leveraged tech giants. Long-term debt rose from ~$55–60B in 2019–2020 to ~$115–120B in Q2 FY2026. Rising debt costs and higher credit risk premiums make the balance sheet riskier.
Scenarios:
-
Base (“Soft AI Landing”) – AI infrastructure demand remains high, Oracle successfully monetizes backlog, CAPEX normalizes, free cash flows increase, and debt gradually declines.
-
Intermediate (“AI Normalization”) – demand grows more slowly, some backlog converts with delay, the company must balance CAPEX and debt reduction, increasing rating and cost-of-debt pressure.
-
Negative – AI demand weakens, debt and high CAPEX become a burden, requiring cuts to CAPEX and defensive capital management.
If ROIC remains above WACC despite high CAPEX and leverage, it signals strong capital allocation and that each AI investment dollar creates value. If ROIC continues to decline and capital costs remain high, the spread could shrink, limiting valuation potential even amid solid revenue growth. Market attention should focus on ROIC vs. WACC as investment waves unfold.
Conclusions
Q2 FY2026 results do not undermine Oracle’s long-term investment thesis as a beneficiary of growing cloud and AI demand, but the focus shifts from “Is the company in AI?” to “At what pace and risk level will it monetize its AI exposure?” Record backlog, dynamic OCI growth, and stable operating margins suggest the current stock pullback could be an attractive entry for investors tolerant of higher volatility.
On the other hand, high CAPEX, rising debt, and a narrowing ROIC-WACC spread limit management’s flexibility, and the market will be less forgiving of future “mixed” results than during the early AI boom.
Oracle is becoming a barometer for the AI tech market. If it maintains the expected pace of converting RPO into revenue and cash flows, it will validate the profitability of capital-intensive AI infrastructure investments. If monetization is slower or less profitable than expected, current debt and CAPEX levels could trigger further stock corrections for Oracle and other companies building AI-based investment strategies.

Alphabet and Tesla Ahead of Earnings: Will the Tech Giants Shake Wall Street?

Defense sector ahead of earnings: Summary

Chart of the Day: AI supports gains – can Tesla and Google sustain them? (22.07.2026)

Economic Calendar: Time for Tesla and Google Earnings (22.07.2026)
The content of this report has been created by XTB S.A., with its registered office in Warsaw, at Prosta 67, 00-838 Warsaw, Poland, (KRS number 0000217580) and supervised by Polish Supervision Authority ( No. DDM-M-4021-57-1/2005). This material is a marketing communication within the meaning of Art. 24 (3) of Directive 2014/65/EU of the European Parliament and of the Council of 15 May 2014 on markets in financial instruments and amending Directive 2002/92/EC and Directive 2011/61/EU (MiFID II). Marketing communication is not an investment recommendation or information recommending or suggesting an investment strategy within the meaning of Regulation (EU) No 596/2014 of the European Parliament and of the Council of 16 April 2014 on market abuse (market abuse regulation) and repealing Directive 2003/6/EC of the European Parliament and of the Council and Commission Directives 2003/124/EC, 2003/125/EC and 2004/72/EC and Commission Delegated Regulation (EU) 2016/958 of 9 March 2016 supplementing Regulation (EU) No 596/2014 of the European Parliament and of the Council with regard to regulatory technical standards for the technical arrangements for objective presentation of investment recommendations or other information recommending or suggesting an investment strategy and for disclosure of particular interests or indications of conflicts of interest or any other advice, including in the area of investment advisory, within the meaning of the Trading in Financial Instruments Act of 29 July 2005 (i.e. Journal of Laws 2019, item 875, as amended). The marketing communication is prepared with the highest diligence, objectivity, presents the facts known to the author on the date of preparation and is devoid of any evaluation elements. The marketing communication is prepared without considering the client’s needs, his individual financial situation and does not present any investment strategy in any way. The marketing communication does not constitute an offer of sale, offering, subscription, invitation to purchase, advertisement or promotion of any financial instruments. XTB S.A. is not liable for any client’s actions or omissions, in particular for the acquisition or disposal of financial instruments, undertaken on the basis of the information contained in this marketing communication. In the event that the marketing communication contains any information about any results regarding the financial instruments indicated therein, these do not constitute any guarantee or forecast regarding the future results.