
-
Silver Hits $50 Mark: Silver is up over 4%, fighting for a historic close above $50 after yesterday's record peak.
-
Bullish Signal: The gold-to-silver ratio is falling, suggesting strong potential upside for silver, with technicals not yet indicating extreme overbought levels.
-
Key Levels: Watch for resistance at $55/oz and support at $45/oz in the event of a correction.
-
Silver Hits $50 Mark: Silver is up over 4%, fighting for a historic close above $50 after yesterday's record peak.
-
Bullish Signal: The gold-to-silver ratio is falling, suggesting strong potential upside for silver, with technicals not yet indicating extreme overbought levels.
-
Key Levels: Watch for resistance at $55/oz and support at $45/oz in the event of a correction.
Yesterday, silver established a new all-time high, surpassing the peaks seen in the early 1980s and 2011. Crucially, however, it failed to secure a close above $50 per ounce. While gold saw a stronger correction yesterday, silver began Friday morning with robust gains. These advances have accelerated to over 3.5%, with the metal now trading around $50.90 per ounce, setting the stage for a potentially record-breaking closing price.
Technical Indicators and Historical Context
Examining silver’s current levels and its deviations from key averages, we observe that gold is expensive by historical standards, but not yet extremely so. Typically, a strong overvaluation of silver is indicated by a fivefold deviation from its five-year moving average, a 4-4.5 deviation from its one-year average, and a threefold deviation from its 100-day average.
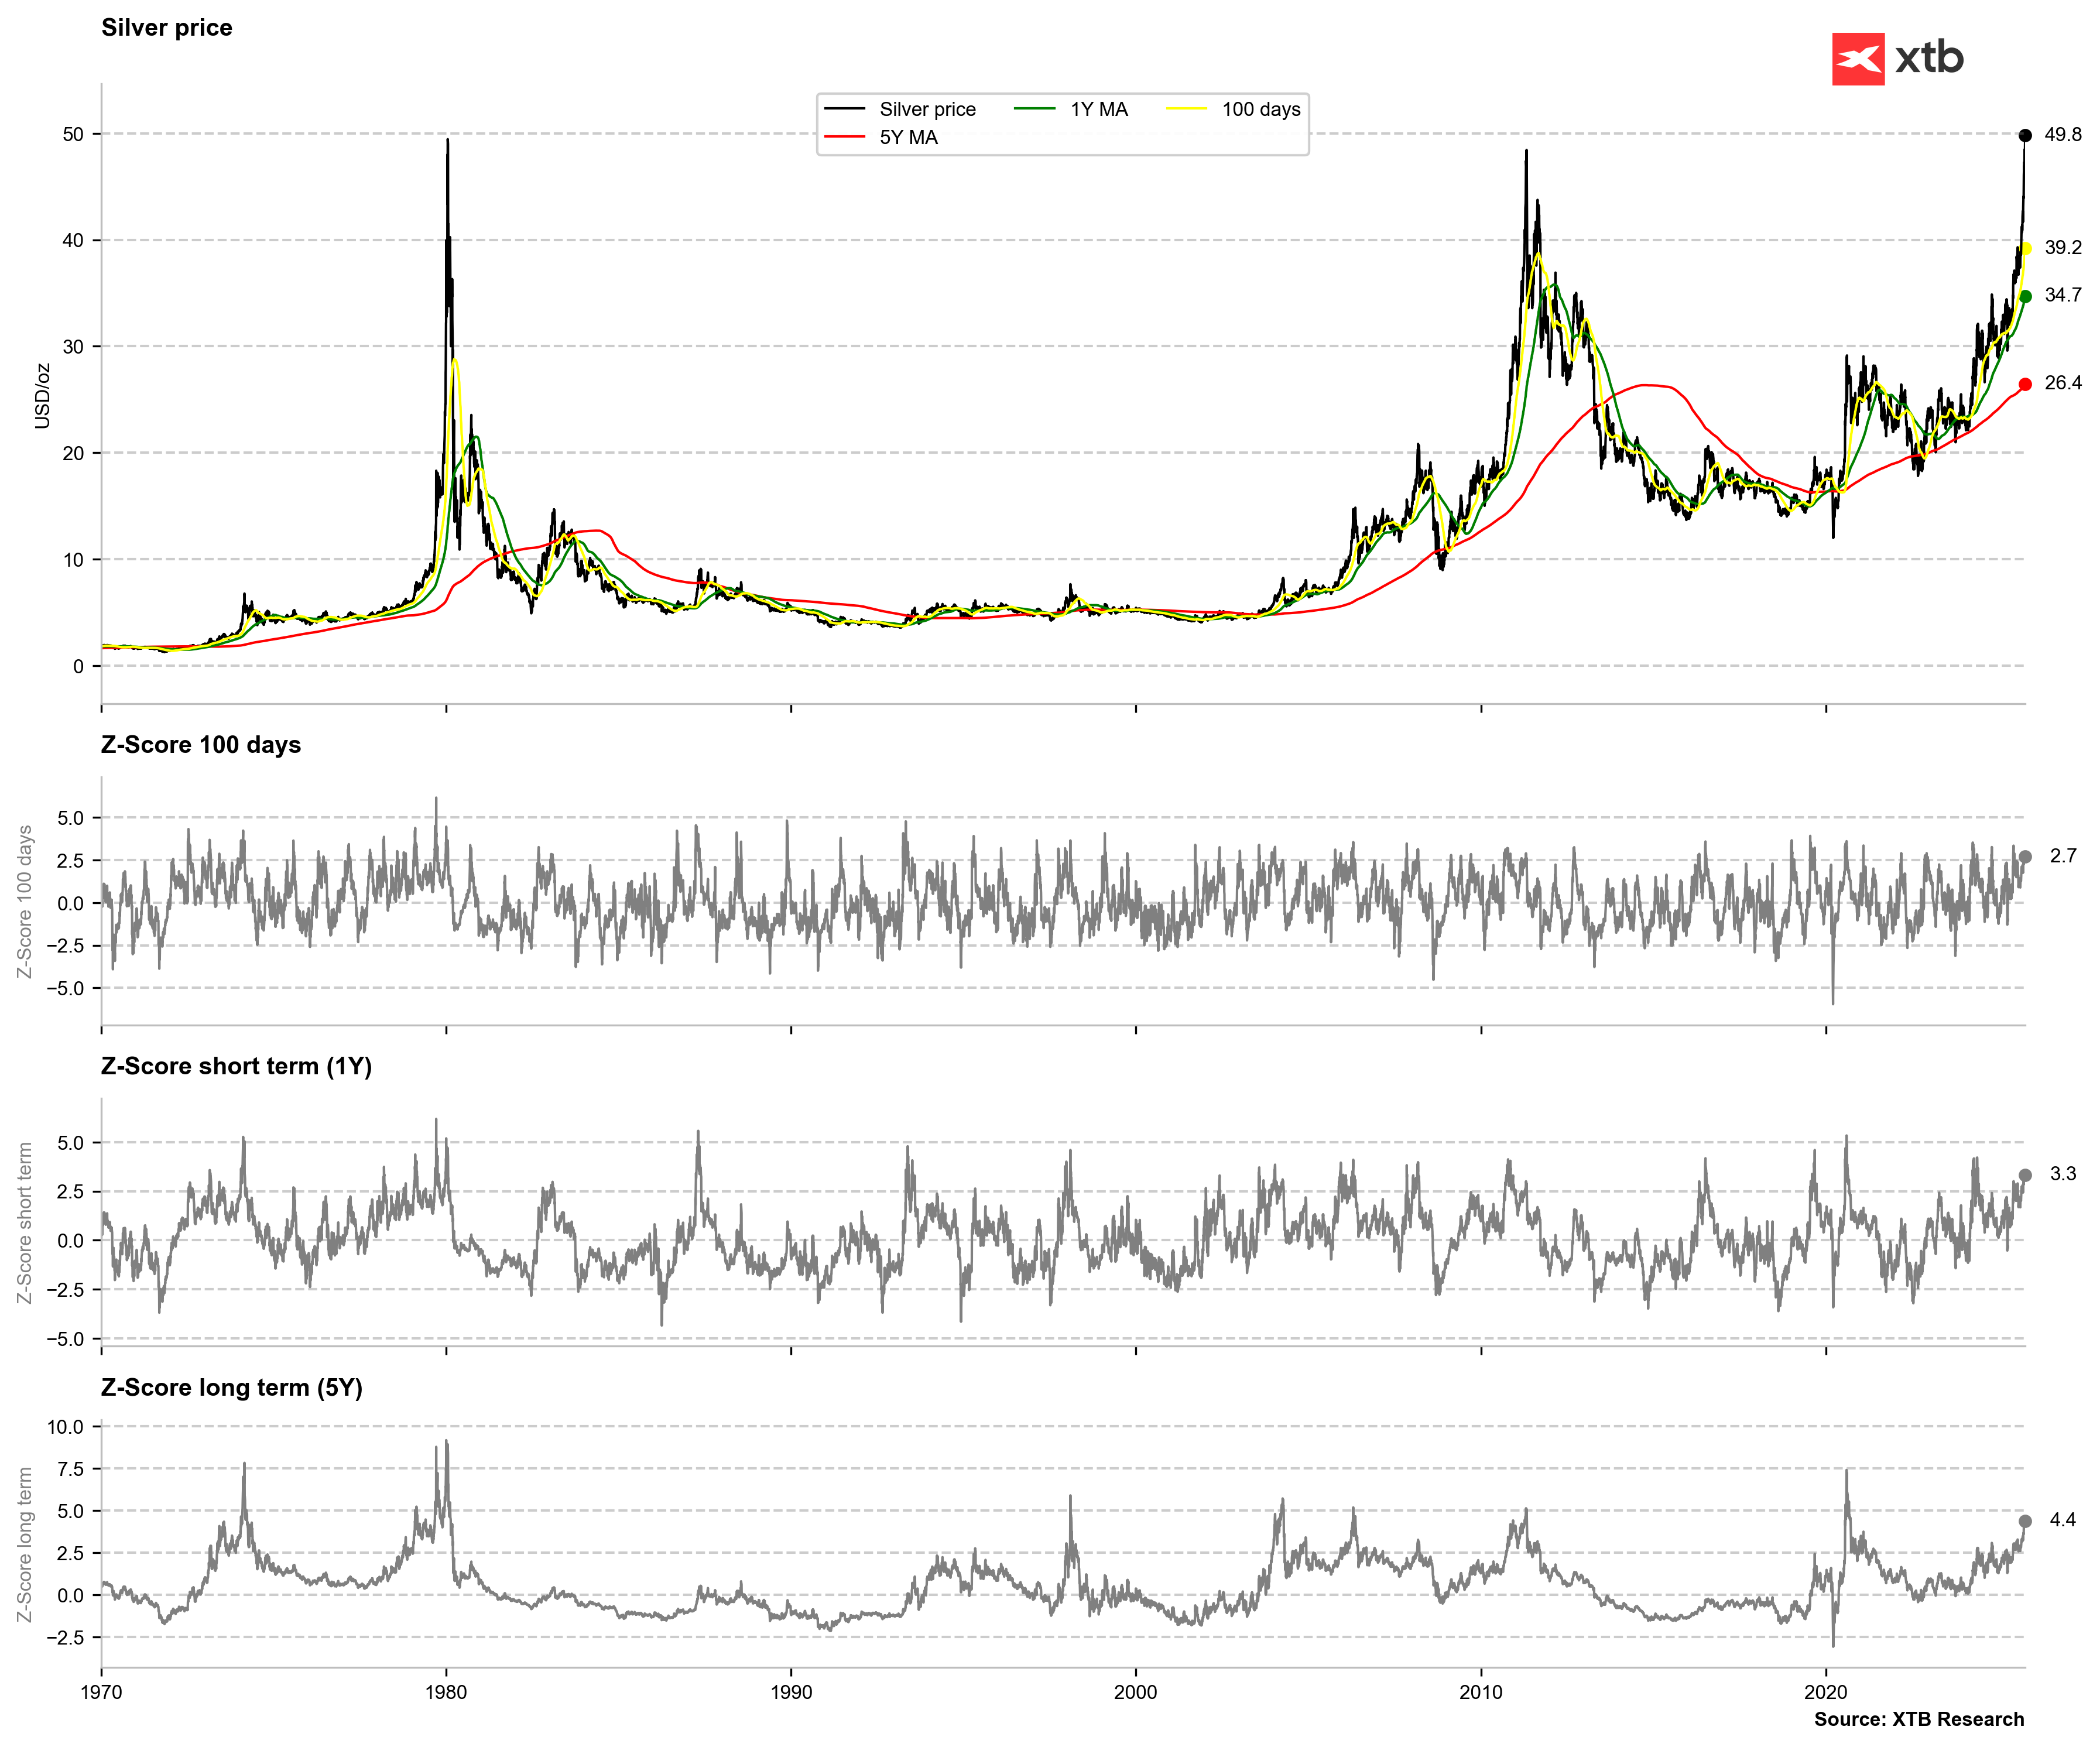
Silver is currently expensive, but strong technical overbought signals are not yet present. Source: Bloomberg Finance LP, XTB
Looking at the gold-to-silver ratio, we are seeing a drop below the 10-year average. In recent years, the ratio has rarely fallen below this average. However, if the bull phase in the precious metals market is not yet over, it is worth recalling the beginning of the previous decade when silver also approached $50 per ounce and the ratio plunged significantly below its average. In 2011, it even fell below the long-term average range of 50–53 points.
Assuming gold could reach $4,200 in the coming months and the ratio could fall to 70 points, this would imply a valuation of $60 per ounce for silver. Conversely, this ratio works both ways: in a decline, silver typically falls faster than gold. A 10% correction from current gold levels would imply $3,600 for gold. If the ratio were to rise to 90, silver would be valued at $40.
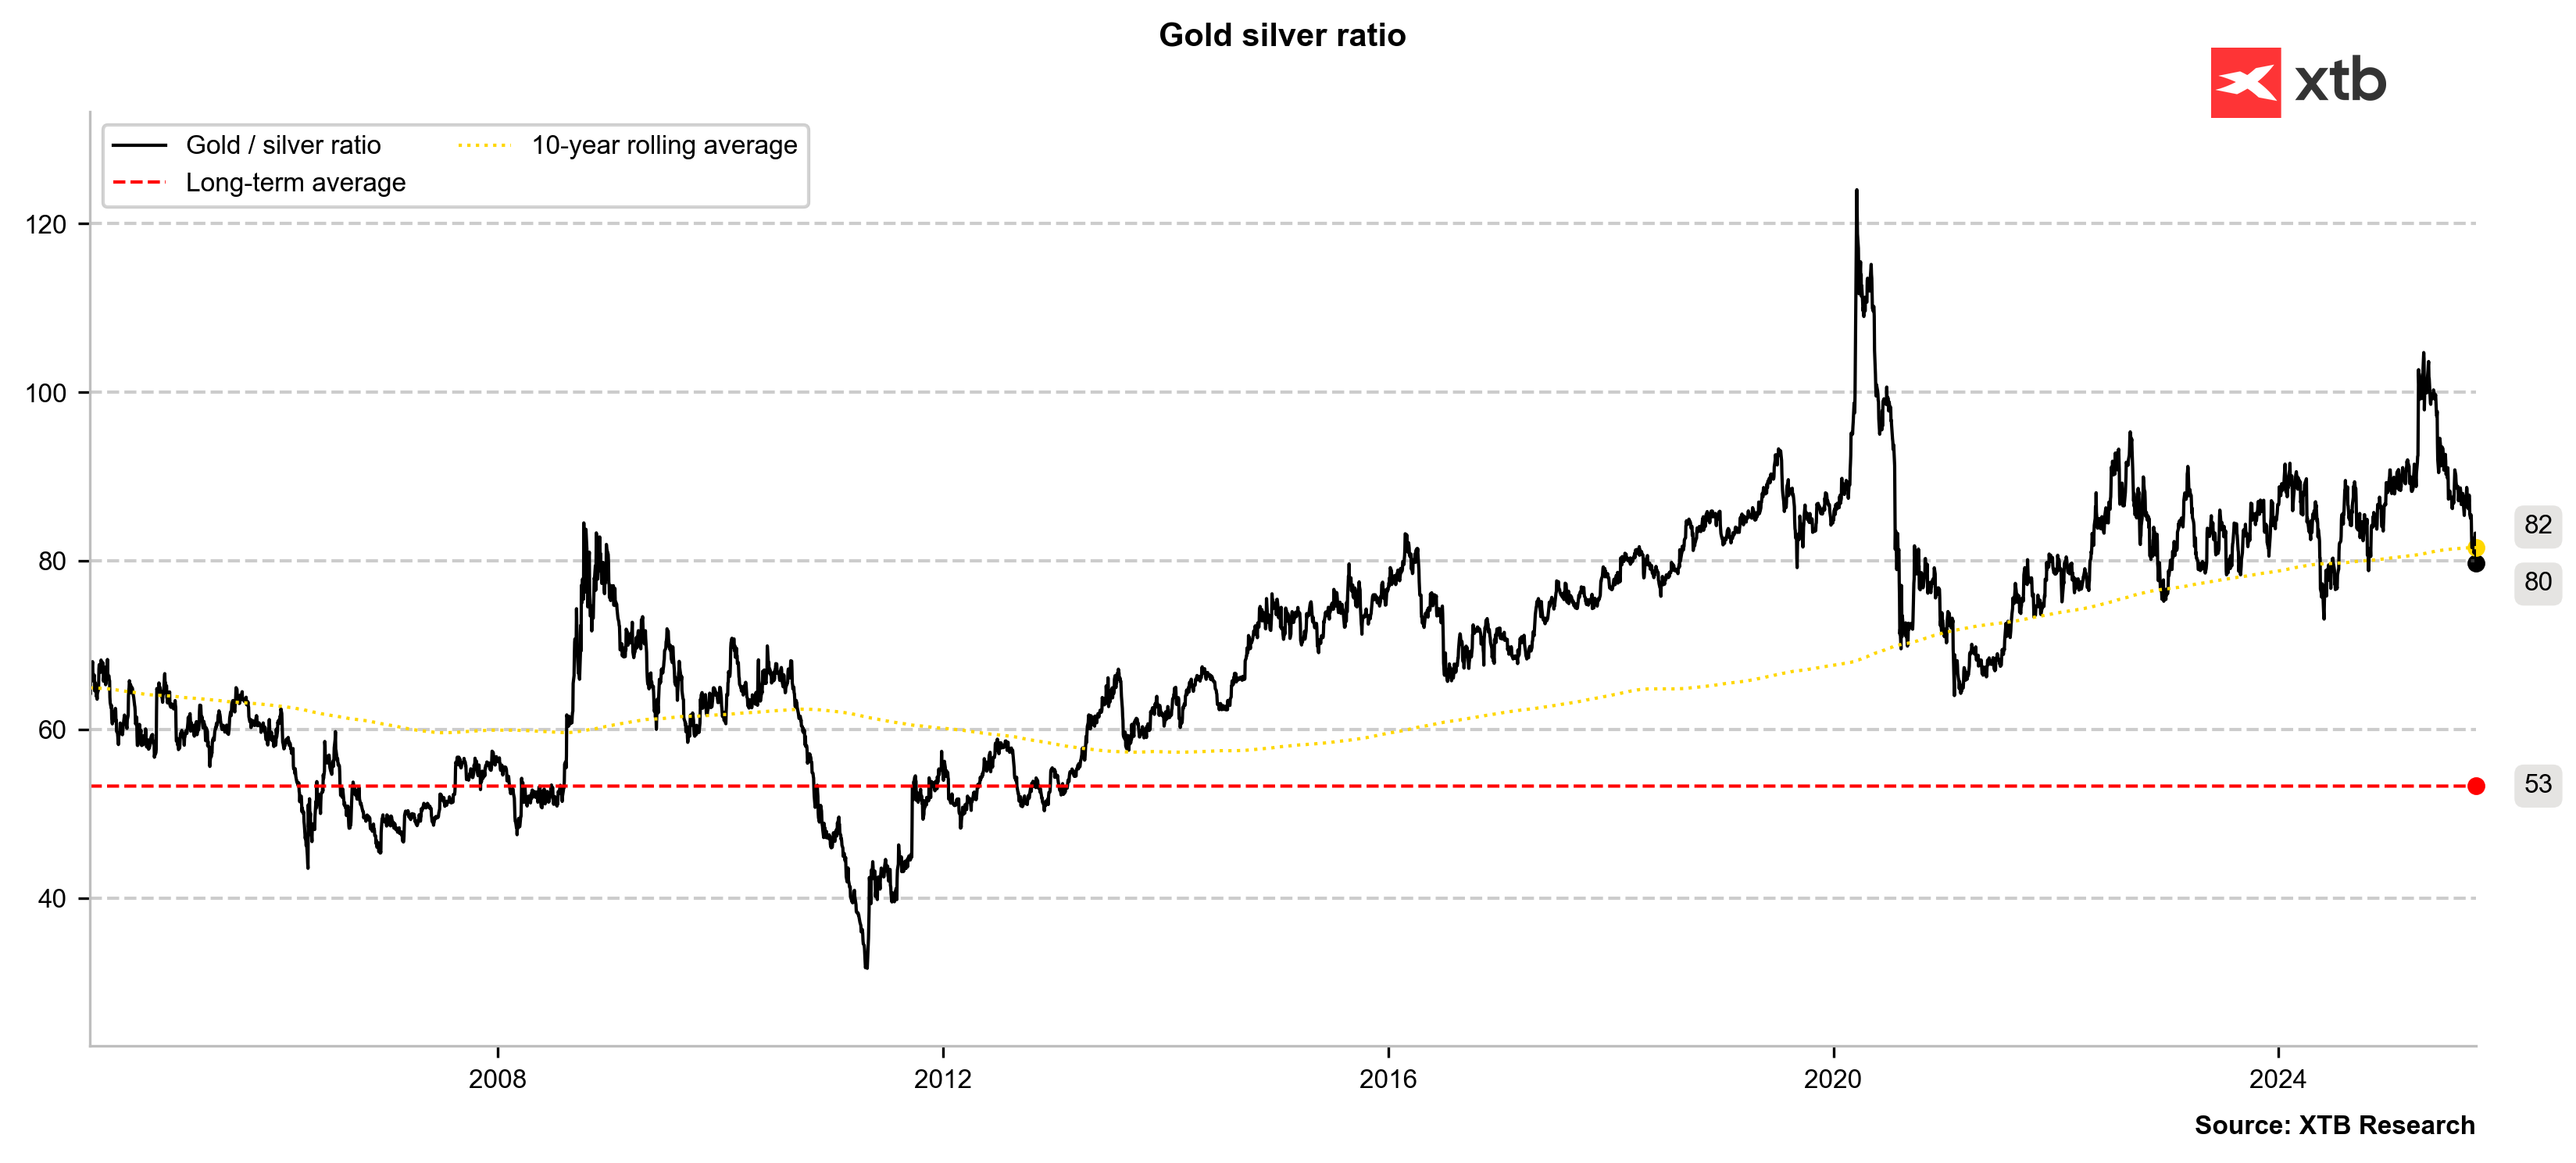
The gold-to-silver ratio is falling below 80 points, which, if the precious metals rally continues, may signal an extremely bullish outlook for silver. However, as has been the case over the past four years, it could also be a short-term indicator of silver overvaluation. Source: Bloomberg Finance LP, XTB
Outlook and Key Levels
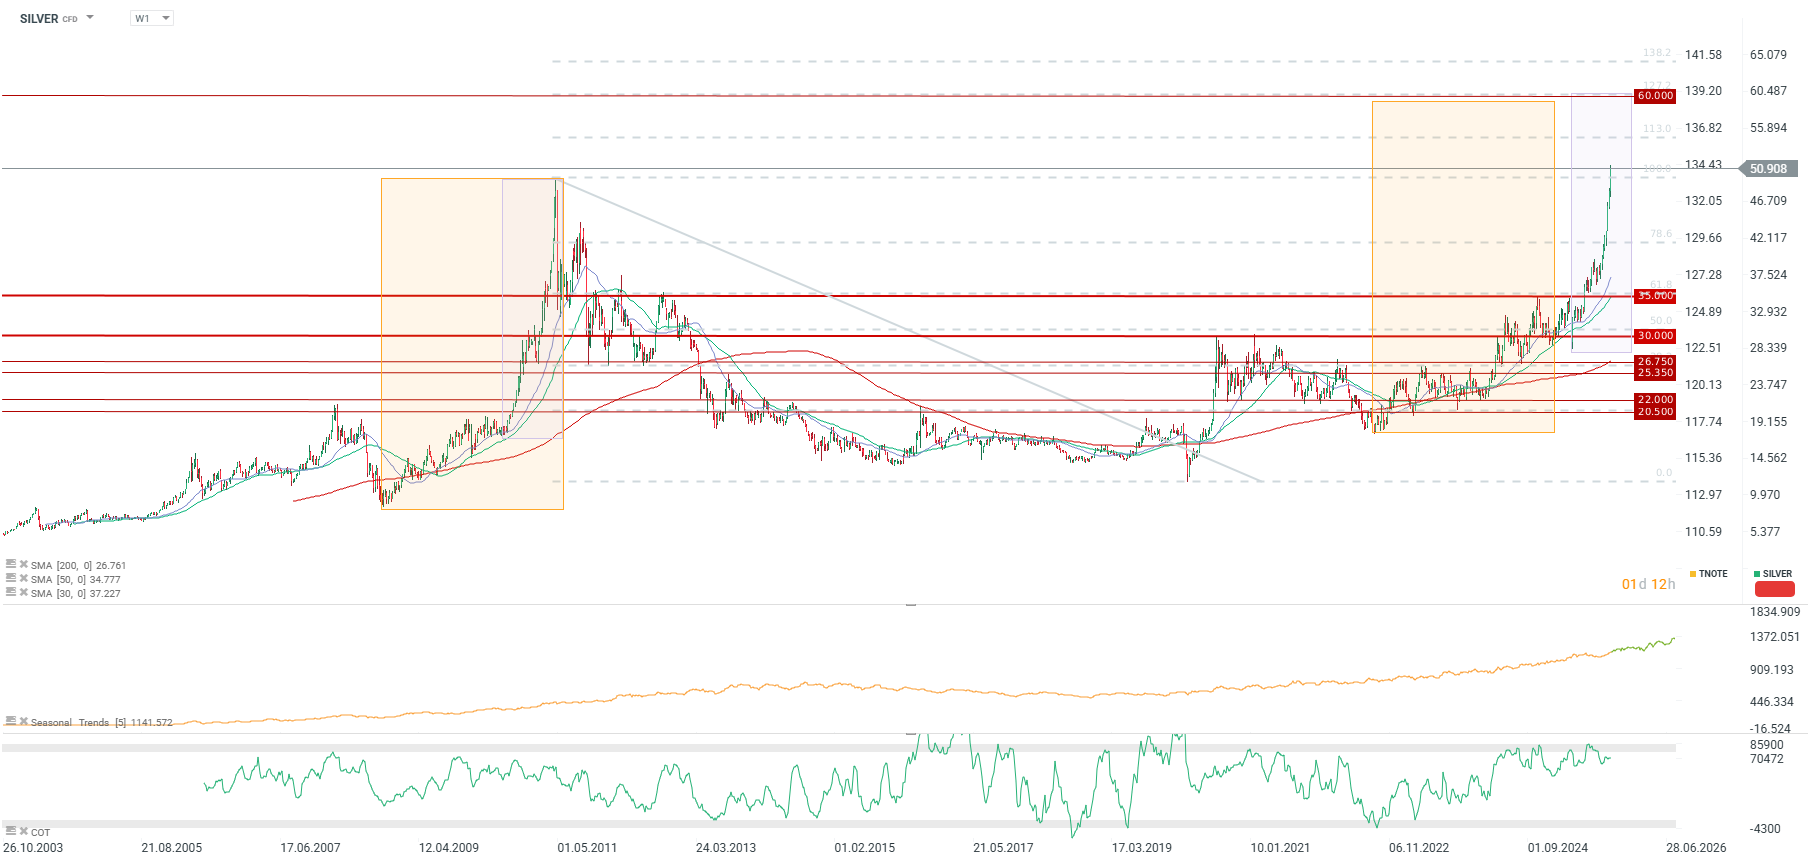
Silver is up over 4%, nearly matching yesterday's session records. Assuming the silver bull run is not over, the strong movement ranges from 2011 imply potential targets of $59–$60 for the metal. The nearest strong resistance, based on the 113% Fibonacci extension, is around $55 per ounce. In the event of a correction, support should be sought near $45 per ounce, which aligns with the 23.6% retracement of the entire uptrend wave that began in April and may be culminating near current levels.

Daily summary: The US celebrates Independence Day, Europe rebounds

Three Markets to Watch Next Week: OIL, US100, NZDUSD (03.07.2026)

US OPEN: America Celebrates, Futures Rise

Market wrap: European stocks on the rise 📈 ASML powers chip stocks while defense sector pulls back
The content of this report has been created by XTB S.A., with its registered office in Warsaw, at Prosta 67, 00-838 Warsaw, Poland, (KRS number 0000217580) and supervised by Polish Supervision Authority ( No. DDM-M-4021-57-1/2005). This material is a marketing communication within the meaning of Art. 24 (3) of Directive 2014/65/EU of the European Parliament and of the Council of 15 May 2014 on markets in financial instruments and amending Directive 2002/92/EC and Directive 2011/61/EU (MiFID II). Marketing communication is not an investment recommendation or information recommending or suggesting an investment strategy within the meaning of Regulation (EU) No 596/2014 of the European Parliament and of the Council of 16 April 2014 on market abuse (market abuse regulation) and repealing Directive 2003/6/EC of the European Parliament and of the Council and Commission Directives 2003/124/EC, 2003/125/EC and 2004/72/EC and Commission Delegated Regulation (EU) 2016/958 of 9 March 2016 supplementing Regulation (EU) No 596/2014 of the European Parliament and of the Council with regard to regulatory technical standards for the technical arrangements for objective presentation of investment recommendations or other information recommending or suggesting an investment strategy and for disclosure of particular interests or indications of conflicts of interest or any other advice, including in the area of investment advisory, within the meaning of the Trading in Financial Instruments Act of 29 July 2005 (i.e. Journal of Laws 2019, item 875, as amended). The marketing communication is prepared with the highest diligence, objectivity, presents the facts known to the author on the date of preparation and is devoid of any evaluation elements. The marketing communication is prepared without considering the client’s needs, his individual financial situation and does not present any investment strategy in any way. The marketing communication does not constitute an offer of sale, offering, subscription, invitation to purchase, advertisement or promotion of any financial instruments. XTB S.A. is not liable for any client’s actions or omissions, in particular for the acquisition or disposal of financial instruments, undertaken on the basis of the information contained in this marketing communication. In the event that the marketing communication contains any information about any results regarding the financial instruments indicated therein, these do not constitute any guarantee or forecast regarding the future results.