
GOLD
Let’s start today’s analysis with the gold market after precious metal failed to break above the $1,810 handle last week. This resistance area was a result of 78.6% Fibonacci retracement of the downward impulse started at the beginning of September as well as previous price reactions. Gold has pulled back from this zone twice, which may herald a deepening of a downward correction. Should the price stay below the local resistance at $1,798, the next potential target for sellers could be $1,773.7 support, where a lower limit of 1:1 structure as well as lower limit of upward channel can be found. On the other hand, according to the Overbalance methodology, bouncing off this support ($1,774.7) may herald a resumption of the upward move.
 GOLD H4 interval. Source: xStation5
US100
Next, let’s move to the US tech index chart - Nasdaq (US100). Looking at the D1 interval, one can see that buyers manage to erase the whole downward correction that started in early September. However, shortly after reaching the 15,700 pts resistance near record highs, sellers arrived and the shooting star formation was painted on the chart. This candlestick pattern usually heralds a trend reversal, so buyers should stay on guard. Considering the bearish scenario, the nearest key support - in the 15,280 pts area - could be at risk. The area marked with green colour on the chart below is a result of previous price reactions, as well as local 1:1 structure. If buyers manage to hold the price above the 15,280 pts support, another attack on 15,700 pts may be launched. On the other hand, should sellers manage to break below 15,280 pts area, a bigger sell-off may occur.
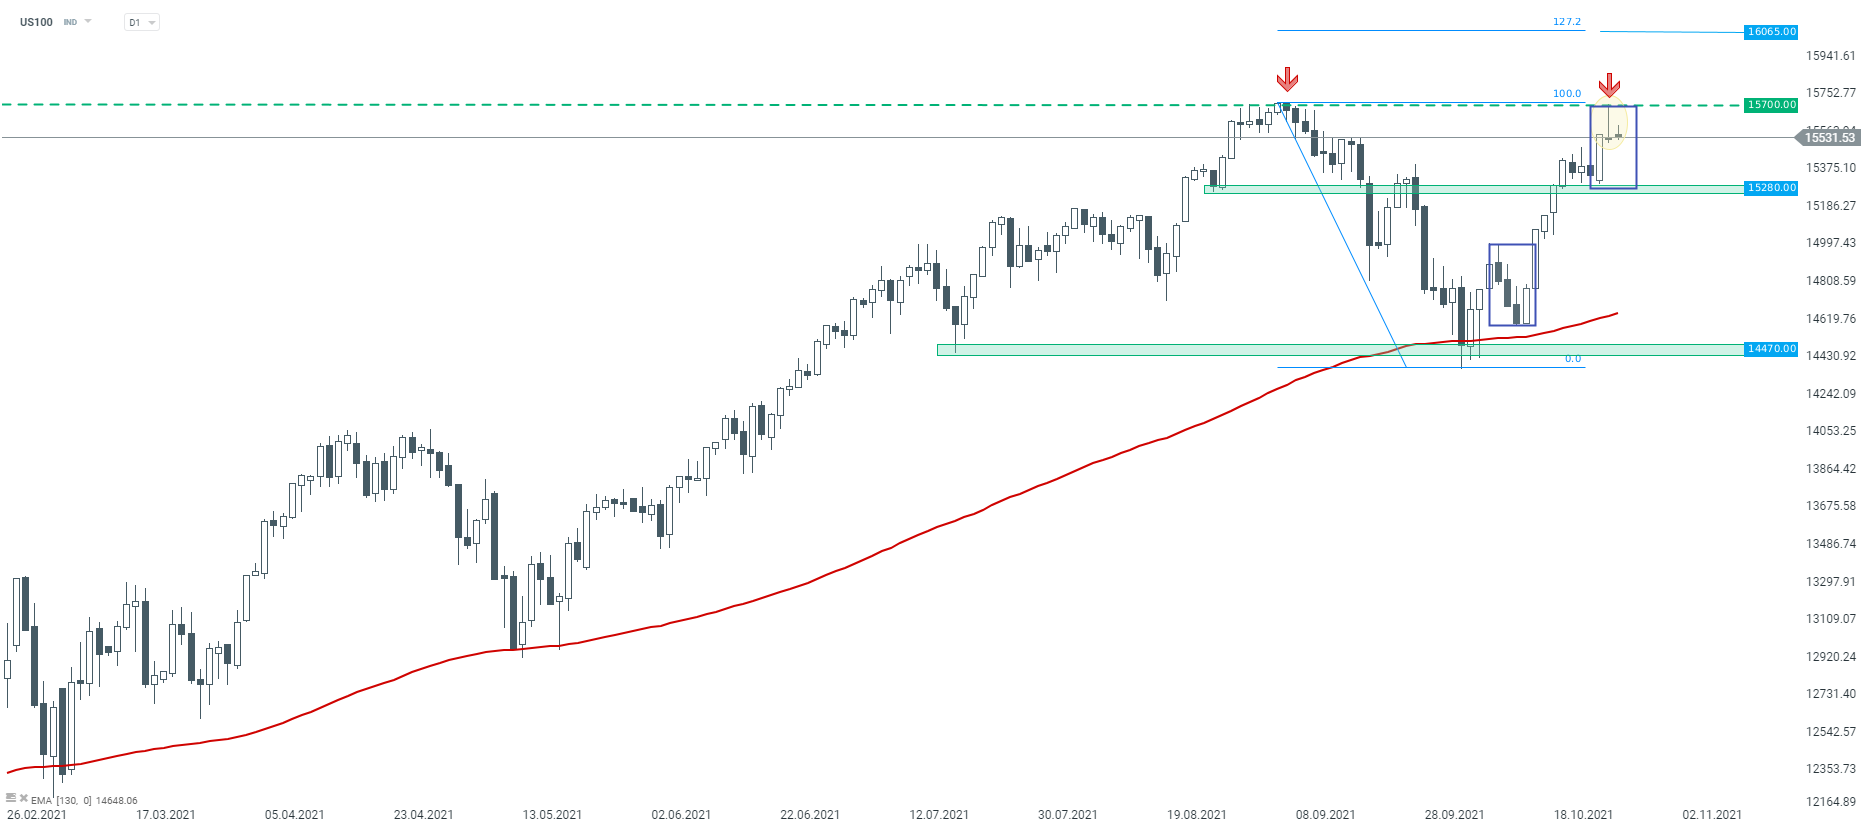 US100 D1 interval. Source: xStation5
DE30
Last but not least, let’s take a look at the German index - DAX (DE30). Looking at the D1 interval, one can see that buyers regained control on this market. The price has broken above the local upward channel and after a short sideways move, index pushed higher. However, the upward move was halted at the key horizontal resistance area at 15,770 pts. The zone marked with red color is crucial for now - in case of a berak higher, the upward move may quickly reach all time highs near 16,000 pts. On the other hand, should the price stay below the aforementioned resistance, the downward correction may deepen. In such a scenario, the earlier broken area at 15,450 pts is considered to be the first key support.
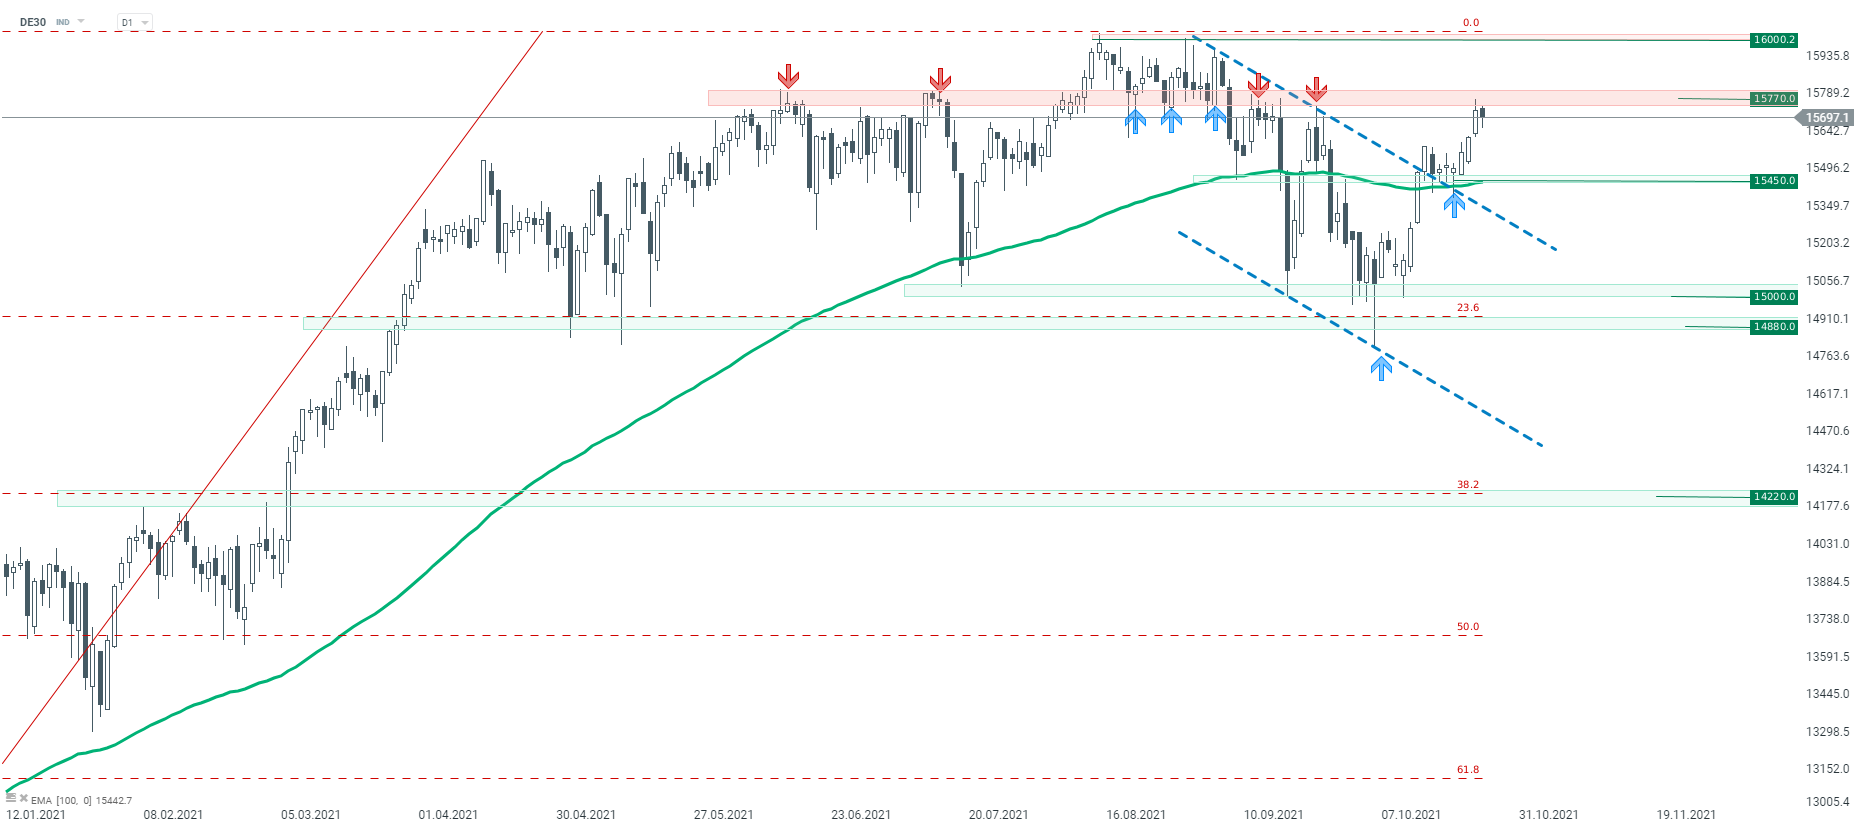 DE30 D1 interval. Source: xStation5

Daily Summary: Equities Diverge as Tech Lags, Europe Rallies on Earnings & PMIs (24.07.2026)

Three markets to watch next week (24.07.2026)

Oil Slides Ahead of the Weekend!

US OPEN: Nasdaq hits 1-month low! Geopolitics bring AI trade down!
The content of this report has been created by XTB S.A., with its registered office in Warsaw, at Prosta 67, 00-838 Warsaw, Poland, (KRS number 0000217580) and supervised by Polish Supervision Authority ( No. DDM-M-4021-57-1/2005). This material is a marketing communication within the meaning of Art. 24 (3) of Directive 2014/65/EU of the European Parliament and of the Council of 15 May 2014 on markets in financial instruments and amending Directive 2002/92/EC and Directive 2011/61/EU (MiFID II). Marketing communication is not an investment recommendation or information recommending or suggesting an investment strategy within the meaning of Regulation (EU) No 596/2014 of the European Parliament and of the Council of 16 April 2014 on market abuse (market abuse regulation) and repealing Directive 2003/6/EC of the European Parliament and of the Council and Commission Directives 2003/124/EC, 2003/125/EC and 2004/72/EC and Commission Delegated Regulation (EU) 2016/958 of 9 March 2016 supplementing Regulation (EU) No 596/2014 of the European Parliament and of the Council with regard to regulatory technical standards for the technical arrangements for objective presentation of investment recommendations or other information recommending or suggesting an investment strategy and for disclosure of particular interests or indications of conflicts of interest or any other advice, including in the area of investment advisory, within the meaning of the Trading in Financial Instruments Act of 29 July 2005 (i.e. Journal of Laws 2019, item 875, as amended). The marketing communication is prepared with the highest diligence, objectivity, presents the facts known to the author on the date of preparation and is devoid of any evaluation elements. The marketing communication is prepared without considering the client’s needs, his individual financial situation and does not present any investment strategy in any way. The marketing communication does not constitute an offer of sale, offering, subscription, invitation to purchase, advertisement or promotion of any financial instruments. XTB S.A. is not liable for any client’s actions or omissions, in particular for the acquisition or disposal of financial instruments, undertaken on the basis of the information contained in this marketing communication. In the event that the marketing communication contains any information about any results regarding the financial instruments indicated therein, these do not constitute any guarantee or forecast regarding the future results.