



U.S. index futures are attempting to rebound, led by the Dow Jones Industrial Average (US30), which is up nearly 1%, and the Russell 2000 (US2000), the index most sensitive to changes in U.S. yields and interest rates, which is gaining around 0.8%. U.S. Treasury yields have pulled back slightly after their recent sharp rise, providing some relief to equity indices.
The U.S. 4-week Treasury bill auction was solid: the bid-to-cover ratio rose to 2.56 from 2.40, pointing to clearly stronger investor demand despite as much as $110 billion of debt being sold. The stop-out yield came in at 4.% versus 3.98% previously, meaning financing costs increased slightly, but given such strong auction coverage, the data do not suggest any difficulties in absorbing short-term U.S. government debt.
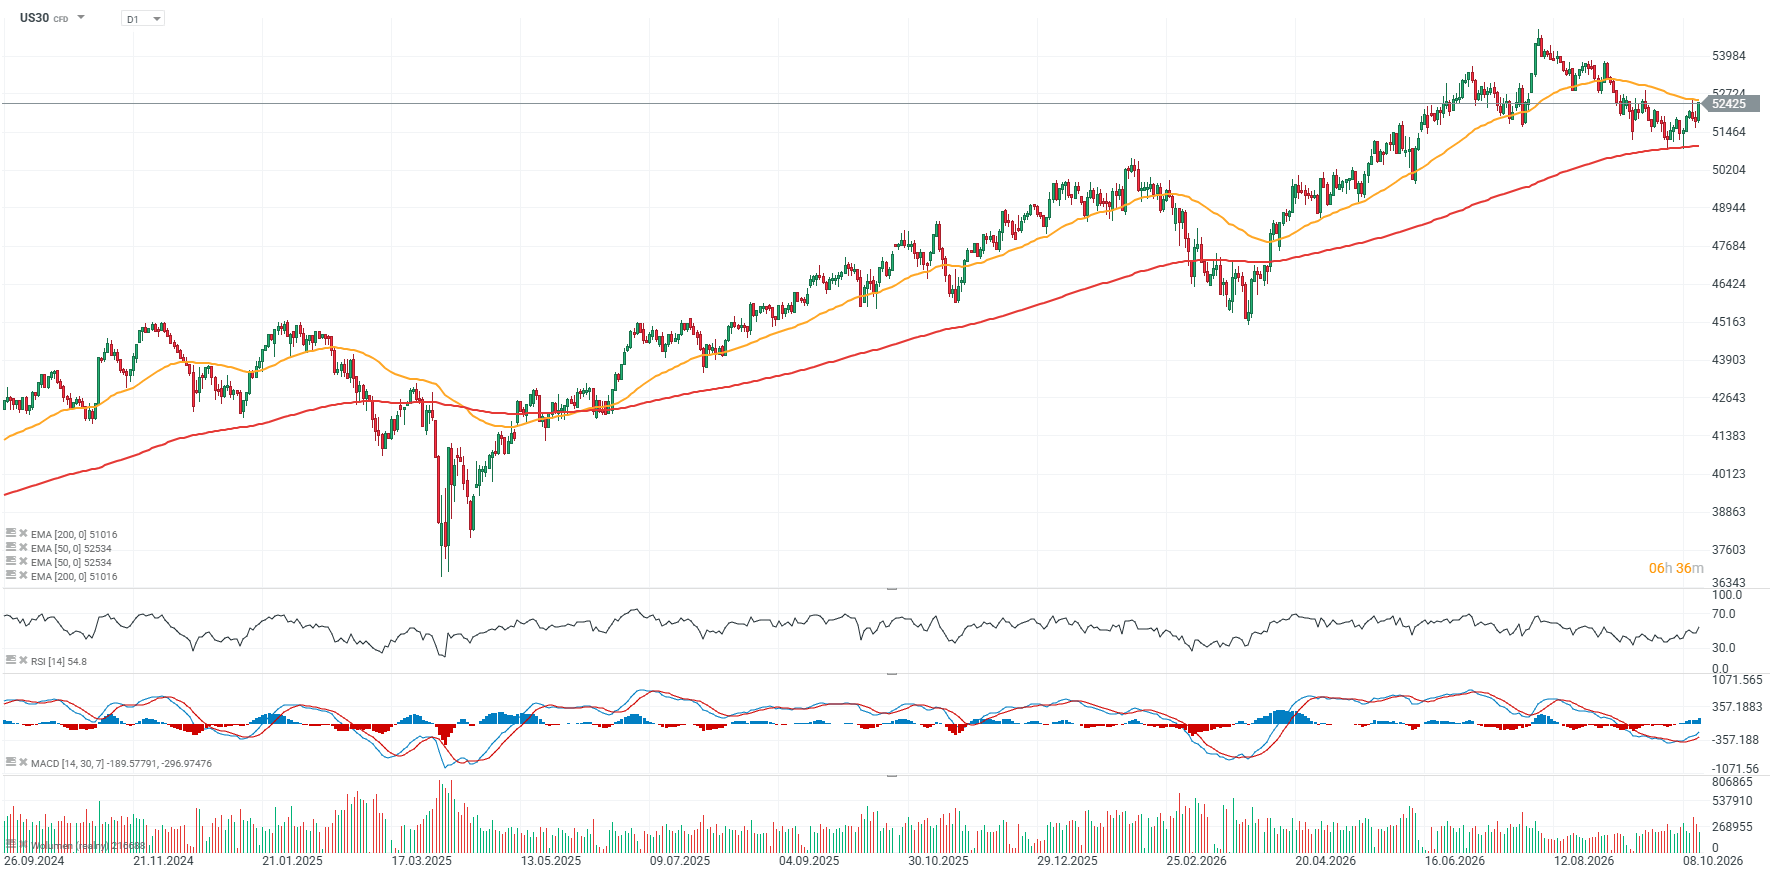
US30 (D1 interval)
The DJIA futures contract is approaching the 50-session exponential moving average, EMA50 (orange line). In recent days, the benchmark came close to testing the key EMA200 support level (red line), but that support held and bulls are now attempting to regain control and restore upward momentum. The absence of companies focused exclusively on AI and the relatively limited weighting of semiconductor stocks act as a stabilising factor for the benchmark amid the ongoing sell-off in the technology sector.
Source: xStation5
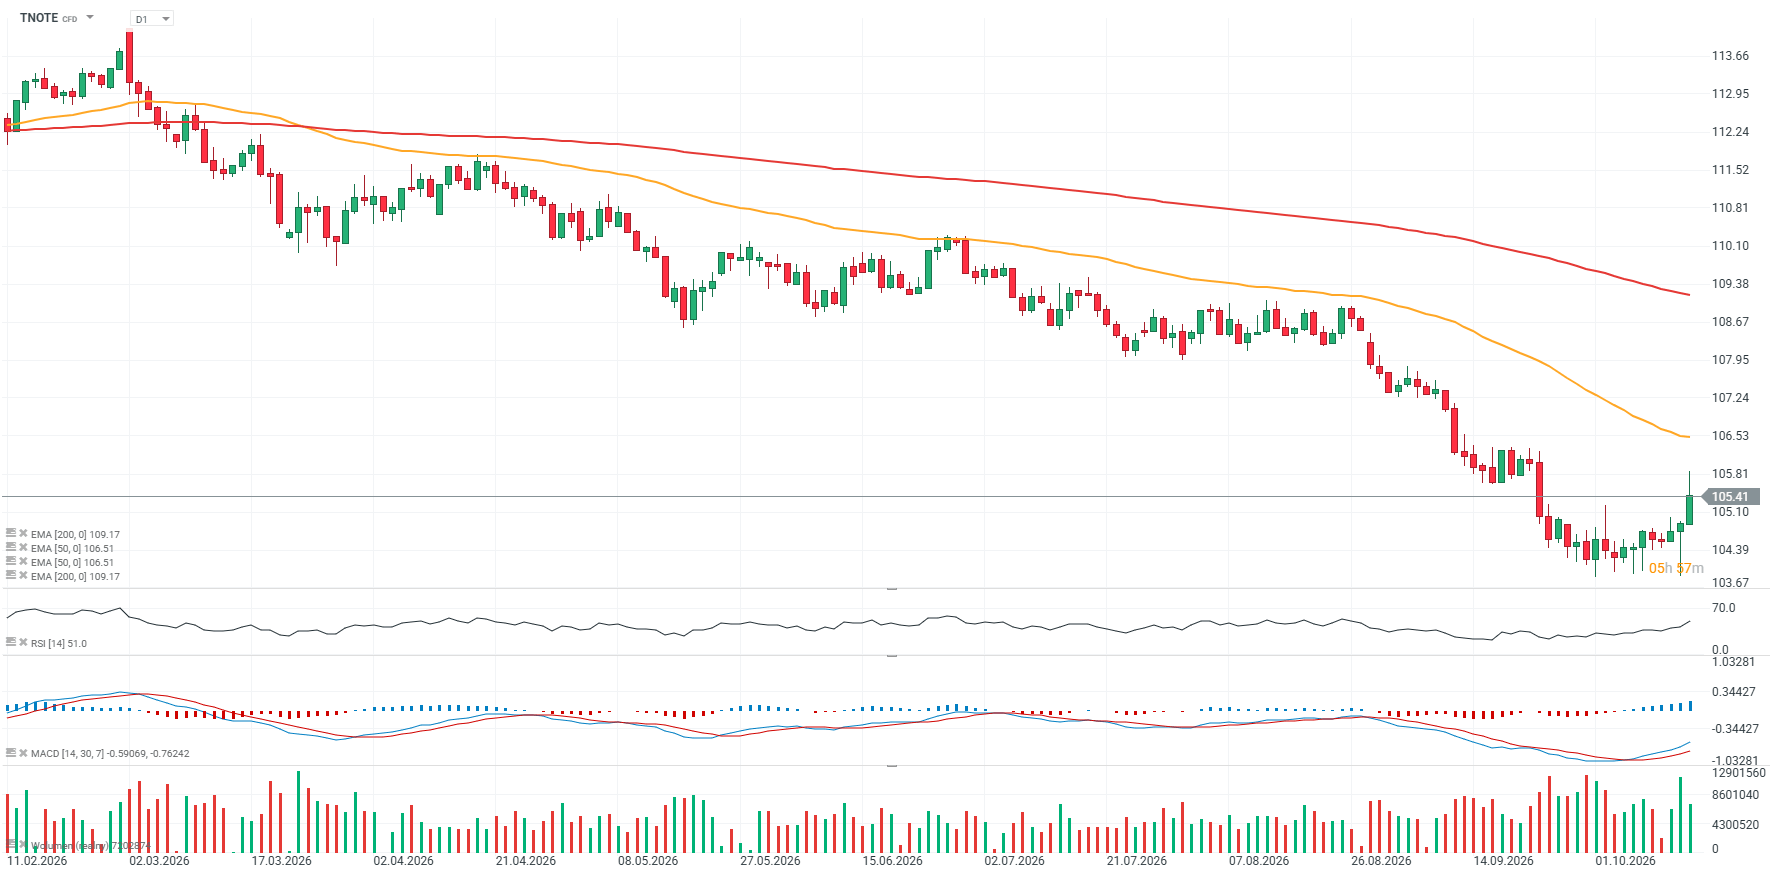
The rise in U.S. 10-year Treasury futures confirms that yields are giving back some of their recent gains and retreating from record levels. Today, the yield on the U.S. 10-year Treasury stands at 5.1%, compared with around 5.3% observed several hours earlier.
 Source: xStation5
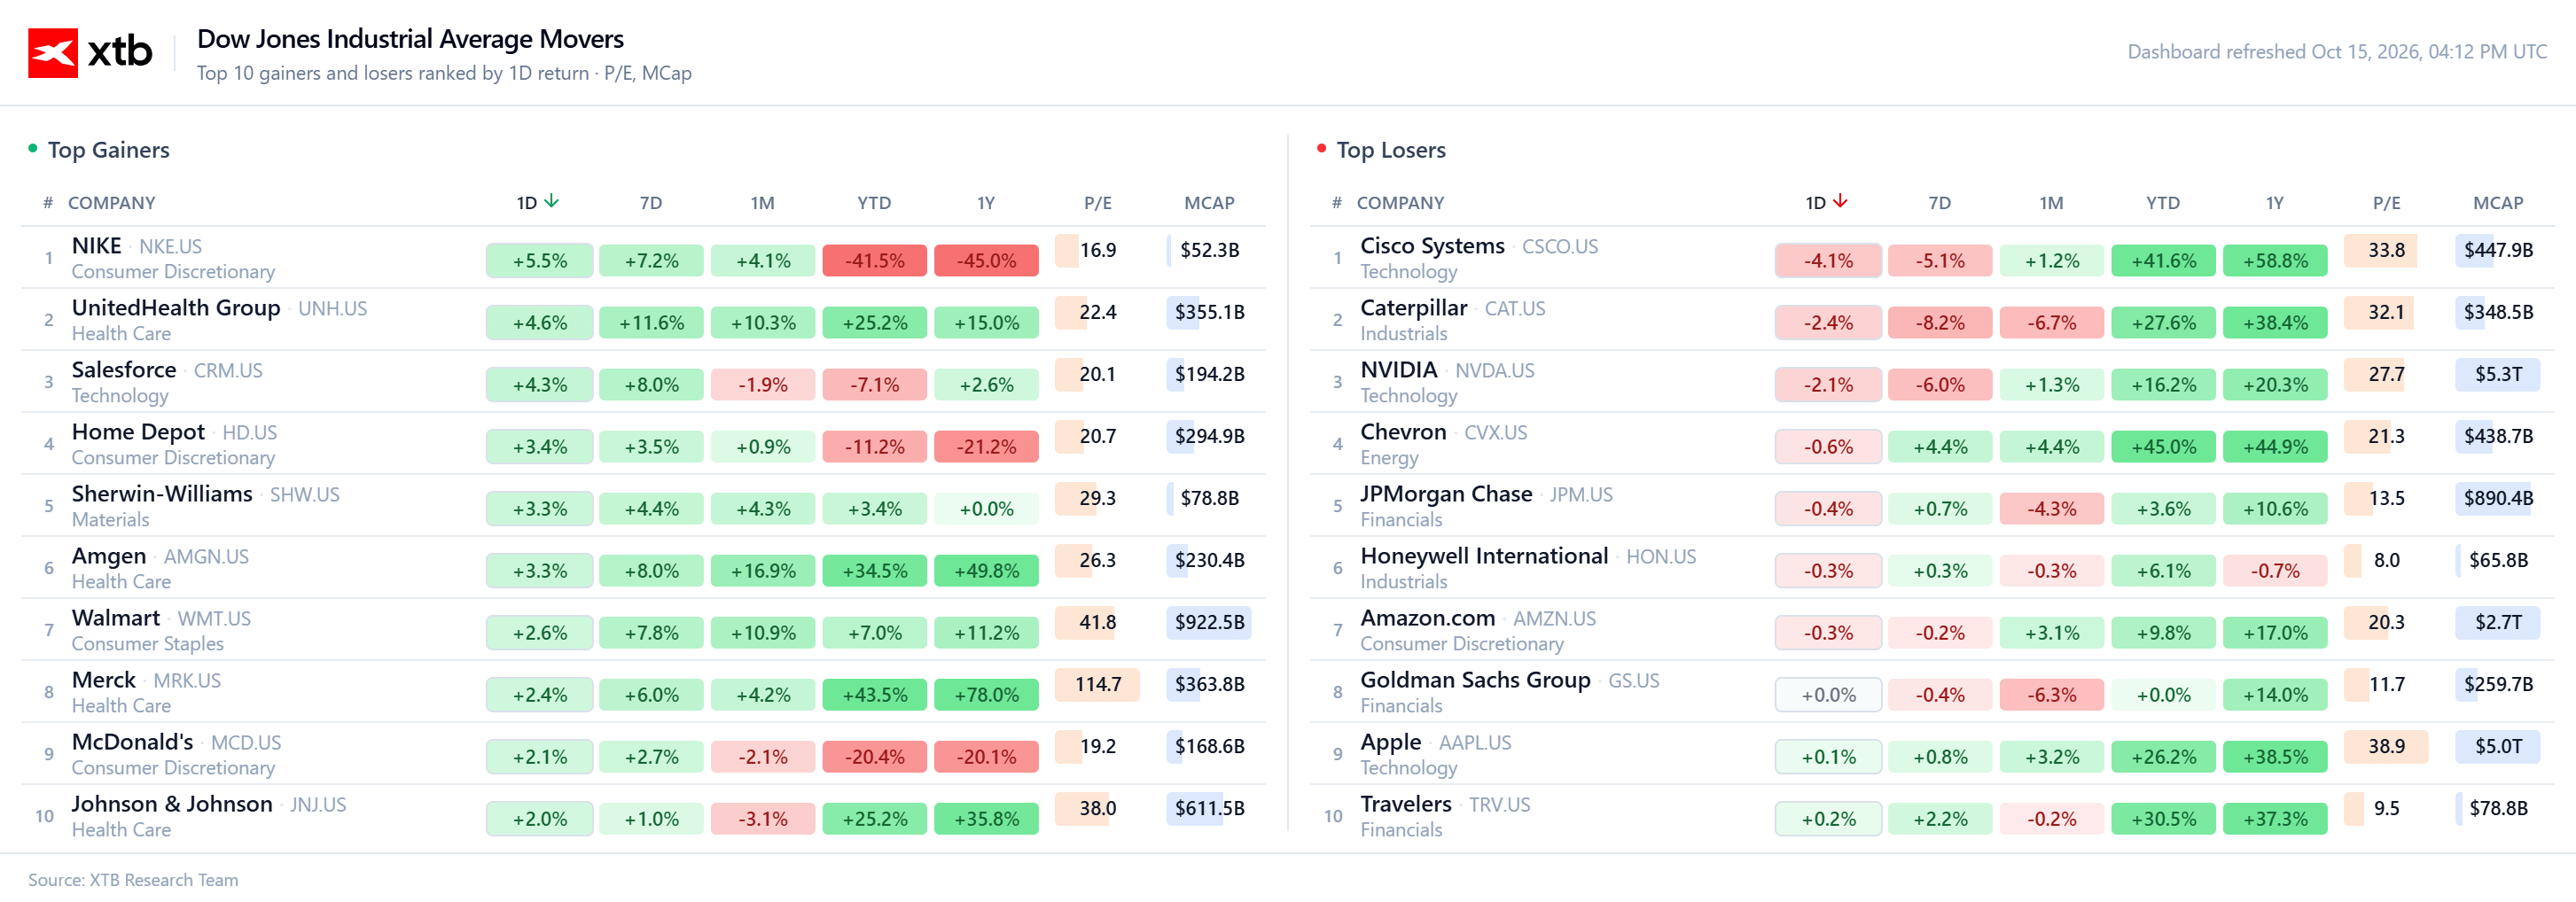
Today’s Dow Jones performance shows a clear rotation toward more defensive and consumer-oriented stocks, while pressure remains concentrated in parts of the technology and industrial sectors. Nike leads the gains, rising around 5.5%, although the scale of the earlier sell-off remains substantial, with the stock still down about 41.5% YTD and 45% over the past year. UnitedHealth (+4.6%), Salesforce (+4.3%) and Home Depot (+3.4%) are also posting strong gains, suggesting that the rebound is not limited to a single sector. On the downside, Cisco stands out with a 4.1% decline, while NVIDIA is down around 2.1%, despite still being up roughly 16.2% year-to-date and remaining one of the biggest beneficiaries of the structural AI trend. Valuations also vary significantly across the index: JPMorgan and Goldman Sachs trade at P/E ratios of around 13.5x and 11.7x, respectively, while Walmart trades at approximately 41.8x. Overall, today’s session points less to a broad trend reversal in the Dow Jones and more to a short-term rotation of capital between sectors and companies with very different growth profiles, valuations and sensitivity to interest rates.
Source: XTB
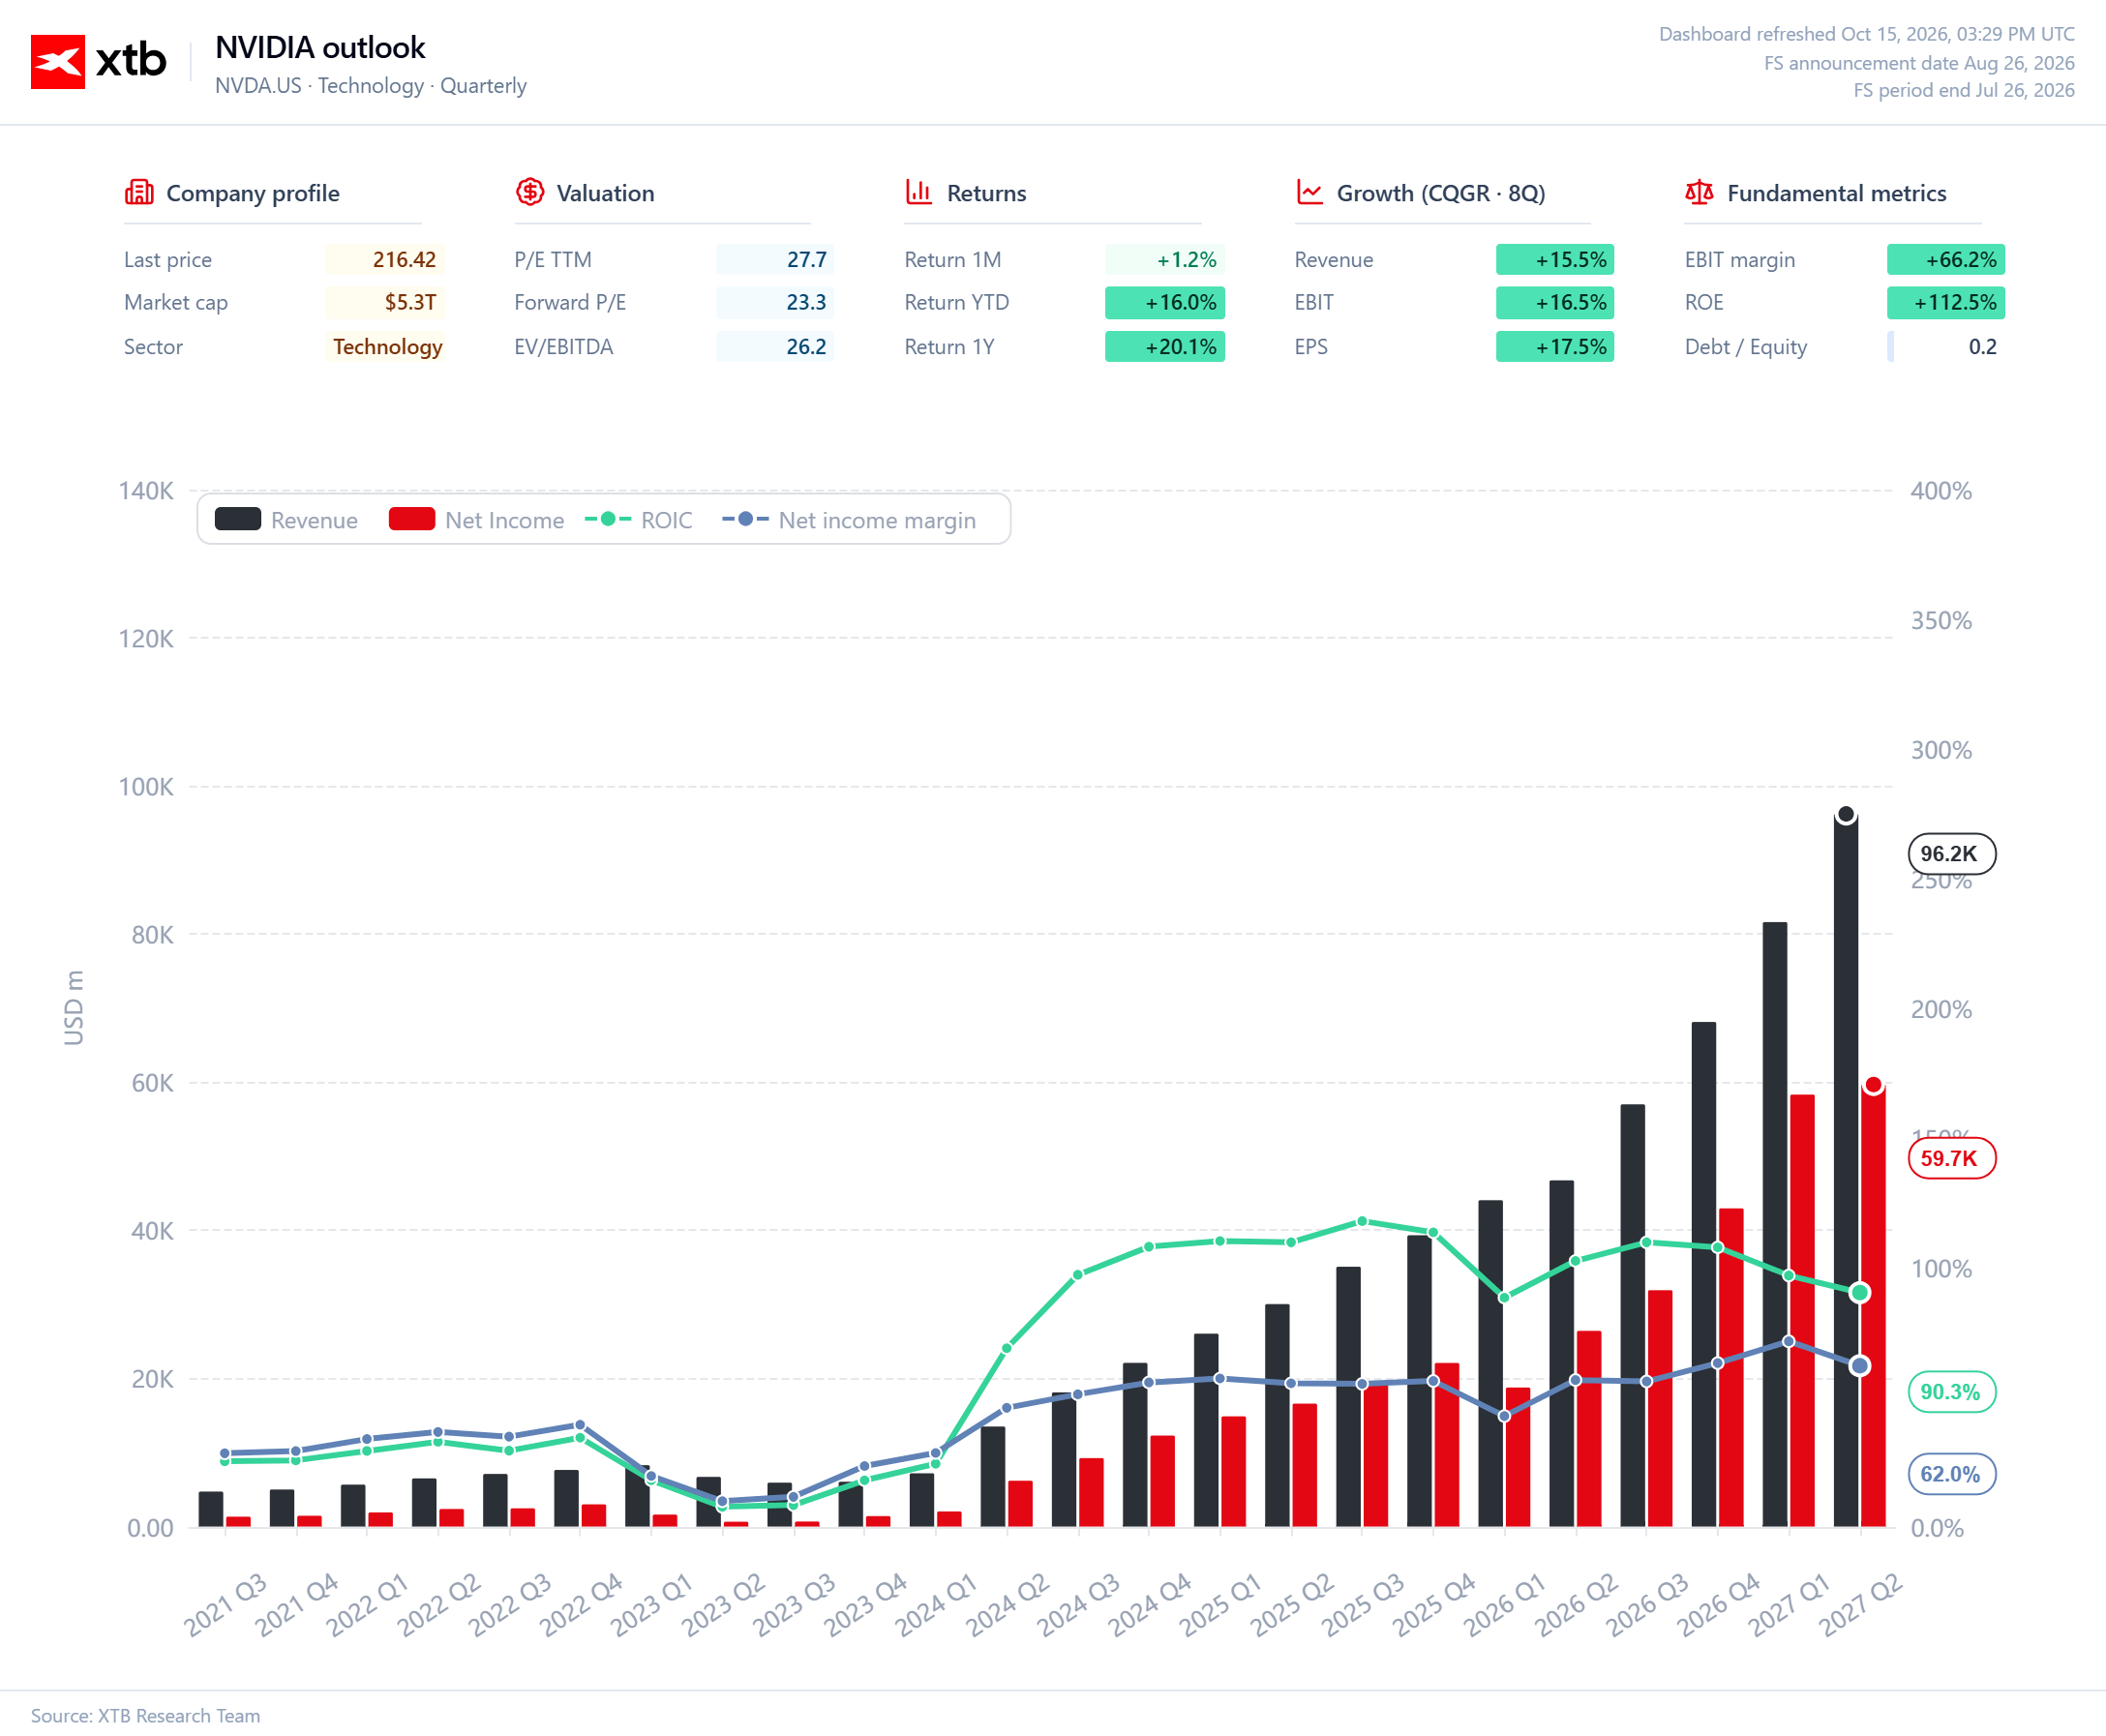
Looking at the leading stock of the AI bull market in recent years, we can see that revenue growth has been accompanied by an even faster increase in profits and exceptionally high capital efficiency. Quarterly revenue rose to approximately $96.2 billion, while net income reached nearly $59.7 billion, implying a net margin of around 62% — an extraordinarily high level even by the standards of the most profitable technology companies. At the same time, ROIC stands at around 90.3%, suggesting that NVIDIA continues to generate returns on incremental capital many times higher than the typical cost of capital for a large technology company; this spread between ROIC and WACC remains one of the key sources of its valuation.
Importantly, this level of profitability has not been achieved through aggressive leverage. Debt/Equity stands at just 0.2x, meaning NVIDIA’s growth model is financially far more resilient to higher interest rates than that of infrastructure-heavy companies that rely more heavily on debt-financed expansion. Momentum also remains strong: the CAGR over the past eight quarters is approximately 15.5% for revenue, 16.5% for EBIT and 17.5% for EPS, indicating that earnings are still growing somewhat faster than sales.
With a market capitalisation of around $5.3 trillion and valuation multiples of approximately 27.7x earnings, 23.3x price-to-12-month forward earnings and 26.2x EV/EBITDA, the market is clearly paying a premium for quality. However, that valuation is backed by real profitability and cash flows generated by the business rather than solely by a distant promise of future earnings. The main fundamental risk today is therefore not NVIDIA’s ability to generate profits itself, but rather the potential normalisation of margins and ROIC. Even if revenue continues to grow, a material decline in returns on capital could reduce the value created by each additional dollar of reinvestment and make current valuation multiples more difficult to justify.
 Source: XTB


US Open: Nasdaq 100 extends losses 🚩 AI stocks under pressure, CoreWeave falls 8%


Hot inflation data from the US🔥📈 PPI and retail sales are rising!


Nickel market panic 🚩 INSG revises forecast, surplus in 2027?



Market Wrap: Tech Sell-Off Hits Europe, Gold Shines Again
The content of this report has been created by XTB S.A., with its registered office in Warsaw, at Prosta 67, 00-838 Warsaw, Poland, (KRS number 0000217580) and supervised by Polish Supervision Authority ( No. DDM-M-4021-57-1/2005). This material is a marketing communication within the meaning of Art. 24 (3) of Directive 2014/65/EU of the European Parliament and of the Council of 15 May 2014 on markets in financial instruments and amending Directive 2002/92/EC and Directive 2011/61/EU (MiFID II). Marketing communication is not an investment recommendation or information recommending or suggesting an investment strategy within the meaning of Regulation (EU) No 596/2014 of the European Parliament and of the Council of 16 April 2014 on market abuse (market abuse regulation) and repealing Directive 2003/6/EC of the European Parliament and of the Council and Commission Directives 2003/124/EC, 2003/125/EC and 2004/72/EC and Commission Delegated Regulation (EU) 2016/958 of 9 March 2016 supplementing Regulation (EU) No 596/2014 of the European Parliament and of the Council with regard to regulatory technical standards for the technical arrangements for objective presentation of investment recommendations or other information recommending or suggesting an investment strategy and for disclosure of particular interests or indications of conflicts of interest or any other advice, including in the area of investment advisory, within the meaning of the Trading in Financial Instruments Act of 29 July 2005 (i.e. Journal of Laws 2019, item 875, as amended). The marketing communication is prepared with the highest diligence, objectivity, presents the facts known to the author on the date of preparation and is devoid of any evaluation elements. The marketing communication is prepared without considering the client’s needs, his individual financial situation and does not present any investment strategy in any way. The marketing communication does not constitute an offer of sale, offering, subscription, invitation to purchase, advertisement or promotion of any financial instruments. XTB S.A. is not liable for any client’s actions or omissions, in particular for the acquisition or disposal of financial instruments, undertaken on the basis of the information contained in this marketing communication. In the event that the marketing communication contains any information about any results regarding the financial instruments indicated therein, these do not constitute any guarantee or forecast regarding the future results.