
U.S. bank stocks kicked off earnings season on Wall Street today and are trading lower, despite all institutions delivering very solid results, reporting earnings per share significantly above expectations. Revenues also beat Wall Street forecasts. However, the market is pricing in a series of interest rate cuts in 2026, and possibly even a first cut later this year, which leads investors to react somewhat cautiously to the current figures. They see them as difficult to sustain in the medium term if rates decline, reducing lenders' profitability. As for now, strong bank earnings reports suggest profit-taking in pre-market hours.
JPMorgan (JPM.US) Q2 2025 Earnings
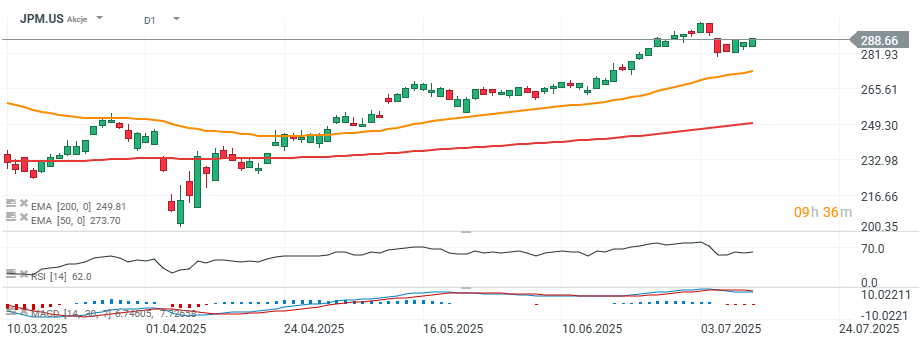
Not only did JPMorgan deliver a strong report, but even its significantly higher forecast for net interest income failed to lift shares of the largest U.S. bank. Before the U.S. market open, the stock is down around 1%, although the final market reaction will become clearer once the session begins.
-
Earnings per share (EPS): $5.24 vs Est. $4.47
-
Adjusted revenue: $45.68B vs Est. $44.05B
-
Provision for credit losses: $2.85B, Est. $3.22B
-
Return on equity (ROE): 18%, Est. 15.1%
-
Cash and due from banks: $23.76B, Est. $22.07B
-
Standardized CET1 ratio: 15%, Est. 15.4%
-
Managed net interest income: $23.31B, Est. $23.59B
-
Total deposits: $2.56T, Est. $2.5T
-
Loans: $1.41T, Est. $1.36T
-
Net charge-offs: $2.41B, Est. $2.46B
-
Equities sales & trading revenue: $3.25B, Est. $3.2B
-
Investment banking revenue: $2.68B, Est. $2.16B
-
FICC sales & trading revenue (fixed income, currencies, commodities): $5.69B, Est. $5.22B
-
FY net interest income forecast: approx. $95.5B (previously projected at approx. $94.5B)
Source: xStation5
Wells Fargo (WFC.US) Q2 2025 Earnings
-
Earnings per share (EPS): $1.60 vs Est. $1.41
-
Revenue: $20.82B vs Est. $20.75B
-
Net interest income: $11.71B, Est. $11.83B
-
Non-performing assets (NPA): $7.96B, Est. $8.68B
-
Non-interest expenses: $13.38B, Est. $13.4B
-
Provision for credit losses: $1.01B, Est. $1.16B
-
Total average deposits: $1.33T, Est. $1.35T
-
Investment banking fees: $696M, Est. $703.1M
-
FY net interest income forecast: approx. $47.7B, Est. $47.92B
Citigroup (C.US) Q2 2025 Earnings
-
Earnings per share (EPS): $1.96 vs Est. $1.60
-
Revenue: $21.67B vs Est. $21B
-
Adjusted FY revenue forecast: approx. $84B (previous guidance: $83.1B–$84.1B)
-
FICC sales & trading revenue (fixed income, currencies, commodities): $4.27B, Est. $3.92B
-
Investment banking revenue: $1.92B, Est. $1.65B
-
Equities sales & trading revenue: $1.61B, Est. $1.55B
-
Net interest income: $15.18B, Est. $14.05B

Daily Summary: Equities Diverge as Tech Lags, Europe Rallies on Earnings & PMIs (24.07.2026)

US OPEN: Nasdaq hits 1-month low! Geopolitics bring AI trade down!

Market Wrap: European Stocks Are Trying to Rebound as the Week Comes to an End💡

Alphabet shares are down 22% from their all-time high 🚩 Is Google ready to resume its bull run?
The content of this report has been created by XTB S.A., with its registered office in Warsaw, at Prosta 67, 00-838 Warsaw, Poland, (KRS number 0000217580) and supervised by Polish Supervision Authority ( No. DDM-M-4021-57-1/2005). This material is a marketing communication within the meaning of Art. 24 (3) of Directive 2014/65/EU of the European Parliament and of the Council of 15 May 2014 on markets in financial instruments and amending Directive 2002/92/EC and Directive 2011/61/EU (MiFID II). Marketing communication is not an investment recommendation or information recommending or suggesting an investment strategy within the meaning of Regulation (EU) No 596/2014 of the European Parliament and of the Council of 16 April 2014 on market abuse (market abuse regulation) and repealing Directive 2003/6/EC of the European Parliament and of the Council and Commission Directives 2003/124/EC, 2003/125/EC and 2004/72/EC and Commission Delegated Regulation (EU) 2016/958 of 9 March 2016 supplementing Regulation (EU) No 596/2014 of the European Parliament and of the Council with regard to regulatory technical standards for the technical arrangements for objective presentation of investment recommendations or other information recommending or suggesting an investment strategy and for disclosure of particular interests or indications of conflicts of interest or any other advice, including in the area of investment advisory, within the meaning of the Trading in Financial Instruments Act of 29 July 2005 (i.e. Journal of Laws 2019, item 875, as amended). The marketing communication is prepared with the highest diligence, objectivity, presents the facts known to the author on the date of preparation and is devoid of any evaluation elements. The marketing communication is prepared without considering the client’s needs, his individual financial situation and does not present any investment strategy in any way. The marketing communication does not constitute an offer of sale, offering, subscription, invitation to purchase, advertisement or promotion of any financial instruments. XTB S.A. is not liable for any client’s actions or omissions, in particular for the acquisition or disposal of financial instruments, undertaken on the basis of the information contained in this marketing communication. In the event that the marketing communication contains any information about any results regarding the financial instruments indicated therein, these do not constitute any guarantee or forecast regarding the future results.