
US500 is trying to stabilize after recent declines, making it a good moment to take stock of the Q4 2025 earnings season. US corporates are accelerating again, not only in profits but also in top-line growth. From a fundamentals perspective, revenue momentum is at least as important as earnings, because it speaks directly to underlying demand rather than cost or margin effects. The S&P 500’s blended revenue growth rate for Q4 currently stands at 9% y/y, the strongest in three years. If this holds through the end of reporting season, it would mark the index’s highest revenue growth since Q3 2022 (11.0%). Importantly, revenue growth expectations have been revised higher throughout the season.
-
9% y/y: current S&P 500 blended revenue growth for Q4
-
7.8%: estimate as of December 31, 2025
-
6.5%: estimate as of September 30, 2025
-
10 out of 11 sectors are reporting y/y revenue growth
-
Three sectors are posting double-digit revenue growth: Information Technology, Communication Services, Health Care
The biggest contribution comes from four sectors.
Information Technology: Revenue growth increased to 20.6% from 17.9%
Key positive surprises:
-
Apple: $143.76bn vs $138.39bn expected
-
Super Micro Computer: $12.68bn vs $10.42bn expected
-
Microsoft: $81.27bn vs $80.31bn expected
Health Care: Revenue growth increased to 10.3% from 9.0%
Positive surprises:
-
Cigna: $72.50bn vs $70.31bn expected
-
CVS Health: $105.69bn vs $103.70bn expected
-
Eli Lilly: $19.29bn vs $17.94bn expected
-
Centene: $49.73bn vs $48.39bn expected
Communication Services: Revenue growth increased to 12.2% from 10.2%
Key reports:
-
Alphabet: $113.83bn vs $111.32bn expected
-
Meta: $59.89bn vs $58.46bn expected
Industrials: Revenue growth increased to 7.8% from 5.8%
Positive surprises:
-
Boeing: $23.95bn vs $22.60bn expected
-
RTX: $24.24bn vs $22.69bn expected
-
Caterpillar: $19.13bn vs $17.85bn expected
Other notable upside surprises
-
Apollo Global Management: $9.86bn vs $4.77bn expected
-
Phillips 66: $36.33bn vs $33.86bn expected
-
Amazon: $213.39bn vs $211.44bn expected
-
Ford: $45.90bn vs $43.60bn expected
What’s next: forecasts are already cooler
Analysts expect revenue growth to slow through 2026:
-
Q1 2026: 8.7% y/y
-
Q2 2026: 7.9%
-
Q3 2026: 7.3%
-
Q4 2026: 7.4%
US500 (D1 timeframe)
FactSet’s earnings-season data look strong, yet this has not translated into an acceleration in S&P 500 futures. That divergence is somewhat concerning, as it may suggest valuations moved ahead of earnings and stocks are priced to perfection, leaving less room for upside. On the other hand, both earnings and revenue momentum still provide tangible support for the US market’s relatively elevated valuation levels.
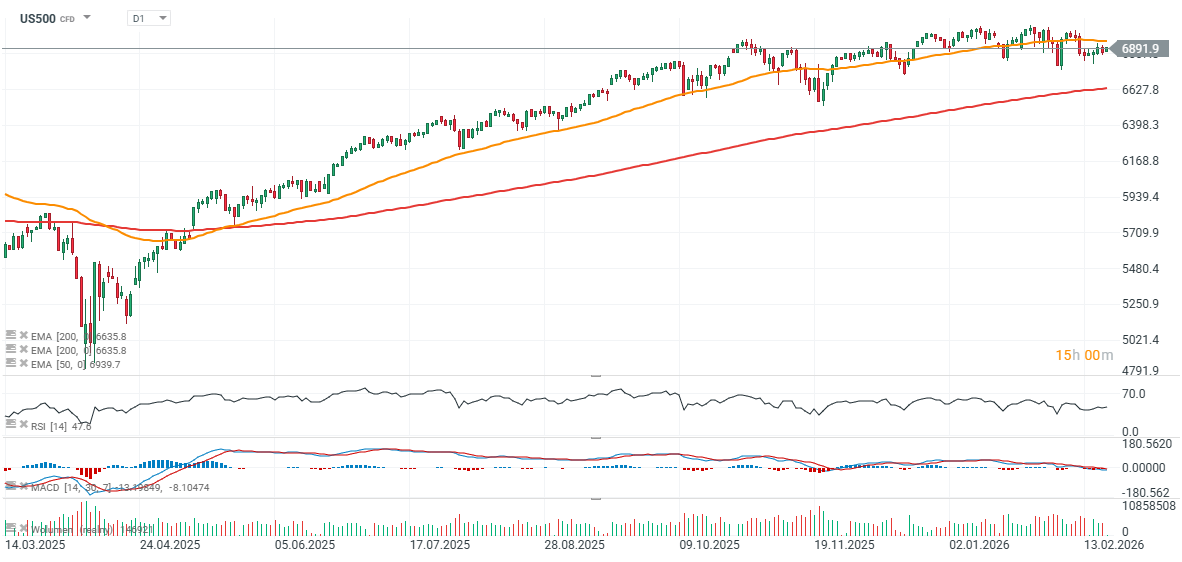
Source: xStation5

Oil gains 3% amid US - Iran escalation and supply disruption on the Black Sea

🔼 Gold gains 1.7%

🛢️Brent Crude Oil Tests $95 per Barrel

Chart of the Day: AI supports gains – can Tesla and Google sustain them? (22.07.2026)
The content of this report has been created by XTB S.A., with its registered office in Warsaw, at Prosta 67, 00-838 Warsaw, Poland, (KRS number 0000217580) and supervised by Polish Supervision Authority ( No. DDM-M-4021-57-1/2005). This material is a marketing communication within the meaning of Art. 24 (3) of Directive 2014/65/EU of the European Parliament and of the Council of 15 May 2014 on markets in financial instruments and amending Directive 2002/92/EC and Directive 2011/61/EU (MiFID II). Marketing communication is not an investment recommendation or information recommending or suggesting an investment strategy within the meaning of Regulation (EU) No 596/2014 of the European Parliament and of the Council of 16 April 2014 on market abuse (market abuse regulation) and repealing Directive 2003/6/EC of the European Parliament and of the Council and Commission Directives 2003/124/EC, 2003/125/EC and 2004/72/EC and Commission Delegated Regulation (EU) 2016/958 of 9 March 2016 supplementing Regulation (EU) No 596/2014 of the European Parliament and of the Council with regard to regulatory technical standards for the technical arrangements for objective presentation of investment recommendations or other information recommending or suggesting an investment strategy and for disclosure of particular interests or indications of conflicts of interest or any other advice, including in the area of investment advisory, within the meaning of the Trading in Financial Instruments Act of 29 July 2005 (i.e. Journal of Laws 2019, item 875, as amended). The marketing communication is prepared with the highest diligence, objectivity, presents the facts known to the author on the date of preparation and is devoid of any evaluation elements. The marketing communication is prepared without considering the client’s needs, his individual financial situation and does not present any investment strategy in any way. The marketing communication does not constitute an offer of sale, offering, subscription, invitation to purchase, advertisement or promotion of any financial instruments. XTB S.A. is not liable for any client’s actions or omissions, in particular for the acquisition or disposal of financial instruments, undertaken on the basis of the information contained in this marketing communication. In the event that the marketing communication contains any information about any results regarding the financial instruments indicated therein, these do not constitute any guarantee or forecast regarding the future results.