
Shares of Tesla (TSLA.US) plunged almost 12% on Tuesday, the largest single-day drop since March. Combined with the drop on Monday, shares dropped 16.2% this week - the largest two-day drop in 14 months. Recent actions by Tesla's CEO on Twitter can be seen as a trigger behind the moves with options being the main driver. All of this made investors ask themselves - is the bubble bursting?
Musk's Twitter poll and board members share sales
One of the reasons behind this week's drop in Tesla share price is Elon Musk's Twitter poll launched over the weekend. The CEO of Tesla asked Twitter whether he should sell 10% of its Tesla holdings, worth around $21 billion at that time. Results of the poll favoured sale of the stake and Musk said he would abide by them. It was not specified when the sale would take place. Having said that, Musk may have already begun selling shares and it could justify a massive plunge yesterday.
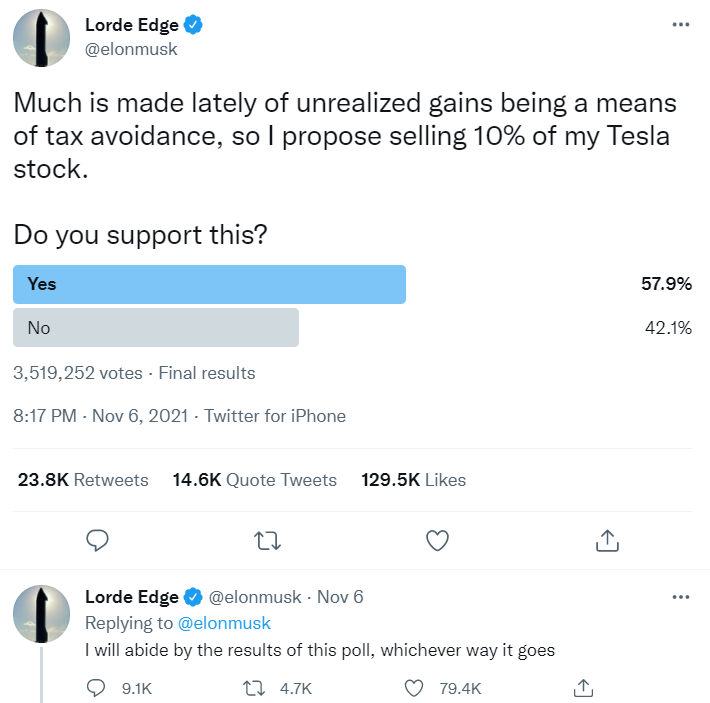 Elon Musk asked Twitter whether he should sell 10% of his Tesla stock. Source: Twitter
However, Elon Musk is known for his PR stunts and a rather chaotic Twitter activity. What may tell us more are actions by other board members of Tesla. Robyn Denholm, Ira Ehrenpreis and Antonio Gracias sold shares worth hundreds of millions of dollars since the end of October. Sales of stock by executives are closely watched by investors as they may hint that something bad is about to happen with a share price. What looks even more interesting is a regulatory filing from Kimbal Musk - one of Tesla's board members and brother of Elon Musk. According to the filing, Kimbal Musk sold $109 million worth of Tesla stock (15% of his holdings) on Friday, November 5 - just a day before Elon Musk launched a Twitter poll. Such activity by insiders paints a potentially bleak outlook for Tesla shares and the market may have taken a hint.
Options in play again
A big part of recent moves on Tesla - both upward and downward - was triggered by options trading. Options are a popular tool for speculation in the US as they help take advantage of volatile markets. However, they can also be a source of volatility on underlying stocks.
As a large number of traders buy call options, market makers who sell those options need to buy underlying stock to hedge their positions. Options often trade at a fraction of share price with contract size equaling to 100 stocks. However, market makers who want to hedge their position need to buy underlying stock at full price in respective quantities. This means that a small investment in options by a retail trader often leads to a large investment in an underlying by the market maker, creating a massive upward pressure on share price. This is especially true for highly volatile stocks as market makers attempt to hedge position quickly, before big price moves occur. Note that this works both ways. Should market makers have a large short position on put options, they would want to sell underlying stock to hedge this exposure. In such a scenario, a strong downward pressure on share price may appear. A look at the chart below shows that both call and put option trading volumes spiked this week but much more puts were traded than calls. A big jump in call volume at the end of October corresponded to the day when Tesla shares jumped above $1,000 - a move that was also driven with options trading activity.
 Tesla option trading volume since the beginning of July 2021. Source: Bloomberg, XTB
Is the bubble bursting?
Shares of Tesla are often labelled a speculative bubble. While the company has started to generate profits after years of cash burning, its valuation remains sky-high. Tesla trades at P/E ratio of almost 330! Current price is also 21.2 times higher than sales per share for the past 12 months. Note that this takes into account a recent 2-day plunge in share price. To put these figures into context, S&P 500 trades at P/E ratio of 25.8 and P/S ratio of 3.13! Given such a high valuation, a correction should not come as a surprise. However, it does not necessarily mean that the bubble is bursting. Tesla is a very volatile stock and volatility works both ways. It was not the first time the share price experienced such a steep dive but when something like that happens, investors tend to forget how much stock has rallied in the meantime. Sales by insiders can be a source of concern but it should be noted that board members are often barred from outright stock sales and need to plan them in advance. Having said that, the timing of recent sales may be just a coincidence.
A look at the Tesla (TSLA.US) chart shows that the decline still has quite a lot of room to deepen. Key near-term support can be found at the 50% retracement of this year's upward move in the $900 area. This zone is additionally strengthened by the lower limit of market geometry. In theory, a break below this area would hint at trend reversal. However, a psychological $1,000 area would need to be breached first. Current pre-market quotes point to a more or less flat opening of today's cash session.
 Source: xStation5

Daily Summary: A sell-off with a spin-off

US OPEN: The market extends losses as investor concerns grow

Market Wrap: European indices decline amid US - Iran tensions📉 Semiconductors under pressure

Netflix disappoints Wall Street 🚩 Stock drops 9% after disappointing outlook
The content of this report has been created by XTB S.A., with its registered office in Warsaw, at Prosta 67, 00-838 Warsaw, Poland, (KRS number 0000217580) and supervised by Polish Supervision Authority ( No. DDM-M-4021-57-1/2005). This material is a marketing communication within the meaning of Art. 24 (3) of Directive 2014/65/EU of the European Parliament and of the Council of 15 May 2014 on markets in financial instruments and amending Directive 2002/92/EC and Directive 2011/61/EU (MiFID II). Marketing communication is not an investment recommendation or information recommending or suggesting an investment strategy within the meaning of Regulation (EU) No 596/2014 of the European Parliament and of the Council of 16 April 2014 on market abuse (market abuse regulation) and repealing Directive 2003/6/EC of the European Parliament and of the Council and Commission Directives 2003/124/EC, 2003/125/EC and 2004/72/EC and Commission Delegated Regulation (EU) 2016/958 of 9 March 2016 supplementing Regulation (EU) No 596/2014 of the European Parliament and of the Council with regard to regulatory technical standards for the technical arrangements for objective presentation of investment recommendations or other information recommending or suggesting an investment strategy and for disclosure of particular interests or indications of conflicts of interest or any other advice, including in the area of investment advisory, within the meaning of the Trading in Financial Instruments Act of 29 July 2005 (i.e. Journal of Laws 2019, item 875, as amended). The marketing communication is prepared with the highest diligence, objectivity, presents the facts known to the author on the date of preparation and is devoid of any evaluation elements. The marketing communication is prepared without considering the client’s needs, his individual financial situation and does not present any investment strategy in any way. The marketing communication does not constitute an offer of sale, offering, subscription, invitation to purchase, advertisement or promotion of any financial instruments. XTB S.A. is not liable for any client’s actions or omissions, in particular for the acquisition or disposal of financial instruments, undertaken on the basis of the information contained in this marketing communication. In the event that the marketing communication contains any information about any results regarding the financial instruments indicated therein, these do not constitute any guarantee or forecast regarding the future results.