
The U.S. earnings season has started noticeably stronger than the market had anticipated, and early data from FactSet shows that American companies are entering the reporting period with a clear advantage over analysts’ expectations. At this stage, according to FactSet, around 10% of S&P 500 companies have already reported results for Q1 2026, and as many as 88% have beaten earnings-per-share estimates. This is well above both the five- and ten-year averages, offering a solid snapshot of corporate America’s condition at the outset of the most critical phase of the reporting season. Importantly, it’s not just profits that look strong—revenues are holding up as well, reinforcing the view that this earnings season is not driven solely by EPS. Top-line data is equally solid, which investors often value even more, as it reflects genuine business strength rather than just cost-cutting or margin optimization.
Key takeaways from the S&P 500 earnings season
Equally important, the magnitude of positive surprises is also impressive. In aggregate, companies are reporting earnings that are 10.8% above expectations, compared to a five-year average of 7.3% and a ten-year average of 7.1%. It’s worth noting that these historical averages reflect full-season results for all 500 companies, not just the subset that has reported so far, which makes the current figures even more striking.
So far, 84% of S&P 500 companies have reported revenues above estimates, compared to a five-year average of 70% and a ten-year average of 67%. The aggregate revenue surprise stands at 2.0%—in line with the five-year average but above the ten-year average of 1.5%.
The blended revenue growth rate for the first quarter is currently 9.9%, compared to 9.8% a week ago and 9.8% at the end of March. The change is modest, but symbolically important—it confirms that the improvement in results is supported by actual sales growth. If sustained, this would mark the strongest revenue growth for the S&P 500 since Q3 2022, when the index posted an 11.0% increase.
Meanwhile, the S&P 500 (US500) contract is holding above the 7,100 level at the start of the new trading week, trading roughly 7% above its 200-session EMA (EMA200, red line).
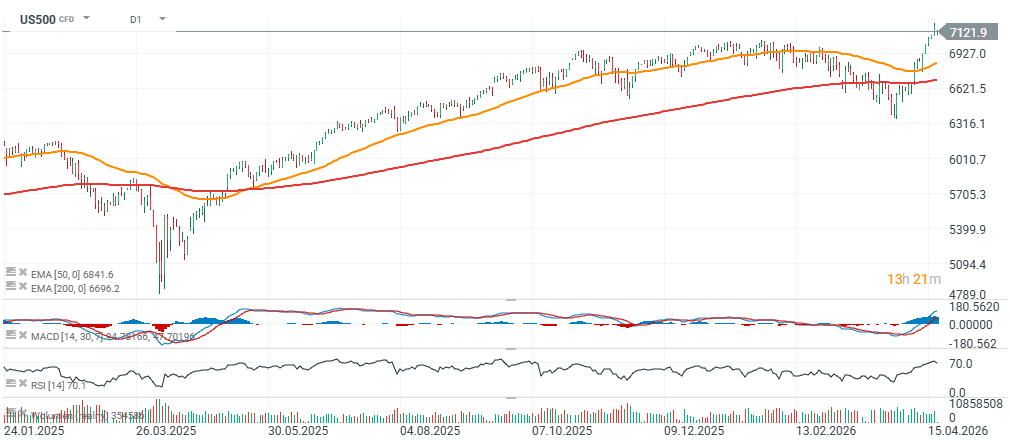
Source: xStation5
Strong start, but no shift in the broader quarterly picture
At first glance, the situation may seem somewhat paradoxical. On the one hand, the index is showing stronger earnings today than it did a week ago. On the other, compared to the end of March—the close of the first quarter—the overall growth rate remains unchanged. The blended earnings growth rate, which combines reported results with estimates for companies yet to report, currently stands at 13.2%, up from 12.2% a week earlier, but identical to the level recorded on March 31.
If this pace holds, it will mark the sixth consecutive quarter of double-digit year-over-year earnings growth for the S&P 500. That would underscore the remarkable resilience of U.S. corporations despite elevated interest rates, cost pressures, and uneven economic momentum.
Financials and communication services lead, energy drags
The improvement seen over the past week has been driven primarily by positive earnings surprises in the Financials and Communication Services sectors. These two segments have provided the largest boost to the index’s overall earnings growth. However, part of that upside has been offset by downward revisions to earnings estimates in the Energy sector.
Looking at the broader period since March 31, the positive contribution from Financials and Communication Services has been balanced by weaker trends in Energy and Health Care. In practical terms, this means that while the market has improved in the short term, it has not shifted meaningfully relative to its starting point at the end of the quarter.
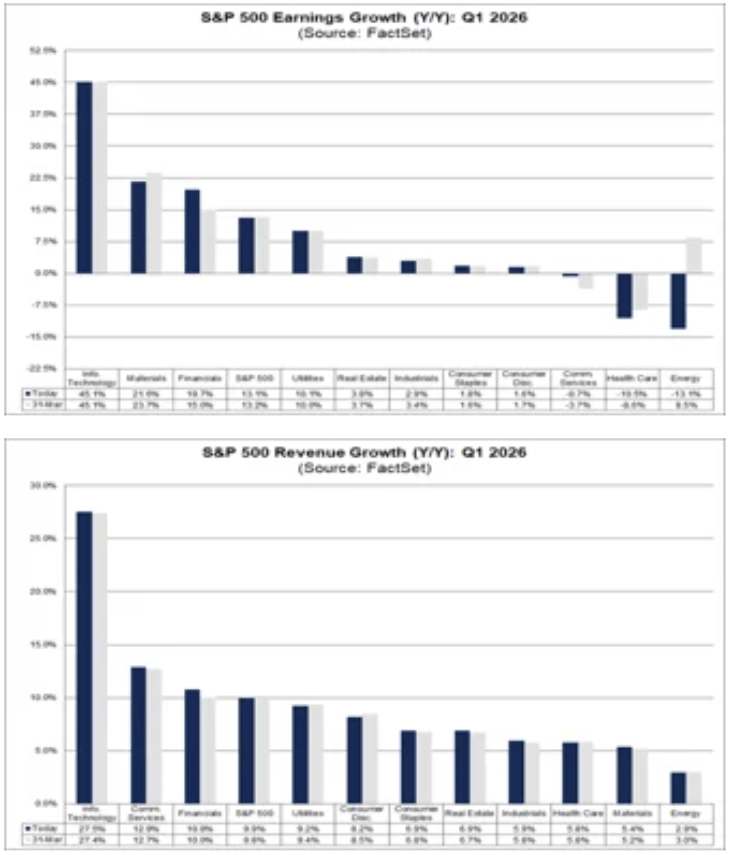
On a sector basis, eight of the eleven sectors are reporting or are expected to report year-over-year earnings growth. The leaders remain:
- Technology (Information Technology),
- Materials and industrial producers,
- Financials,
- Utilities.
On the other side, three sectors are expected to post earnings declines, with the weakest performance seen in:
- Energy,
- Health Care.
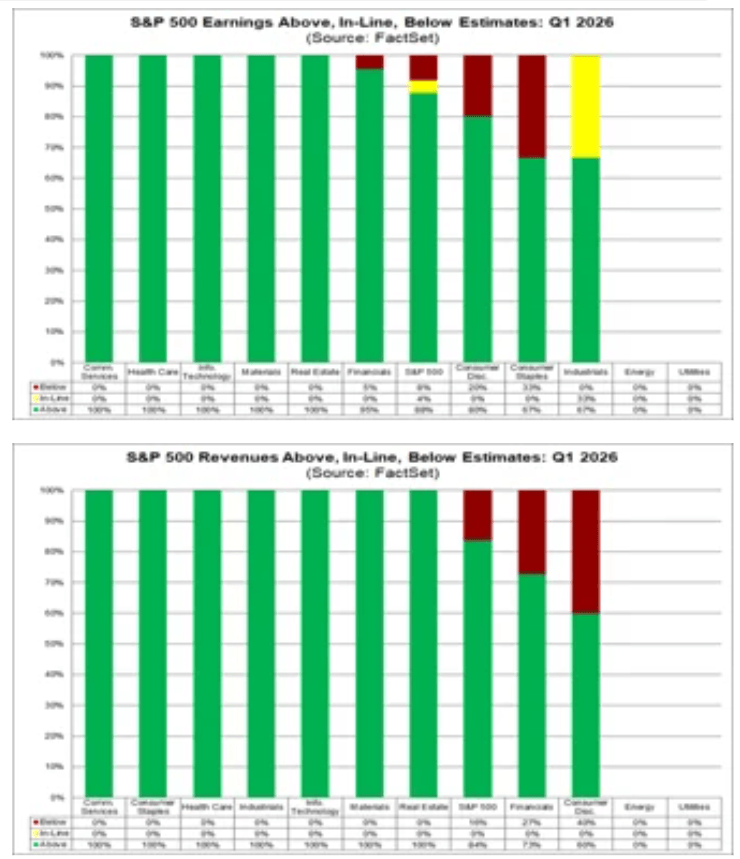
Source: FactSet
Financials once again take center stage
On the revenue side, much like with earnings, the Financials sector has made the largest positive contribution to the overall improvement in the index. Banks and financial institutions are largely responsible for the fact that total market revenues now look slightly better than both a week ago and at the end of March.
Importantly, revenue growth appears more evenly distributed than earnings growth. According to FactSet, all eleven sectors are reporting or are expected to report year-over-year revenue increases. The strongest performers are:
- Information Technology,
- Communication Services,
- Financials.
This suggests that sales growth is broadly based and not limited to a handful of mega-cap technology companies.
Valuations remain elevated
A strong earnings season does not mean the market is cheap. On the contrary, solid results are being delivered against a backdrop of already elevated valuations. The forward 12-month P/E ratio for the S&P 500 currently stands at 20.9, based on Wednesday’s closing price and forward EPS estimates. This is above both the five-year average of 19.9 and the ten-year average of 18.9. It is also higher than the 19.7 level recorded at the end of the first quarter on March 31.
This indicates that the market is not only pricing in continued earnings growth but is doing so with increasing confidence. As a result, the bar for companies is rising. In the coming weeks, simply beating consensus estimates may not be enough—investors will be closely watching revenue quality, margins, forward guidance, and management commentary on the second half of the year.
The market is already looking beyond Q1
Analysts are clearly looking past the first quarter. Expectations for the remainder of 2026 remain ambitious, with projected earnings growth of 20.1% for Q2, 22.2% for Q3, and 19.9% for Q4. For the full year, earnings are expected to grow by 18.0% year over year.
These are strong projections, but they also raise the stakes. The higher the expectations, the smaller the margin for disappointment. For now, incoming data supports a positive narrative, but as the season progresses, the market is likely to become more selective.
Source: FactSet
The busiest stretch of the season still ahead
So far, results from only about one-tenth of the S&P 500 have been released, meaning the most critical phase of the season is still to come. In the week ahead, 93 companies from the index—including 7 Dow Jones components—are scheduled to report first-quarter results. This wave will be decisive in determining whether the current positive momentum evolves into a sustained trend.
For now, the conclusion is relatively clear: the U.S. earnings season has started on a strong footing, with larger-than-usual positive surprises and solid growth in both earnings and revenues. The challenge is that much of this strength is already reflected in market pricing. The coming weeks will therefore test not only corporate performance, but also whether Wall Street remains willing to pay a premium for growth.

Daily Summary: Wall Street Regains Ground; Another Intervention in the Yen Market❓

Three Markets to Watch Next Week (July 31, 2026)

Market Wrap: European equities at 3-week highs! Apple dips in US premarket!

Economic Calendar: Key European CPI Readings and Oil Giants’ Earnings
The content of this report has been created by XTB S.A., with its registered office in Warsaw, at Prosta 67, 00-838 Warsaw, Poland, (KRS number 0000217580) and supervised by Polish Supervision Authority ( No. DDM-M-4021-57-1/2005). This material is a marketing communication within the meaning of Art. 24 (3) of Directive 2014/65/EU of the European Parliament and of the Council of 15 May 2014 on markets in financial instruments and amending Directive 2002/92/EC and Directive 2011/61/EU (MiFID II). Marketing communication is not an investment recommendation or information recommending or suggesting an investment strategy within the meaning of Regulation (EU) No 596/2014 of the European Parliament and of the Council of 16 April 2014 on market abuse (market abuse regulation) and repealing Directive 2003/6/EC of the European Parliament and of the Council and Commission Directives 2003/124/EC, 2003/125/EC and 2004/72/EC and Commission Delegated Regulation (EU) 2016/958 of 9 March 2016 supplementing Regulation (EU) No 596/2014 of the European Parliament and of the Council with regard to regulatory technical standards for the technical arrangements for objective presentation of investment recommendations or other information recommending or suggesting an investment strategy and for disclosure of particular interests or indications of conflicts of interest or any other advice, including in the area of investment advisory, within the meaning of the Trading in Financial Instruments Act of 29 July 2005 (i.e. Journal of Laws 2019, item 875, as amended). The marketing communication is prepared with the highest diligence, objectivity, presents the facts known to the author on the date of preparation and is devoid of any evaluation elements. The marketing communication is prepared without considering the client’s needs, his individual financial situation and does not present any investment strategy in any way. The marketing communication does not constitute an offer of sale, offering, subscription, invitation to purchase, advertisement or promotion of any financial instruments. XTB S.A. is not liable for any client’s actions or omissions, in particular for the acquisition or disposal of financial instruments, undertaken on the basis of the information contained in this marketing communication. In the event that the marketing communication contains any information about any results regarding the financial instruments indicated therein, these do not constitute any guarantee or forecast regarding the future results.