
NATGAS regained some ground yesterday after a dynamic wave of declines that saw nine straight sessions of declines. From a technical point of view, gas broke out below the key support zones marked by the 50-, 100- and 200-day exponential moving averages (on the chart these are the blue, purple and gold curves, respectively). The RSI indicator shows that US natural gas is now trading at its lowest levels since February of this year.
From a fundamental point of view, the temperature forecasts for the U.S. point to an all-time high. The 2-yr forecasts at this point settle in the region of 0.5 standard deviations of the ECMWF forecast range.
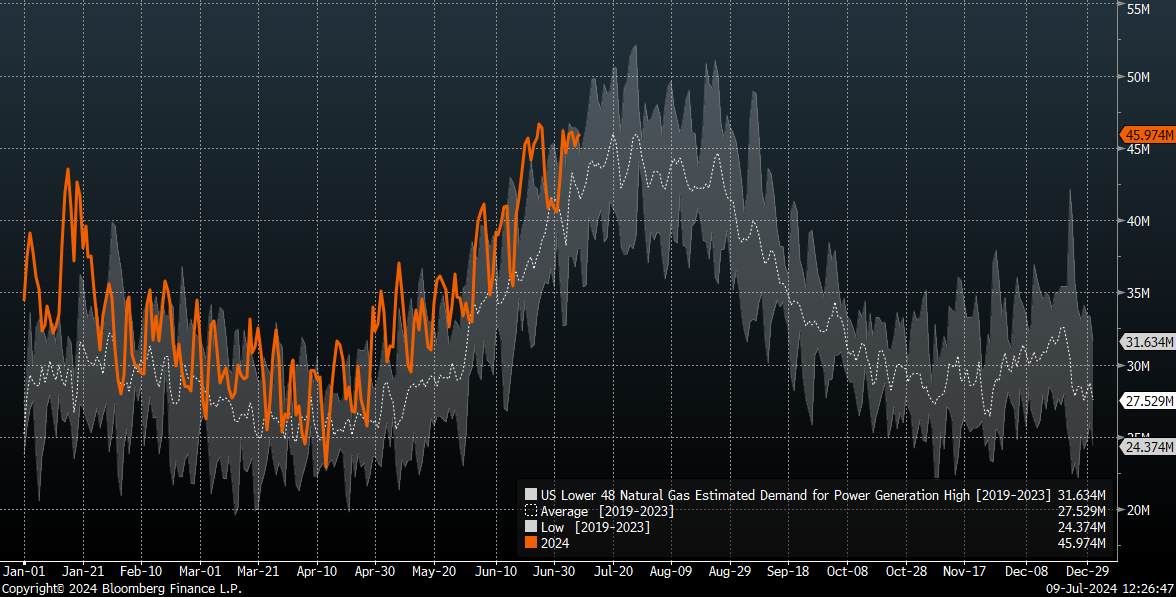
Projected gas demand for electricity generation is now coming out above the upper range of the 5-year average. Source: Bloomberg Financial LP
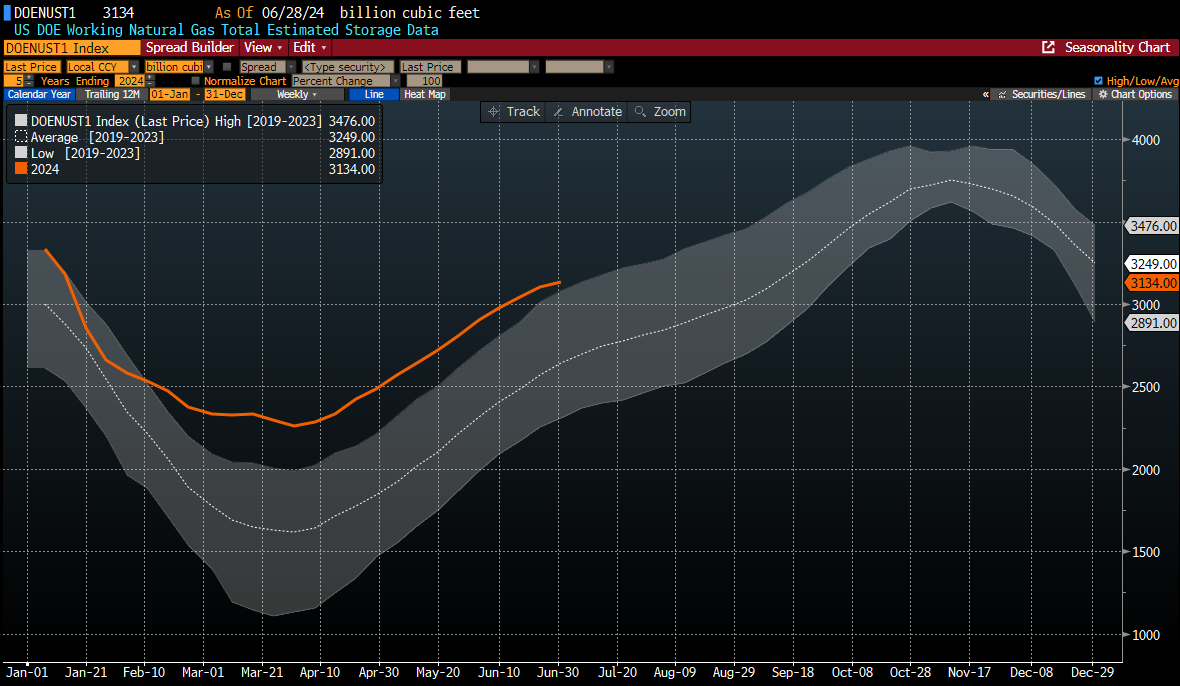
Downward pressure on gas, however, continues to be exacerbated by US gas inventories remaining high on a seasonal basis. Source: Bloomberg Financial LP
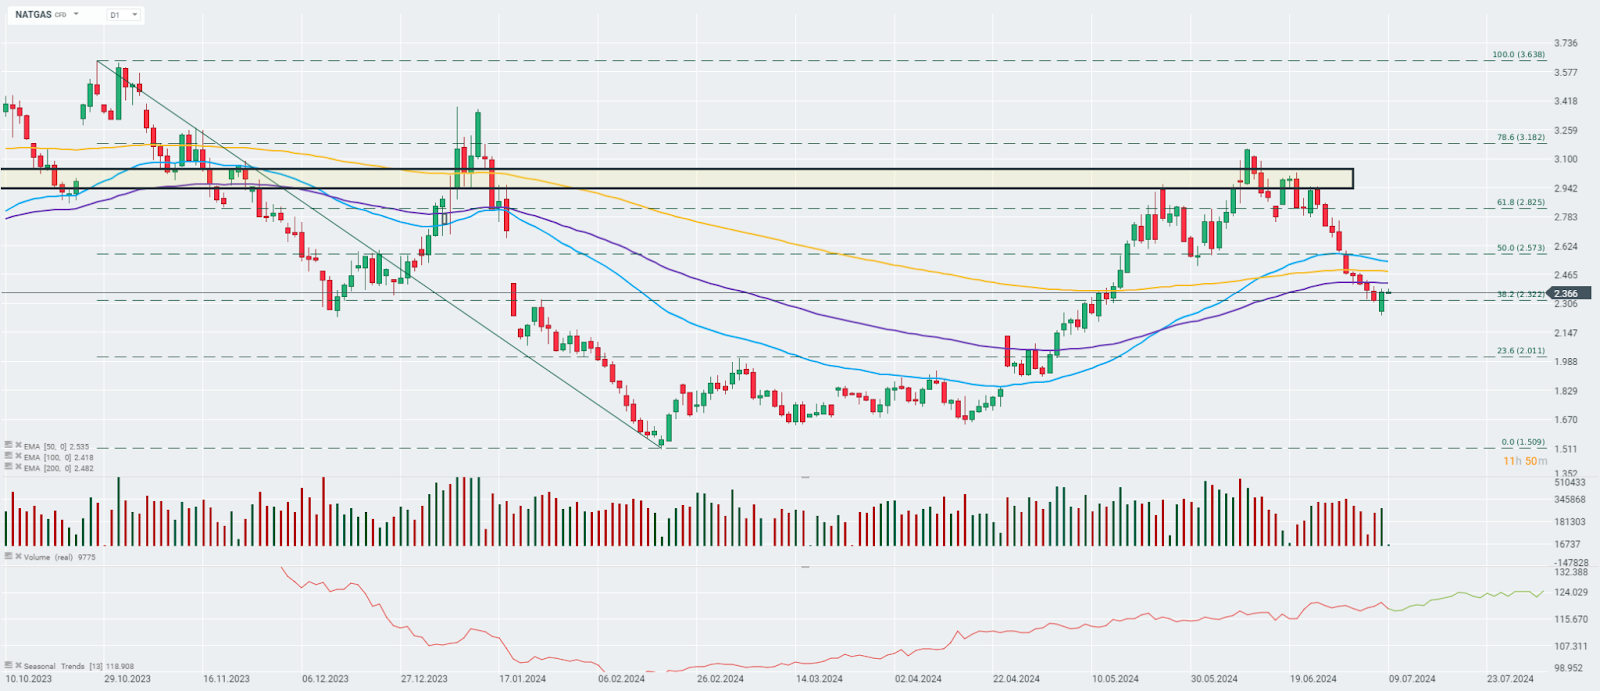
From a technical point of view, the key question now seems to be whether NATGAS will manage to return above the range of the 100-day EMA (purple curve), which could be an important resistance point on the chart in the short term. The most important support remains the daily minimum from yesterday's session. Source: xStation

When will the rise in oil prices reach us?

Daily Summary: Equities Diverge as Tech Lags, Europe Rallies on Earnings & PMIs (24.07.2026)

Three markets to watch next week (24.07.2026)

Oil Slides Ahead of the Weekend!
The content of this report has been created by XTB S.A., with its registered office in Warsaw, at Prosta 67, 00-838 Warsaw, Poland, (KRS number 0000217580) and supervised by Polish Supervision Authority ( No. DDM-M-4021-57-1/2005). This material is a marketing communication within the meaning of Art. 24 (3) of Directive 2014/65/EU of the European Parliament and of the Council of 15 May 2014 on markets in financial instruments and amending Directive 2002/92/EC and Directive 2011/61/EU (MiFID II). Marketing communication is not an investment recommendation or information recommending or suggesting an investment strategy within the meaning of Regulation (EU) No 596/2014 of the European Parliament and of the Council of 16 April 2014 on market abuse (market abuse regulation) and repealing Directive 2003/6/EC of the European Parliament and of the Council and Commission Directives 2003/124/EC, 2003/125/EC and 2004/72/EC and Commission Delegated Regulation (EU) 2016/958 of 9 March 2016 supplementing Regulation (EU) No 596/2014 of the European Parliament and of the Council with regard to regulatory technical standards for the technical arrangements for objective presentation of investment recommendations or other information recommending or suggesting an investment strategy and for disclosure of particular interests or indications of conflicts of interest or any other advice, including in the area of investment advisory, within the meaning of the Trading in Financial Instruments Act of 29 July 2005 (i.e. Journal of Laws 2019, item 875, as amended). The marketing communication is prepared with the highest diligence, objectivity, presents the facts known to the author on the date of preparation and is devoid of any evaluation elements. The marketing communication is prepared without considering the client’s needs, his individual financial situation and does not present any investment strategy in any way. The marketing communication does not constitute an offer of sale, offering, subscription, invitation to purchase, advertisement or promotion of any financial instruments. XTB S.A. is not liable for any client’s actions or omissions, in particular for the acquisition or disposal of financial instruments, undertaken on the basis of the information contained in this marketing communication. In the event that the marketing communication contains any information about any results regarding the financial instruments indicated therein, these do not constitute any guarantee or forecast regarding the future results.