
Wall Street indices snapped a winning streak yesterday with S&P 500 finishing lower for the first time in 9 days. Nasdaq was the worst performing index as the tech sector was pressured by a plunge in Tesla shares. Russell 2000 dropped over 0.5% while Dow Jones pulled back around 0.3%.
Taking a look at Dow Jones (US30) at H1 interval, we can see that this index has pulled back from its recent all-time high and tested support zone at 36,060 pts. This level is marked not only with previous price reactions but also with the lower limit of a local market geometry (red box). A short-term downward trendline limited upward moves of the index throughout yesterday's Wall Street session and today's trading in Asia. A break above this trendline could hint at resumption of upward move and a possible attack on recent record highs. On the other hand, breaking below the 36,060 pts could pave the way for a deeper drop as, in theory, it would point to a reversal of short-term trend. In case today's US CPI data (1:30 pm GMT) shows a large deviation from consensus, Wall Street indices may become more volatile.
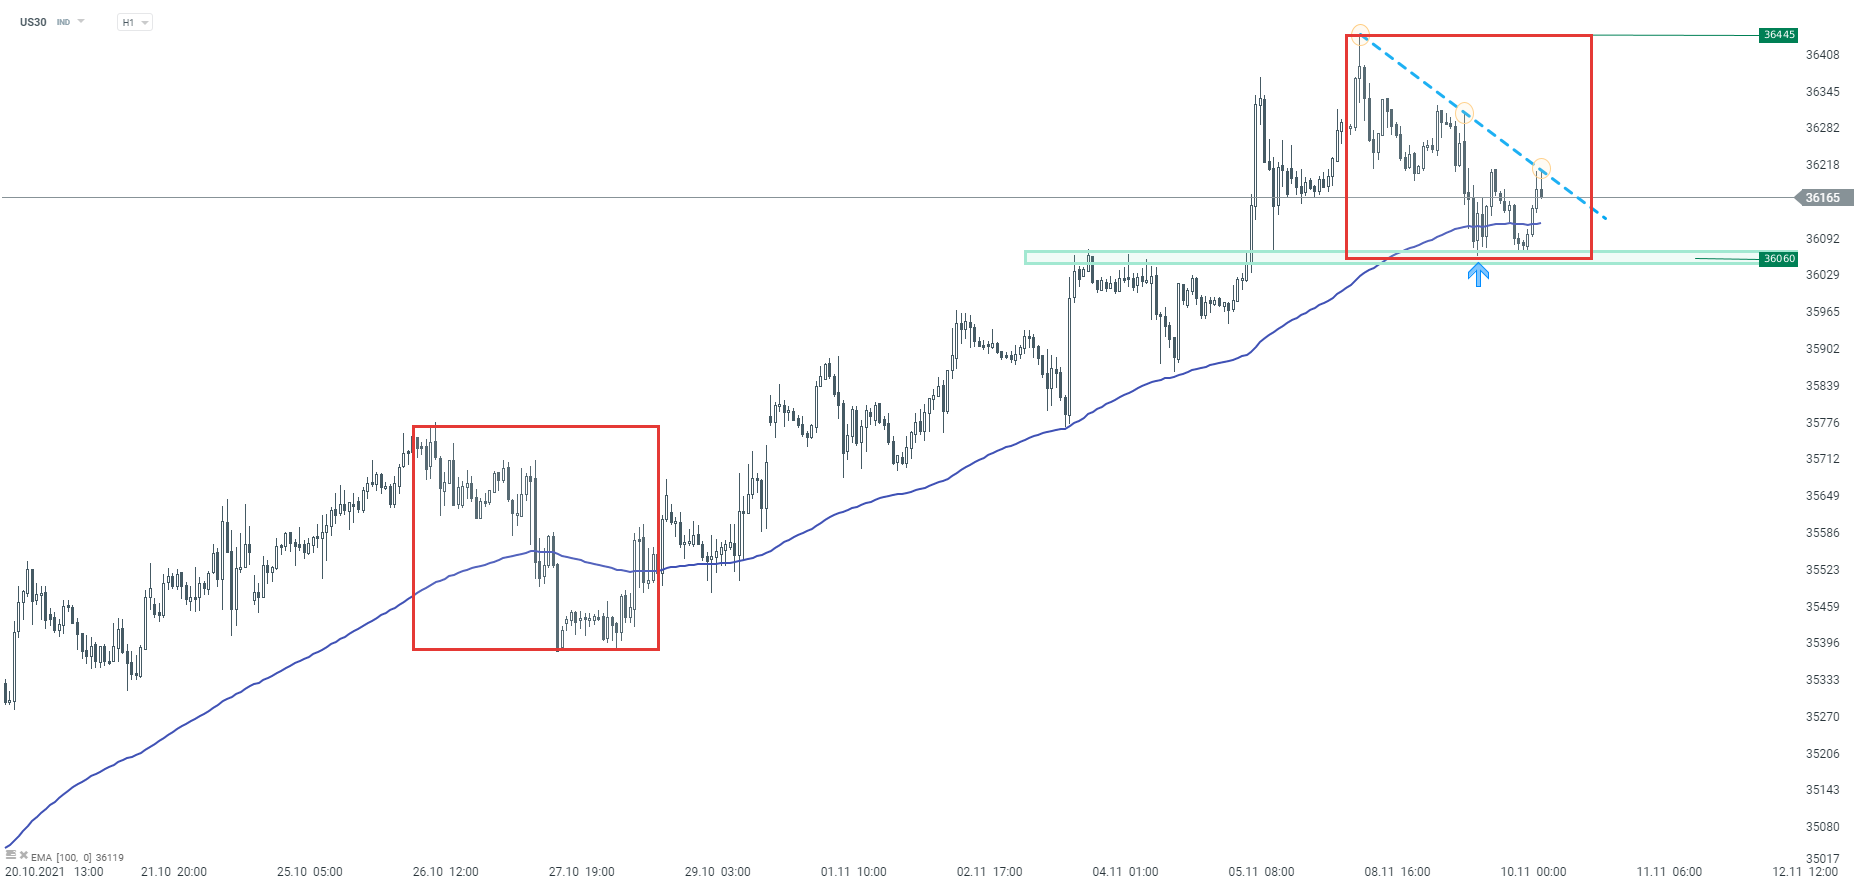 Source: xStation5

Market wrap: AI CAPEX loses its shine?🚩 Alphabet and Tesla weigh on global markets (23.07.2026)

Daily Summary: Wall Street Stabilizes Despite Higher Oil Prices

Chart of the Day: AI supports gains – can Tesla and Google sustain them? (22.07.2026)

Economic Calendar: Time for Tesla and Google Earnings (22.07.2026)
The content of this report has been created by XTB S.A., with its registered office in Warsaw, at Prosta 67, 00-838 Warsaw, Poland, (KRS number 0000217580) and supervised by Polish Supervision Authority ( No. DDM-M-4021-57-1/2005). This material is a marketing communication within the meaning of Art. 24 (3) of Directive 2014/65/EU of the European Parliament and of the Council of 15 May 2014 on markets in financial instruments and amending Directive 2002/92/EC and Directive 2011/61/EU (MiFID II). Marketing communication is not an investment recommendation or information recommending or suggesting an investment strategy within the meaning of Regulation (EU) No 596/2014 of the European Parliament and of the Council of 16 April 2014 on market abuse (market abuse regulation) and repealing Directive 2003/6/EC of the European Parliament and of the Council and Commission Directives 2003/124/EC, 2003/125/EC and 2004/72/EC and Commission Delegated Regulation (EU) 2016/958 of 9 March 2016 supplementing Regulation (EU) No 596/2014 of the European Parliament and of the Council with regard to regulatory technical standards for the technical arrangements for objective presentation of investment recommendations or other information recommending or suggesting an investment strategy and for disclosure of particular interests or indications of conflicts of interest or any other advice, including in the area of investment advisory, within the meaning of the Trading in Financial Instruments Act of 29 July 2005 (i.e. Journal of Laws 2019, item 875, as amended). The marketing communication is prepared with the highest diligence, objectivity, presents the facts known to the author on the date of preparation and is devoid of any evaluation elements. The marketing communication is prepared without considering the client’s needs, his individual financial situation and does not present any investment strategy in any way. The marketing communication does not constitute an offer of sale, offering, subscription, invitation to purchase, advertisement or promotion of any financial instruments. XTB S.A. is not liable for any client’s actions or omissions, in particular for the acquisition or disposal of financial instruments, undertaken on the basis of the information contained in this marketing communication. In the event that the marketing communication contains any information about any results regarding the financial instruments indicated therein, these do not constitute any guarantee or forecast regarding the future results.