
Goldman Sachs (GS.US) kicked off earnings season by joining other major banks in reporting their Q2 2025 results. Similar to other large U.S. banks with a significant investment banking presence, Goldman Sachs reported strong revenues, driven by a rebound in financial markets after April's sell-offs.
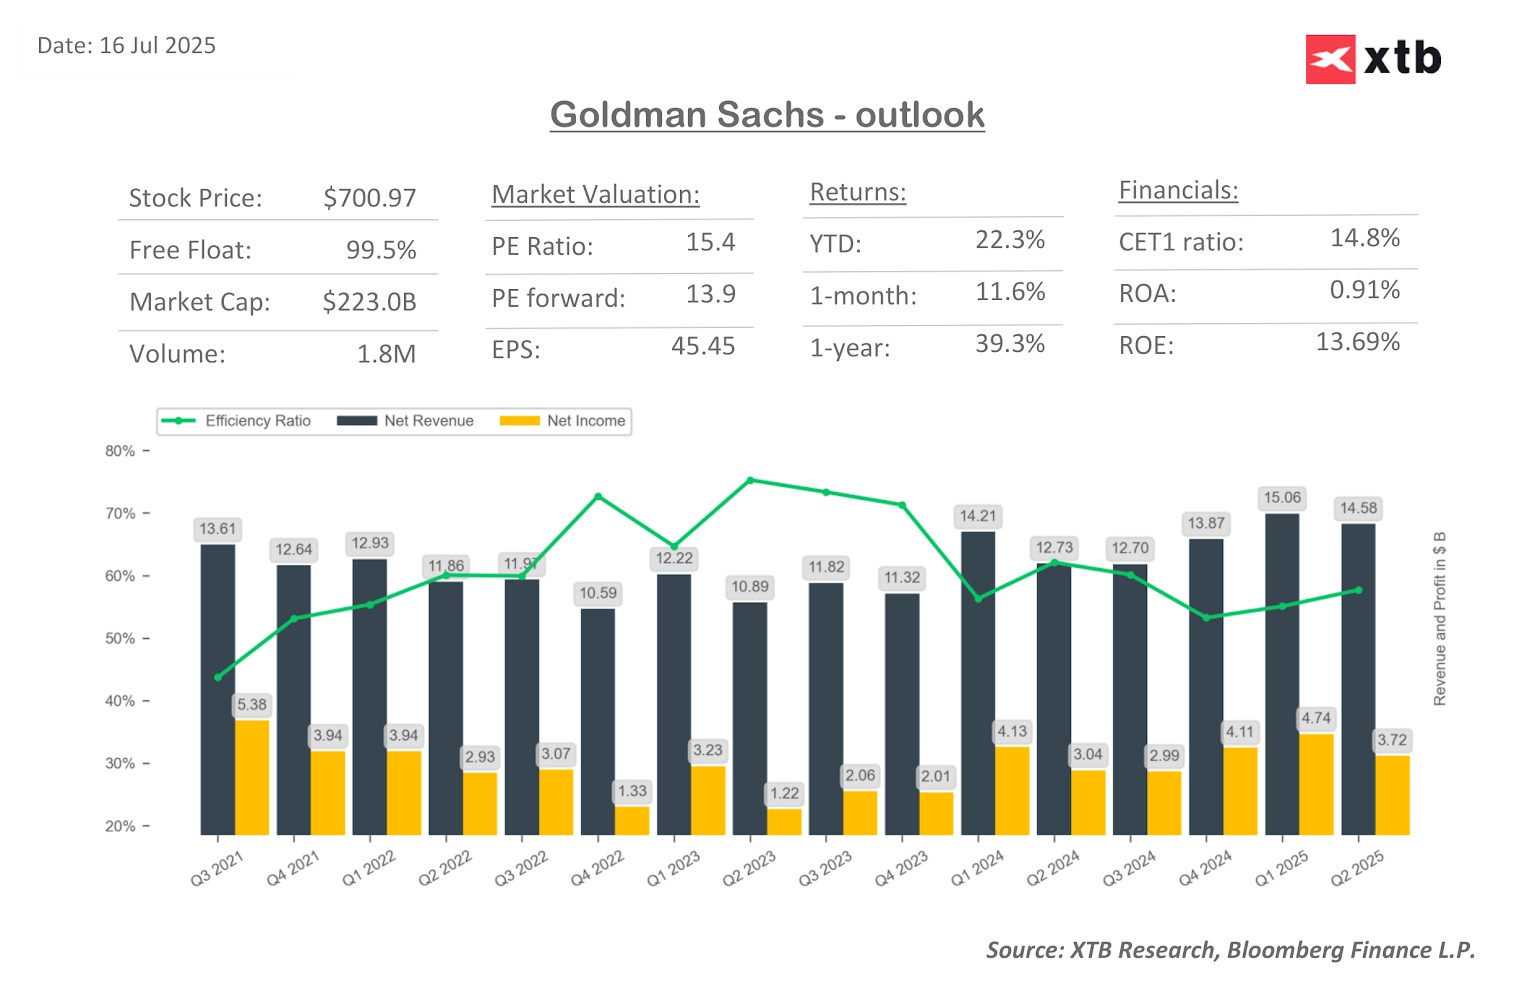
The company reported net revenues of $14.58 billion, a 15% increase year-over-year. Although this figure is lower than the previous quarter, it significantly surpassed estimates of $13.53 billion. The equities trading revenue segment showed the strongest momentum, rising by 23% year-over-year to $4.3 billion. This marks the best result in the company's history for this segment, largely driven by a 45% year-over-year increase in brokerage revenues.
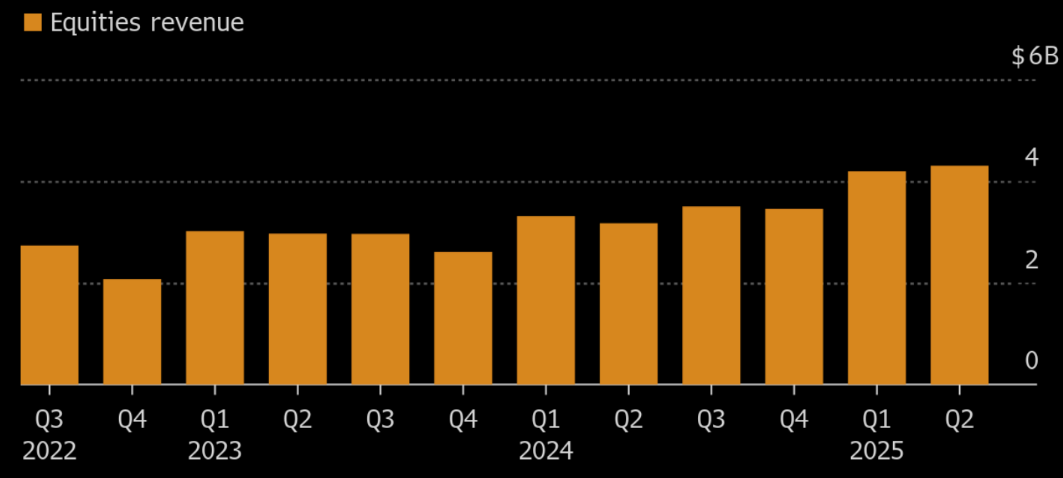
Goldman Sachs' equities trading revenue. Source: Bloomberg Finance L.P.
The company also achieved better-than-expected cost efficiency, reflected in a lower efficiency ratio (the percentage of costs to revenues) of 63.4%, compared to forecasts of 64.8%. This contributed to a higher net earnings per share (EPS) of $10.91, compared to $8.62 a year earlier.
Despite solid results, Goldman Sachs (similar to JP Morgan Chase) is trading down about -0.5% today. The market's reaction to the results remains neutral, with the prospect of strengthening earnings trends likely to offer long-term potential for the bank's growth rather than a short-term rebound.
Q2 2025 Results:
Revenues:
-
Net Revenue: $14.58 billion (+15% y/y); estimates: $13.53 billion
-
FICC Sales & Trading Revenue: $3.47 billion; estimates: $3.26 billion
-
Equities Sales & Trading Revenue: $4.30 billion; estimates: $3.72 billion
-
Global Banking & Markets Net Revenues: $10.12 billion (+24% y/y); estimates: $9.03 billion
-
Investment Banking Revenue: $2.19 billion (+27% y/y); estimates: $1.8 billion
-
Advisory Revenue: $1.17 billion (+71% y/y); estimates: $852.7 million
-
Equity Underwriting Revenue: $428 million (+1.2% y/y); estimates: $384.8 million
-
Debt Underwriting Revenue: $589 million (-5.3% y/y); estimates: $592.5 million
-
Net Interest Income: $3.10 billion; estimates: $2.43 billion
Earnings & Profitability Ratios:
-
EPS: $10.91 (vs. $8.62 y/y)
-
Adj. EPS: $10.91; estimates: $9.77
-
ROE (Return on Equity): +12.8%; estimates: +11.3%
-
Efficiency Ratio: 63.4%; estimates: 64.8%
Costs & Losses:
-
Platform Solutions Pretax Loss: $57 million; estimates: $85.6 million loss
-
Provision for Credit Losses: $384 million (+36% y/y)
-
Total Operating Expenses: $9.24 billion (+8.3% y/y)
Balance Sheet:
-
Total Deposits: $466 billion (-1.1% q/q)
-
Standardized CET1 Ratio: 14.5%; estimates: 14.7%
-
Book Value Per Share: $349.74 (vs. $327.13 y/y)
-
Assets Under Management: $3.29 trillion (+12% y/y)
-
Total AUS Net Inflows: $5 billion (-93% y/y)
-
Loans: $217 billion; estimates: $211.09 billion

Daily Summary: Equities Diverge as Tech Lags, Europe Rallies on Earnings & PMIs (24.07.2026)

US OPEN: Nasdaq hits 1-month low! Geopolitics bring AI trade down!

Market Wrap: European Stocks Are Trying to Rebound as the Week Comes to an End💡

Alphabet shares are down 22% from their all-time high 🚩 Is Google ready to resume its bull run?
The content of this report has been created by XTB S.A., with its registered office in Warsaw, at Prosta 67, 00-838 Warsaw, Poland, (KRS number 0000217580) and supervised by Polish Supervision Authority ( No. DDM-M-4021-57-1/2005). This material is a marketing communication within the meaning of Art. 24 (3) of Directive 2014/65/EU of the European Parliament and of the Council of 15 May 2014 on markets in financial instruments and amending Directive 2002/92/EC and Directive 2011/61/EU (MiFID II). Marketing communication is not an investment recommendation or information recommending or suggesting an investment strategy within the meaning of Regulation (EU) No 596/2014 of the European Parliament and of the Council of 16 April 2014 on market abuse (market abuse regulation) and repealing Directive 2003/6/EC of the European Parliament and of the Council and Commission Directives 2003/124/EC, 2003/125/EC and 2004/72/EC and Commission Delegated Regulation (EU) 2016/958 of 9 March 2016 supplementing Regulation (EU) No 596/2014 of the European Parliament and of the Council with regard to regulatory technical standards for the technical arrangements for objective presentation of investment recommendations or other information recommending or suggesting an investment strategy and for disclosure of particular interests or indications of conflicts of interest or any other advice, including in the area of investment advisory, within the meaning of the Trading in Financial Instruments Act of 29 July 2005 (i.e. Journal of Laws 2019, item 875, as amended). The marketing communication is prepared with the highest diligence, objectivity, presents the facts known to the author on the date of preparation and is devoid of any evaluation elements. The marketing communication is prepared without considering the client’s needs, his individual financial situation and does not present any investment strategy in any way. The marketing communication does not constitute an offer of sale, offering, subscription, invitation to purchase, advertisement or promotion of any financial instruments. XTB S.A. is not liable for any client’s actions or omissions, in particular for the acquisition or disposal of financial instruments, undertaken on the basis of the information contained in this marketing communication. In the event that the marketing communication contains any information about any results regarding the financial instruments indicated therein, these do not constitute any guarantee or forecast regarding the future results.