
Major data from the US labour market will be released next Friday. Despite rising inflation, the Fed is using the weaker NFP report as an excuse to postpone the so-called tapering, i.e. the process of reducing asset purchases. However, in the face of strong NFP data, bankers may run out of arguments to maintain current policies, which in turn may cause greater volatility on the markets.
TNOTE
As for the TNOTE market, the recent rollover slightly distorted the chart, but on the D1 interval it can be seen that the market was actually consolidating since the beginning of March. If Friday's NFP data cause more movement in the bond market, it may also translate into higher volatility in the stock, dollar or gold markets. Technically looking at the TNOTE chart, the key support is located around the recent lows at 130.80, while the resistance lies at 133.6. The line along the last lows and highs should also be taken into account, as it was respected by the market and should act as the nearest obstacle for market bulls.
 TNOTE interval D1. Source: xStation5
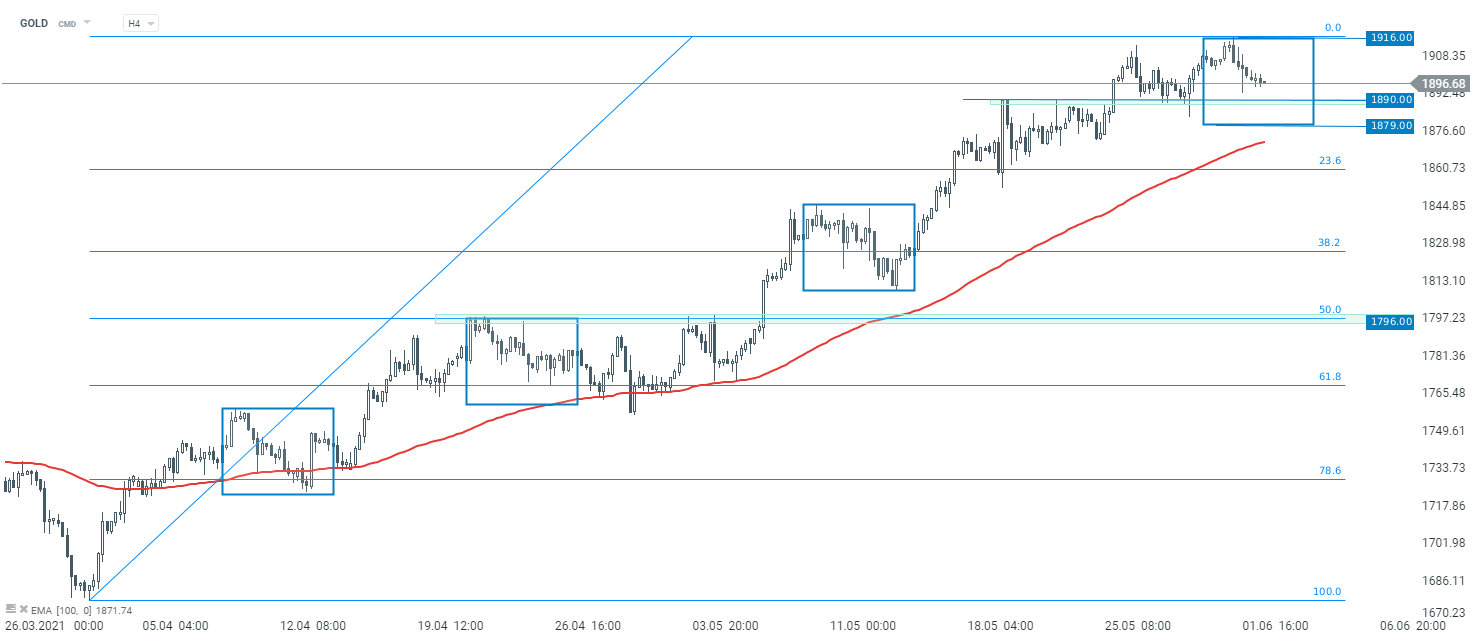
GOLD
Gold has been in an uptrend since the beginning of April. In recent days, the upward movement has slightly decreased, but it is definitely too early to think about a change of direction. It is worth noting that the first Fibonacci measurement - 23.6% is relatively far away, which proves the strength of the trend (shallow corrections and strong upward impulses). The nearest support is the sequence zone at $ 1,890, followed by the $ 1,879 level, which is marked with the lower limit of the 1:1 structure. The aforementioned Fibo levels should also be considered as support levels. The closest resistance lies at $1,916.
 Gold interval H4. Source: xStation5
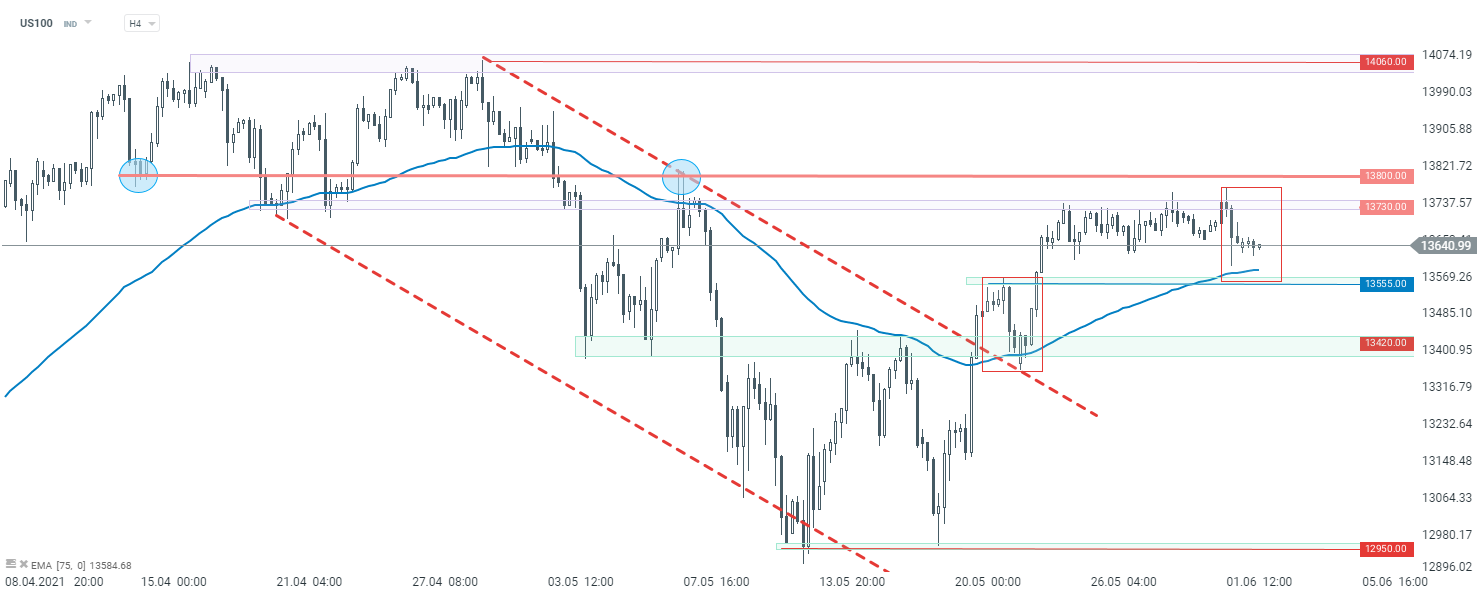
US100
Looking at the stock market, the US Nasdaq (US100) has been consolidating for a week. Buyers tried unsuccessfully several times to break above the resistance at 13,730 pts. If the correction deepens, then it is worth paying attention to the support at 13555 pts, which is marked with the lower limit of the 1: 1 structure and EMA75. Break below this zone could open the way towards support at 13,420 pts. On the other hand, if buyers manage to break above the aforementioned resistance at 13,730 pts at the next attempt, then upward movement may become stronger. In such a scenario, the next noteworthy resistance lies quite close - at 13,800 pts. Breaking above it could pave the way towards all-time highs at 14060 pts.
 US100 interval H4. Source: xSation5

Morning Wrap: Markets Are Trying to Rebound Following Big Tech Earnings and the Fed's Decision

Daily Summary - The market starts to doubt rate hikes after Warsh, but Trump destroys the rebound

Fed Press Conference: Warsh Praises CapEx and Improves Market Sentiment

Strong Sell-off in Coffee and Cocoa
The content of this report has been created by XTB S.A., with its registered office in Warsaw, at Prosta 67, 00-838 Warsaw, Poland, (KRS number 0000217580) and supervised by Polish Supervision Authority ( No. DDM-M-4021-57-1/2005). This material is a marketing communication within the meaning of Art. 24 (3) of Directive 2014/65/EU of the European Parliament and of the Council of 15 May 2014 on markets in financial instruments and amending Directive 2002/92/EC and Directive 2011/61/EU (MiFID II). Marketing communication is not an investment recommendation or information recommending or suggesting an investment strategy within the meaning of Regulation (EU) No 596/2014 of the European Parliament and of the Council of 16 April 2014 on market abuse (market abuse regulation) and repealing Directive 2003/6/EC of the European Parliament and of the Council and Commission Directives 2003/124/EC, 2003/125/EC and 2004/72/EC and Commission Delegated Regulation (EU) 2016/958 of 9 March 2016 supplementing Regulation (EU) No 596/2014 of the European Parliament and of the Council with regard to regulatory technical standards for the technical arrangements for objective presentation of investment recommendations or other information recommending or suggesting an investment strategy and for disclosure of particular interests or indications of conflicts of interest or any other advice, including in the area of investment advisory, within the meaning of the Trading in Financial Instruments Act of 29 July 2005 (i.e. Journal of Laws 2019, item 875, as amended). The marketing communication is prepared with the highest diligence, objectivity, presents the facts known to the author on the date of preparation and is devoid of any evaluation elements. The marketing communication is prepared without considering the client’s needs, his individual financial situation and does not present any investment strategy in any way. The marketing communication does not constitute an offer of sale, offering, subscription, invitation to purchase, advertisement or promotion of any financial instruments. XTB S.A. is not liable for any client’s actions or omissions, in particular for the acquisition or disposal of financial instruments, undertaken on the basis of the information contained in this marketing communication. In the event that the marketing communication contains any information about any results regarding the financial instruments indicated therein, these do not constitute any guarantee or forecast regarding the future results.