
Proclaimed as the most significant revolution of the 21st century, artificial intelligence is at the heart of contemporary debates from a scientific, ethical, and broadly civilizational perspective. This major topic is having a strong impact on the markets through the technology sector. The race for innovation has now become a key objective for the giants of American tech.
Behind the scenes, advancements in electronics have played a key role in these recent developments. Nvidia (NVDA) is one of the most representative players, currently accounting for 80% of the market for advanced AI chips. Following the recent earnings release, the company confirmed being one of the biggest beneficiaries of the recent AI rally, taking advantage of the massive spending by tech giants like Microsoft, Alphabet, Facebook, or Baidu.
Such investments, although largely concentrated on some suppliers, trickle down across the entire global electronics sector. Taiwan Semiconductor Manufacturing (TSM) and BE Semiconductor Industries (BESI) have both seen their stock prices soar on the markets. The German Infineon (IFX), less favored by investors, has, on its side, recorded growth in its revenue, earnings, and margin.
Focus on STMicroelectronics (STM)
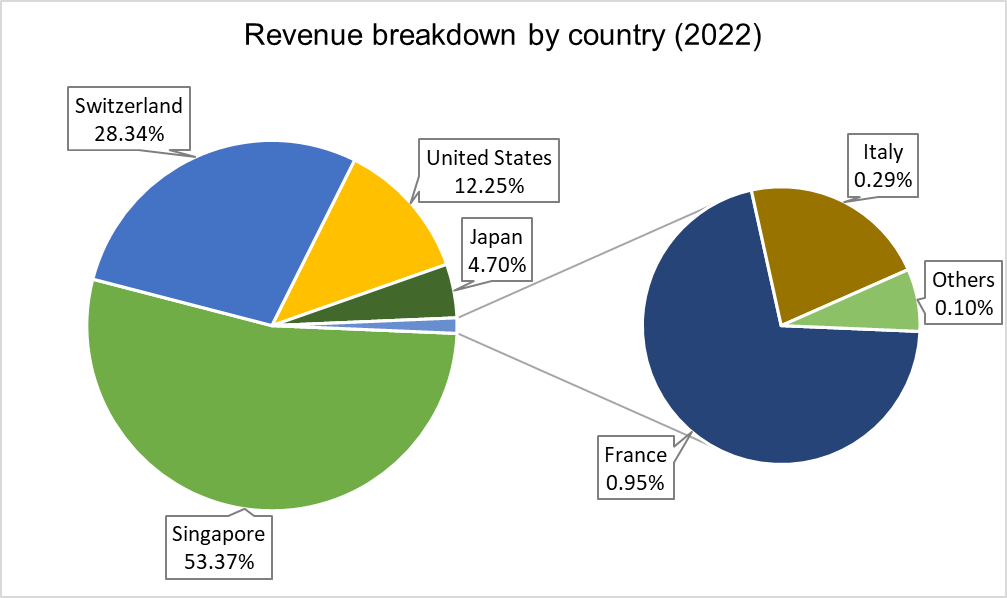
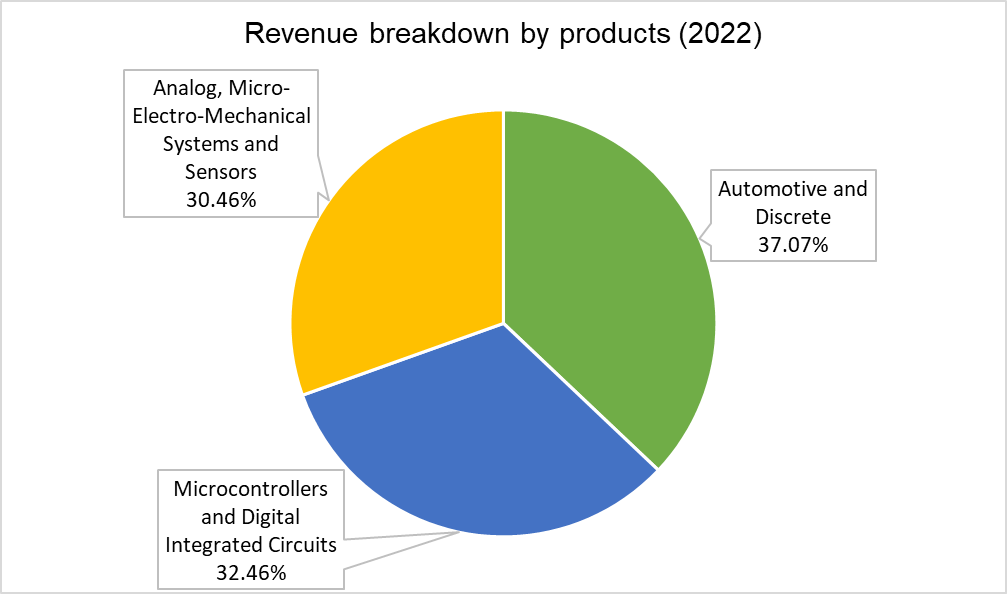
When speaking about the semiconductor industry, it's hard to overlook the Franco-Italian company STMicroelectronics, currently the 7th largest market capitalization on the Milan stock exchange and the 20th largest for the CAC 40. Founded in 1987 through the merger between SGS and a subsidiary of Thomson, its primary business is the production of integrated circuits, microcontrollers, and analog circuits, which it sells worldwide. Its main customers are pioneers in the technology sector, including Apple, Cisco, Huawei, and Samsung.
The company holds a significant importance for public authorities: it is owned to the extent of 27.5% equally by Bpifrance and the Italian Ministry of Economy and Finance. Among its largest shareholders, we also find American funds Capital Research & Management (4.25%), BlackRock (3.89%), and Vanguard (1.80%). Following are the French Amundi (1.02%), Covéa (0.94%), and BNP Paribas (0.81%).
Analysis of 2023 earnings report
Since the publication of its annual financial statements for 2023, uncertainty seems to be growing among investors. Those who were expecting growth as strong as between 2021 and 2022 might have been disappointed to only see a 4% increase in revenue and profit, along with a mechanically stable margin. Others, on the contrary, applaud the operational bodies' ability to maintain such a high level of performance and are not worried about the company's future ability to create value.
Key indicators for FY 2023 :
- Revenue : $15.66B (3.91% annual growth, 0.3% below estimates)
- Net earnings : $3.90B (3.37% annual growth, 19.6% over estimates)
- Net margin : 24.36% vs 24.55% in 2022
- EPS : $1.03 (-6,36% annual growth, 19,8% over estimates)


Source : XTB Research
In the following table, we can see how STMicroelectronics performs compared to its main worldwide competitors :
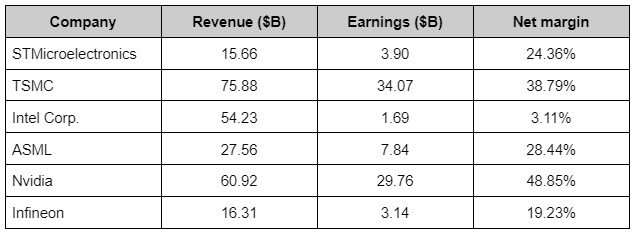
Source : XTB Research
Overview of past valuation
Comparing the historical stock prices to the results through what is commonly known as the Price-to-Earnings Ratio (PER), allows us to obtain a measure of the market's valuation of a title on the basis of a fundamental metric widely followed by investors.
Studying STMicroelectronics' PER history, we can see that in February 2023, the price underwent a consolidation on a key resistance level which corresponds to a multiple in the range between 10.6 and 10.8 times the net earnings per share (calculated over a rolling twelve-month period). Then, it marked a bounce and significantly decreased. The scenario repeated itself in July and December, indicating a market rejection of such a level of multiple. It can be interpreted that many fundamental analysts consider the stock overvalued as soon as it enters this zone, and that this justifies a sell position.
Conversely, in October 2022, the price marked a double rebound on the zone corresponding to a multiple range between 7.9 and 8.1, and then began a rally up to the February 2023 resistance. This range then again served as support in May and November, a sign that this level of multiple is an important signal of the stock's undervaluation.
Red rectangles correspond to PER between 10.6 and 10.8, while green corresponds to PER between 7.9 and 8.1. Source : xStation 5
Technical scenarios
In a context of a battle between buyers and sellers, fundamentally materialized by mixed earnings reports, and technically by a level of indecision in the 20-period daily RSI at 46.8, two scenarios seem to emerge and can corroborate a strategy for directional positioning.
The first scenario is bullish. The results could demonstrate a pause in the commercial expansion of STMicroelectronics after a particularly profitable year in 2022. It could then refocus its objectives and leverage its cost control, which affords it a more advantageous net margin than most of its competitors.
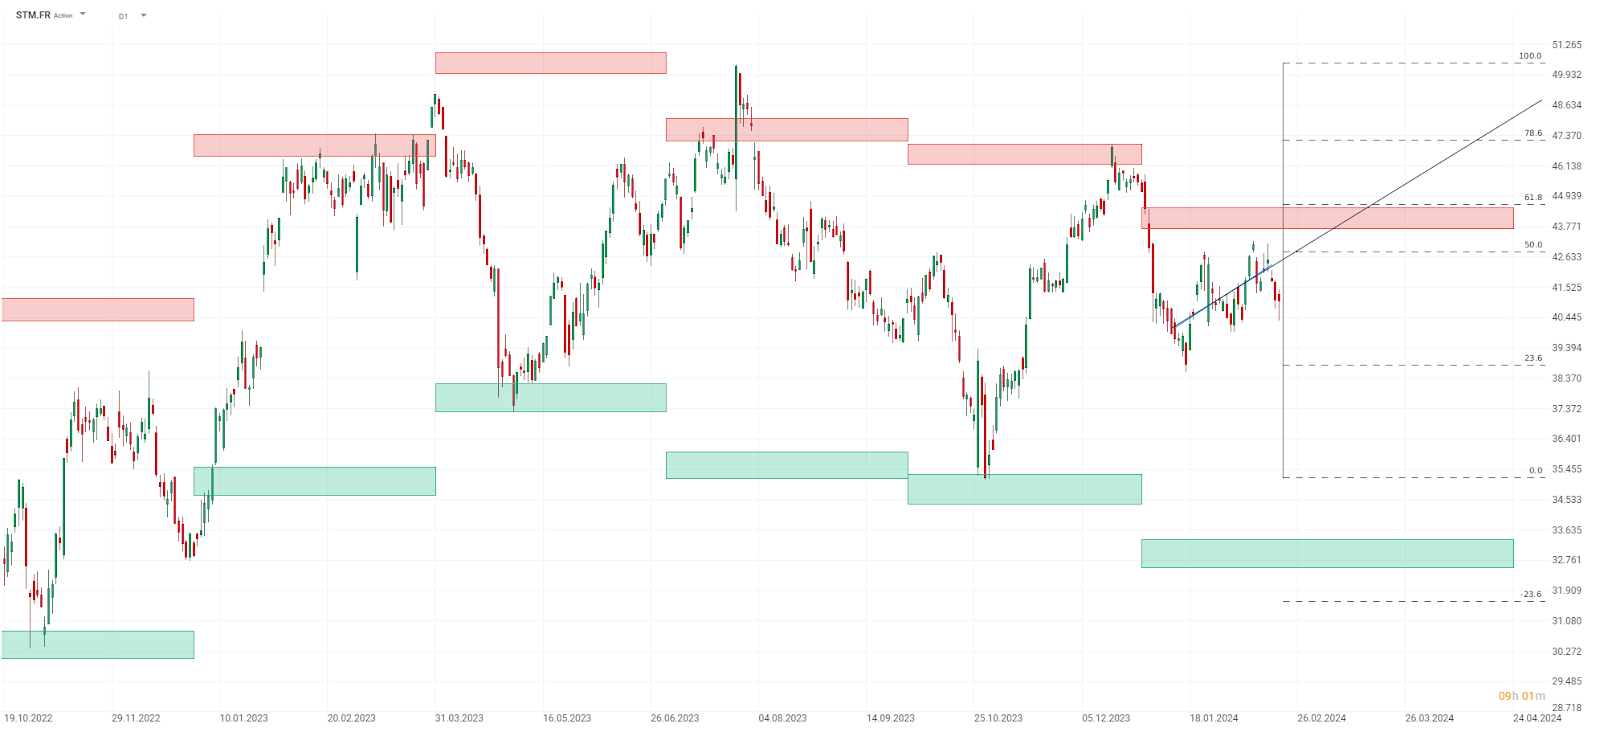
Following this hypothesis, the evolution of the stock price could be interpreted as a measured bullish movement that has slightly exceeded the golden zone under €40 (61.8-65% Fibonacci retracement threshold). The price would then follow a trajectory towards the €50 target (-23.6% threshold). A linear regression over the last 30 days allows us to anticipate reaching this target by the end of May.
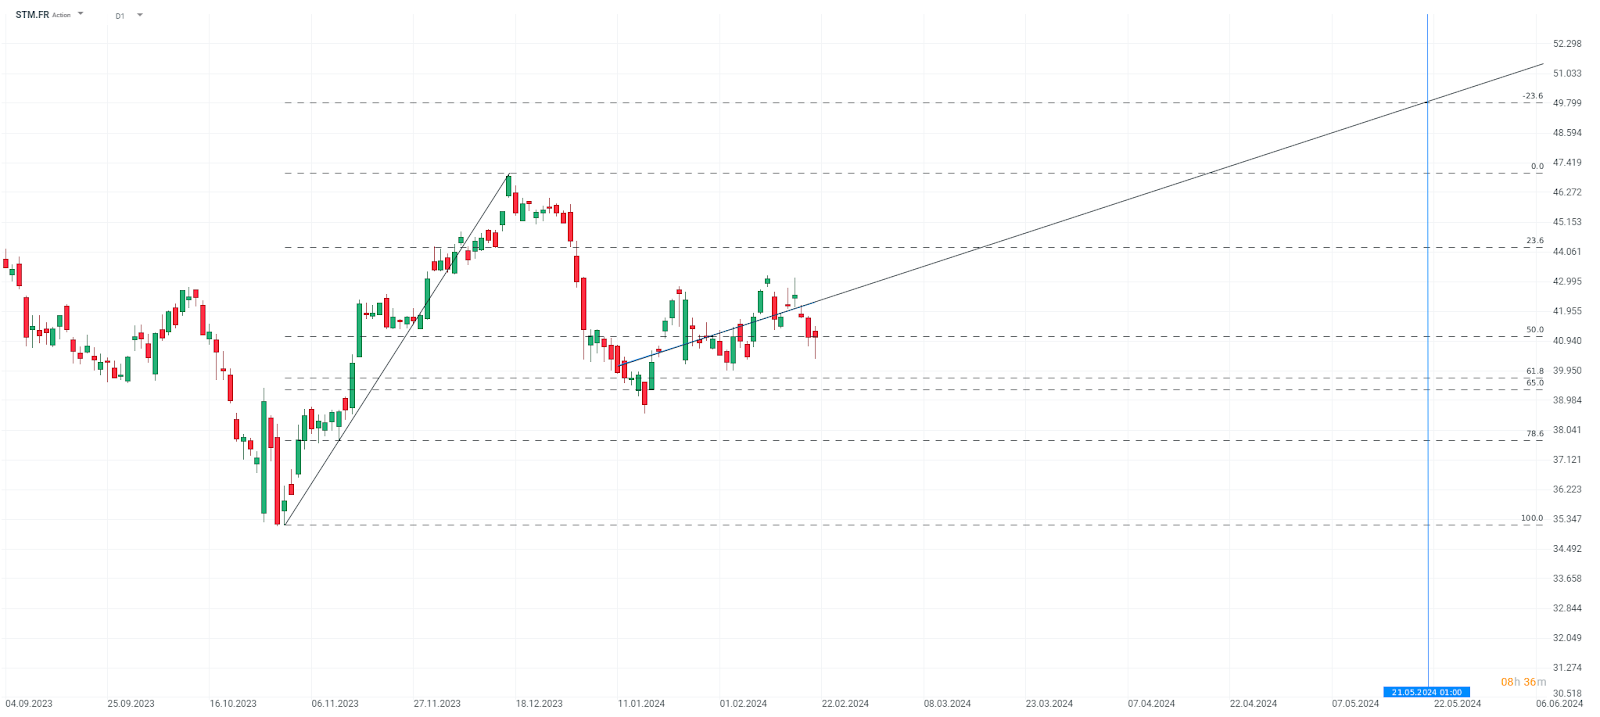
Source : xStation5
The second scenario, in contrast, is bearish. Intense competition against companies already positioned in strategic segments could explain the stifling of STMicroelectronics' growth, which has failed to meet forecasts. Intel, notably, has already experienced this scenario, resulting in a massive decline in its results since 2021.
Under such a premise, our study of the company's valuation through the P/E ratio (Price-to-Earnings Ratio) becomes crucial. Investors might wait for the stock price to enter an overvaluation zone in the range of €43.74 - €44.53 (red rectangle) to massively liquidate their positions. A measured bearish movement could then occur from this interval.
The first target, that of the trading algorithms, would be the -23.6% threshold, which corresponds to €36.64. The second target corresponds to the undervaluation zone in the range of €32.36 - €33.36 (green rectangle). A linear regression over 50 days projects reaching the first target by the beginning of April and the second by the end of May.
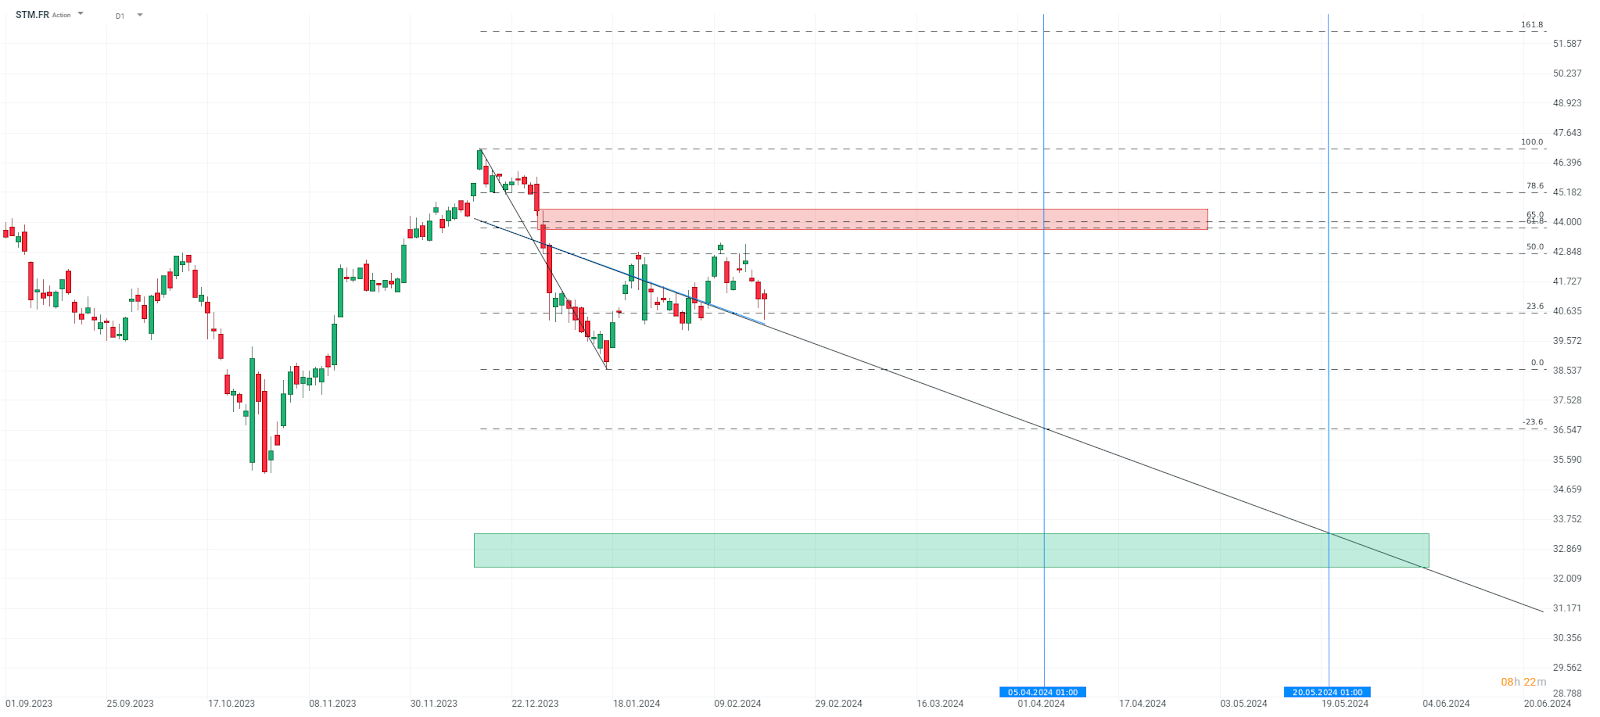
Source : xStation5

Daily Summary: Equities Diverge as Tech Lags, Europe Rallies on Earnings & PMIs (24.07.2026)

US OPEN: Nasdaq hits 1-month low! Geopolitics bring AI trade down!

Market Wrap: European Stocks Are Trying to Rebound as the Week Comes to an End💡

Alphabet shares are down 22% from their all-time high 🚩 Is Google ready to resume its bull run?
The content of this report has been created by XTB S.A., with its registered office in Warsaw, at Prosta 67, 00-838 Warsaw, Poland, (KRS number 0000217580) and supervised by Polish Supervision Authority ( No. DDM-M-4021-57-1/2005). This material is a marketing communication within the meaning of Art. 24 (3) of Directive 2014/65/EU of the European Parliament and of the Council of 15 May 2014 on markets in financial instruments and amending Directive 2002/92/EC and Directive 2011/61/EU (MiFID II). Marketing communication is not an investment recommendation or information recommending or suggesting an investment strategy within the meaning of Regulation (EU) No 596/2014 of the European Parliament and of the Council of 16 April 2014 on market abuse (market abuse regulation) and repealing Directive 2003/6/EC of the European Parliament and of the Council and Commission Directives 2003/124/EC, 2003/125/EC and 2004/72/EC and Commission Delegated Regulation (EU) 2016/958 of 9 March 2016 supplementing Regulation (EU) No 596/2014 of the European Parliament and of the Council with regard to regulatory technical standards for the technical arrangements for objective presentation of investment recommendations or other information recommending or suggesting an investment strategy and for disclosure of particular interests or indications of conflicts of interest or any other advice, including in the area of investment advisory, within the meaning of the Trading in Financial Instruments Act of 29 July 2005 (i.e. Journal of Laws 2019, item 875, as amended). The marketing communication is prepared with the highest diligence, objectivity, presents the facts known to the author on the date of preparation and is devoid of any evaluation elements. The marketing communication is prepared without considering the client’s needs, his individual financial situation and does not present any investment strategy in any way. The marketing communication does not constitute an offer of sale, offering, subscription, invitation to purchase, advertisement or promotion of any financial instruments. XTB S.A. is not liable for any client’s actions or omissions, in particular for the acquisition or disposal of financial instruments, undertaken on the basis of the information contained in this marketing communication. In the event that the marketing communication contains any information about any results regarding the financial instruments indicated therein, these do not constitute any guarantee or forecast regarding the future results.