
U.S. banks JP Morgan, Wells Fargo and Citigroup all reported higher-than-forecast results on the earnings per share and revenue side, with all three now gaining in pre-opening trading. Wells Fargo shares are trading nearly 3% higher, Citigroup is gaining nearly 2% and JP Morgan is adding about 1.5%.
JP Morgan (JPM.US)
In a commentary on the results, the bank's CEO, Jaimie Dimon noted in contrast to Wells Fargo's CEO commentary that US consumers remain very healthy - as does business health. At the same time, Dimon pointed to further rate increases in the US and the long-term effects of the QT program, which are unknown today, as the main risks. The bank reported an additional $1.1 billion in net income in Q3 as a result of the acquisition of First Republic. JP Morgan bought back $2 billion worth of treasury shares from the market in Q3. The bank estimates annual interest income of $88.5 billion vs. $87 billion previously estimated, and lowered estimated expenses to about $84 billion vs. $84.5 billion previously projected
- Revenues: $40.69 billion $39.92 billion forecast
- Earnings per share (EPS): $4.33 vs. $3.92 forecasts
- CET1: 14.3% vs. 14% forecasts
- Total loans: $1.31 trillion vs. $1.32 trillion forecasts
- Assets under management (AUM): $3.19 trillion vs. $3.53 trillion forecasts
- Loan loss provisions: $1.38 billion vs. $2.49 billion forecasts
- Revenue from selling and trading stocks: $2.07 billion vs $2.27 billion forecasts
- Revenues from sales and trading of fixed income assets, currencies and commodities (FICC): $4.51 billion vs. $4.36 billion forecasts
- Revenue from advisory services: $767 million vs. $593 million forecasts
- Investment and corporate banking fees: $1.72 billion vs. $1.56 billion forecasts
- Salary expenses: $11.73 billion vs $11.94 billion forecasts
- Realized investment losses: $669 million
- ROE: 18% vs. 16% forecasts
Wells Fargo (WFC.US)
Sale of $28 billion worth of 'private equity' investments in Q3 appeared to have minimal negative impact on the bank's net income. Results beat expectations but in a commentary CEO, Charles Scharf cited the bank's perceived slowdown in the economy pointing to worsening economic conditions among borrowers affecting the decline in loan balances.
- Revenues: $20.86 billion vs. $20.16 billion forecast (6.9% y/y increase)
- Earnings per share (EPS): $1.48 vs. $1.25 forecasts
- CET1: 11% vs. 10.7% forecasts
- Commercial banking revenue: $3.41 billion vs. $3.26 billion forecasts
- Investment banking profit:$4.92 billion vs. $4.08 billion forecasts
- Wealth management profit: $3.7 billion vs. $3.74 billion forecasts
- Interest income: $13.11 billion vs $12.75 billion forecasts
- Loan loss provisions: $1.2 billion vs $1.33 billion forecasts
- Total loans: $943 billion vs. $946 billion forecasts
- Total deposits: $1.34 trillion vs. $1.34 trillion forecasts
- ROE: 13.3 vs 10.6% forecasts
Citigroup (C.US)
Citigroup's stronger-than-forecast performance resulted primarily from a very strong Trading Desk result. The exchange and currency traders reported their best third quarter in eight years. FICC trading revenues rose 14% against 4% forecasts, while expenses came in lower than expected. At the same time, the bank reported that credit card loss dynamics increased in the third quarter signaling a weaker consumer. CFO Mark Mason said Citi intends to adjust the pace of share repurchases in future quarters and expects them to be 'modest' in Q4.
- Revenues: $20.14 billion vs. $19.15 billion forecasts
- Earnings per share (EPS): $1.63 vs. $1.23 forecasts
- CET1: 13.5% vs. 13.5% forecasts
- Investment banking profit: $844 million vs. $662 million forecasts (34% y/y increase)
- Total loans: UDS 666 billion vs. $661 billion forecasts
- Gains from sales and stock trading: $918 million vs $964 million forecasts
- Gains from sales and trading of fixed income assets, currencies and commodities: $3.56 billion vs. $3.25 billion.
- ROE: 6.7% vs. 5.2%
Stock chart of three banks
Looking at the stocks of the big three U.S. banks, both Wells Fargo (WFC.US, gold chart) and Citigroup (C.US, purple chart) have lost heavily in recent months to the momentum maintained by the stocks of the largest bank in the U.S., JP Morgan (JPM.US). It seems that currently Citigroup has the biggest 'loss to make up'.
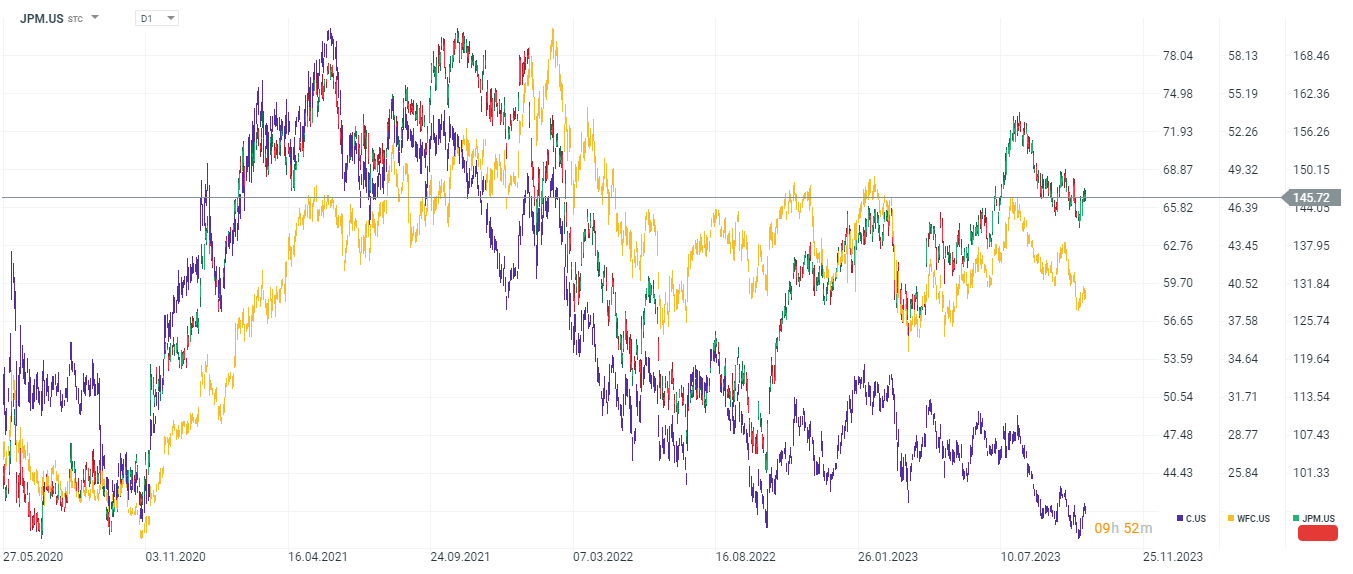
Source: xStation5

Meta Announces Its Own AI Chips. Is the Era of Full Dependence on NVIDIA Slowly Coming to an End?

Vodafone shares surge 13% after Xavier Niel's £4.4 billion investment. What's next for the stock?

🚩 Apollo Global warns on AI: Has the market become too optimistic?

Stock of the Week: Seagate Technology. How an old technology found a new role in the era of artificial intelligence
The content of this report has been created by XTB S.A., with its registered office in Warsaw, at Prosta 67, 00-838 Warsaw, Poland, (KRS number 0000217580) and supervised by Polish Supervision Authority ( No. DDM-M-4021-57-1/2005). This material is a marketing communication within the meaning of Art. 24 (3) of Directive 2014/65/EU of the European Parliament and of the Council of 15 May 2014 on markets in financial instruments and amending Directive 2002/92/EC and Directive 2011/61/EU (MiFID II). Marketing communication is not an investment recommendation or information recommending or suggesting an investment strategy within the meaning of Regulation (EU) No 596/2014 of the European Parliament and of the Council of 16 April 2014 on market abuse (market abuse regulation) and repealing Directive 2003/6/EC of the European Parliament and of the Council and Commission Directives 2003/124/EC, 2003/125/EC and 2004/72/EC and Commission Delegated Regulation (EU) 2016/958 of 9 March 2016 supplementing Regulation (EU) No 596/2014 of the European Parliament and of the Council with regard to regulatory technical standards for the technical arrangements for objective presentation of investment recommendations or other information recommending or suggesting an investment strategy and for disclosure of particular interests or indications of conflicts of interest or any other advice, including in the area of investment advisory, within the meaning of the Trading in Financial Instruments Act of 29 July 2005 (i.e. Journal of Laws 2019, item 875, as amended). The marketing communication is prepared with the highest diligence, objectivity, presents the facts known to the author on the date of preparation and is devoid of any evaluation elements. The marketing communication is prepared without considering the client’s needs, his individual financial situation and does not present any investment strategy in any way. The marketing communication does not constitute an offer of sale, offering, subscription, invitation to purchase, advertisement or promotion of any financial instruments. XTB S.A. is not liable for any client’s actions or omissions, in particular for the acquisition or disposal of financial instruments, undertaken on the basis of the information contained in this marketing communication. In the event that the marketing communication contains any information about any results regarding the financial instruments indicated therein, these do not constitute any guarantee or forecast regarding the future results.