



The Nasdaq 100 (US100) is recovering after its sharpest sell-off in the past 19 months, although Friday’s rebound does not change the fact that the market has entered a much more nervous and volatile phase. The main source of uncertainty remains AI infrastructure stocks, where investors have started to question the pace of further data-center expansion following the political shift in the US. At the same time, a strong labor-market report leaves less room for a more dovish turn from the Fed, keeping the cost of capital elevated for highly valued technology companies. Friday’s buying therefore looks more like an attempt to stabilize after a violent correction than a clear return of risk appetite.
-
The Nasdaq 100 is up around 2.5%, while the S&P 500 gains roughly 1.2% and the Dow Jones remains slightly lower. The rebound is concentrated mainly in technology and semiconductors, the segments hit hardest in the previous session — Nvidia is up more than 5%, while semiconductor stocks are also benefiting from strong sentiment following Lam Research’s update.
-
Thursday brought the steepest one-day declines in the major US indices since April 2025: the Nasdaq fell 5.5%, the S&P 500 dropped 4.4%, and the Dow lost more than 1,800 points. The Nasdaq ended the session more than 10% below its recent peak, formally entering correction territory.
-
The heaviest pressure was concentrated in companies linked to the AI boom, with the seven largest US technology stocks losing around $1 trillion in combined market capitalization in a single session. Friday’s rebound in Micron and Nvidia suggests that some investors have started buying the dip, although the scale of the preceding sell-off continues to highlight the risks associated with market concentration.
-
Investors have started to price in a slower pace of data-center construction following political changes in the US and rising regulatory pressure. That directly challenges the narrative underpinning elevated valuations across chipmakers, infrastructure suppliers and parts of the hyperscaler universe.
-
The labor-market report was significantly stronger than expected: nonfarm payrolls increased by 165,000, while the unemployment rate fell to 4.1%. The data reduce pressure on the Fed to ease policy quickly and could keep Treasury yields elevated, creating an additional headwind for growth stocks.
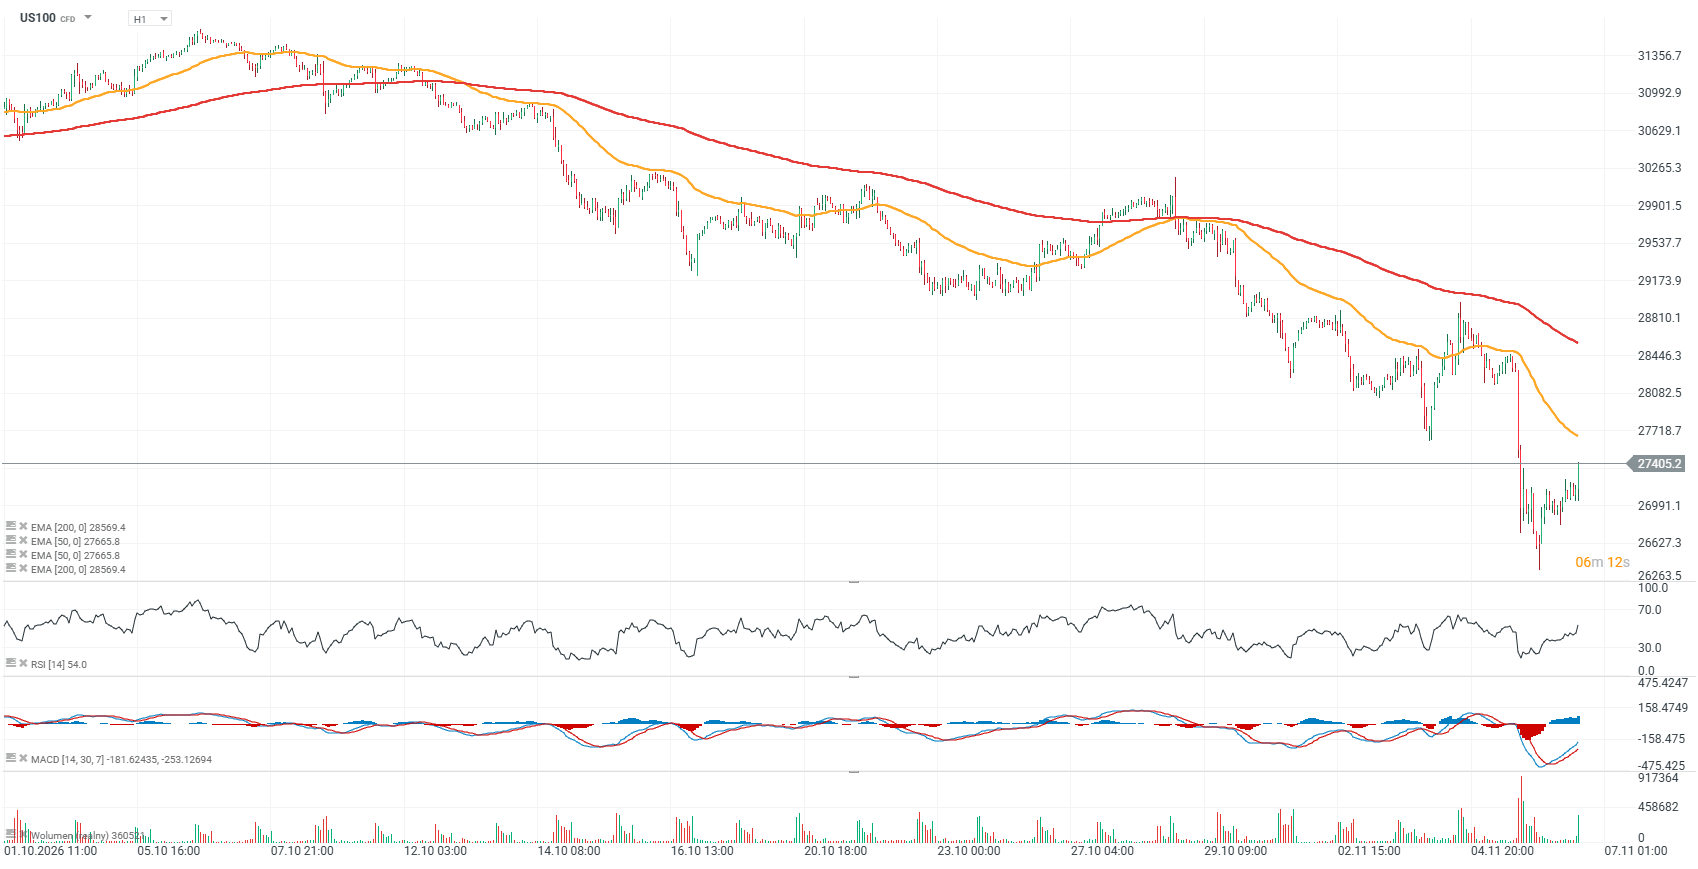
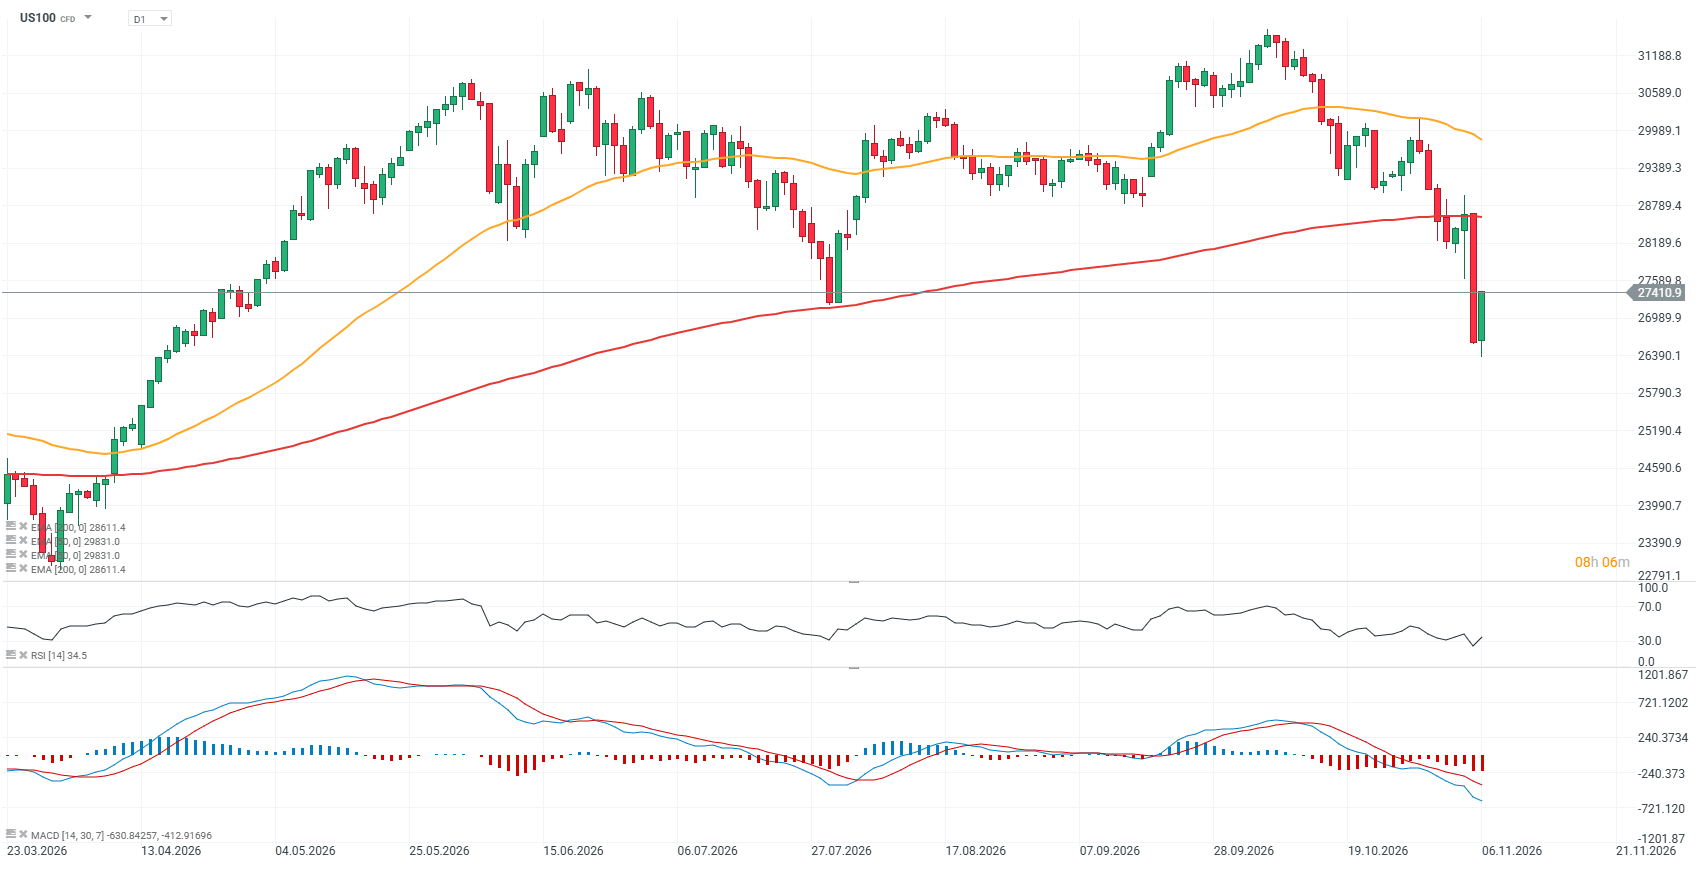
US100 chart (H1, D1 timeframes)
The Nasdaq 100 futures contract has approached the 50-period EMA (orange line), but the outlook for a broader improvement in sentiment remains uncertain despite the rebound taking place on elevated volume. In the short term, the 27,600–27,700 area appears to be the key resistance zone, while the low from yesterday’s sell-off near 27,200 points remains the main support.
Source: xStation5
On the broader daily timeframe, the Nasdaq 100 futures contract is trading close to the lows seen during the July sell-off, but has moved below the 200-day EMA (red line), potentially increasing the risk of a medium- to long-term trend reversal. A sustained recovery above 28,600 points, where the red moving average is located, is now the key resistance level and upside objective for bulls.
Source: xStation5
Lam Research jumps after announcing share buyback. Can semiconductors regain momentum?
Lam Research is up more than 10% following the sharp sell-off across the semiconductor sector, with investors responding positively to a new $25 billion share repurchase authorization and a quarterly dividend of $0.33 per share. The rebound is part of a broader stabilization attempt across chip stocks after the Philadelphia Semiconductor Index suffered its worst session since March 2020.
-
Lam Research’s board authorized the new share repurchase program, which investors interpreted as a strong signal of management’s confidence in the company’s long-term value.
-
The company also declared a quarterly cash dividend of $0.33 per share, reinforcing the narrative of strong cash generation and management’s willingness to return capital to shareholders.
-
LYNX Equity Strategies argues that demand for memory and NAND manufacturing equipment in Asia remains more resilient than the sharp post-election market reaction would suggest.
-
Needham, Mizuho and Morgan Stanley maintained constructive views on Lam Research despite lowering their price targets, while the broader analyst consensus remains clearly positive.
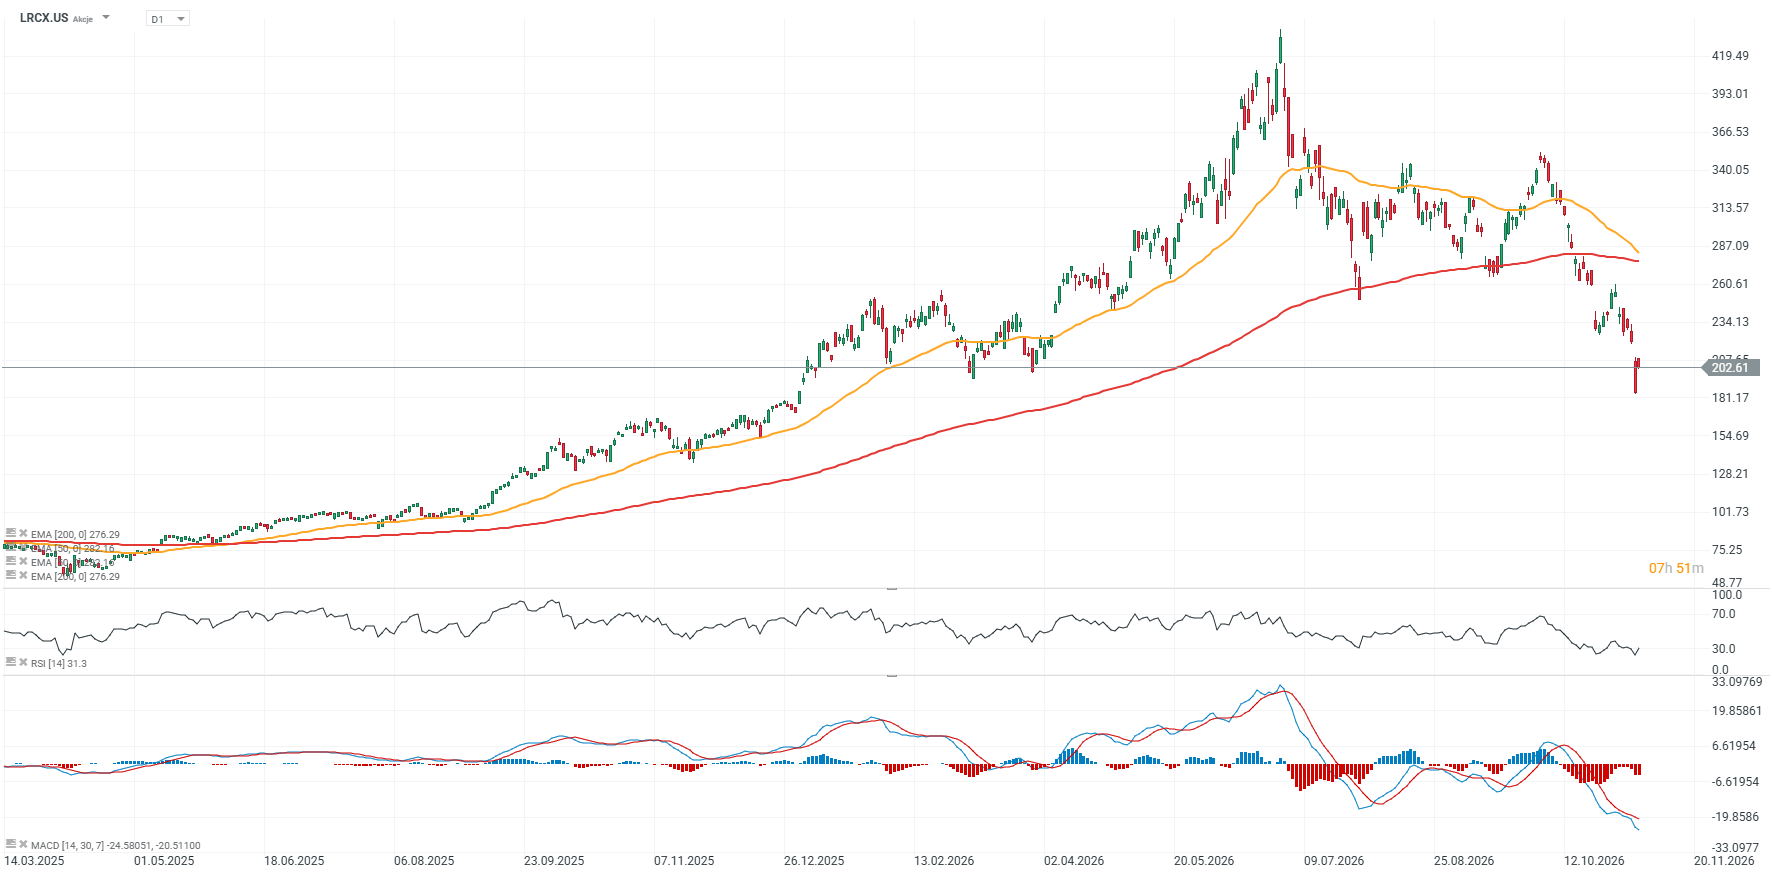
Lam Research (LRCX.US) chart, D1 timeframe
Despite continued business growth and improving fundamentals, the stock has fallen around 25% below its 200-day EMA (red line). The key resistance level is currently around $260, reinforced by previous price reactions, while support is located near $180 per share.
 Source: xStation5
Moderna gains after quarterly results
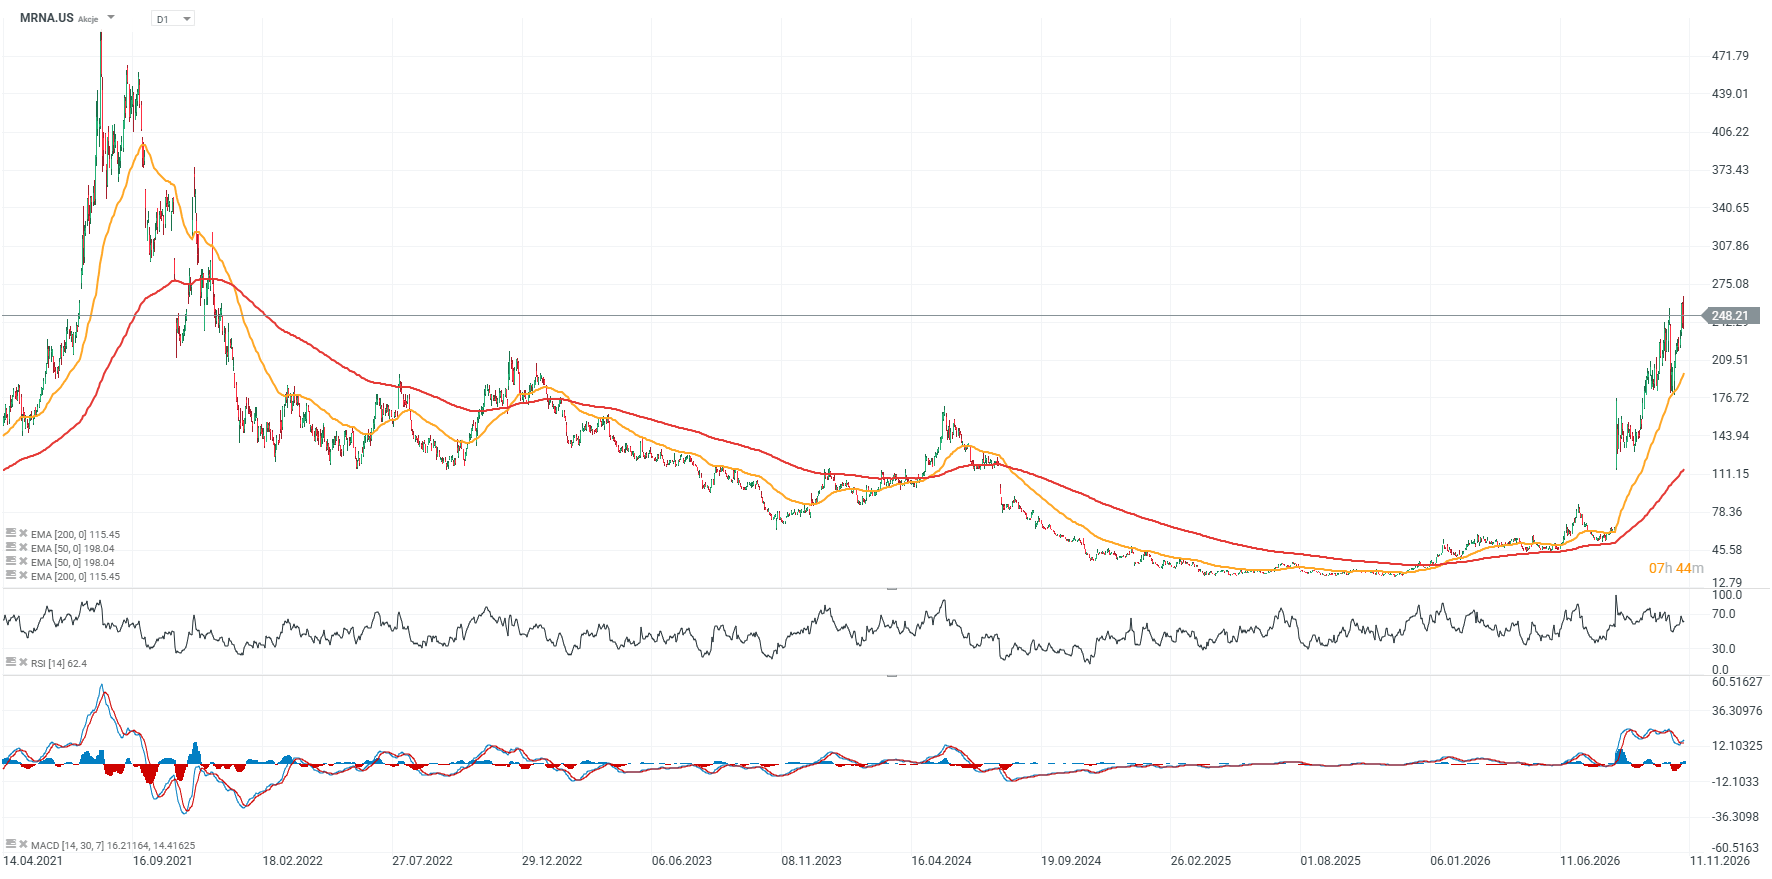
Moderna (MRNA.US) is up nearly 4% after third-quarter results came in well above expectations and the company raised its 2026 revenue growth outlook to 15–25%, compared with its previous forecast of no more than 10%. The company benefited primarily from stronger COVID-19 vaccine sales outside the US while simultaneously reducing research and development spending. Another positive catalyst was the upgrade to both full-year sales expectations and the projected year-end cash balance.
-
Adjusted EPS came in at $0.38, compared with market expectations for a loss of $1.09 per share.
-
Revenue increased 29% year over year to $1.31 billion, well above the consensus estimate of approximately $892 million.
-
US sales totaled $780 million, while international markets contributed $533 million in revenue.
-
The main driver of growth was stronger COVID-19 vaccine deliveries outside the US, including shipments under long-term government supply agreements.
-
Moderna generated net income of $162 million, compared with a $200 million net loss a year earlier, highlighting a significant improvement in profitability.
-
Research and development expenses fell 27% to $583 million, supporting operating performance and reducing the pace of cash burn.
The company raised its full-year 2026 revenue growth outlook to 15–25%, compared with its previous expectation of growth of no more than 10%. Moderna also increased its projected year-end cash balance to $8.1–8.3 billion from the previous range of $4.7–5.2 billion, materially strengthening its liquidity position.
Moderna simultaneously lowered its expected 2026 R&D spending to approximately $2.7 billion from $2.9 billion previously. Beyond the financial results, pipeline progress remains an additional positive catalyst: the FDA approved the company’s mFLUSIVA influenza vaccine, while intismeran delivered positive Phase 3 results in melanoma. For investors, the key question now is whether Moderna can sustain improving margins and cost discipline while successfully diversifying its business beyond COVID-19 vaccines.
Moderna (MRNA.US) share price chart, D1 timeframe
 Source: xStation5


OIL loses after reaching $100 📉Is Iran reviewing a change to its nuclear program?


🚩 EURUSD loses 0.6%


BREAKING: US NFP much stronger than expected 📈 US Dollar and treasuries yields surge


Market Wrap: Weak Europe, AI Debt, and Awaiting US Data
The content of this report has been created by XTB S.A., with its registered office in Warsaw, at Prosta 67, 00-838 Warsaw, Poland, (KRS number 0000217580) and supervised by Polish Supervision Authority ( No. DDM-M-4021-57-1/2005). This material is a marketing communication within the meaning of Art. 24 (3) of Directive 2014/65/EU of the European Parliament and of the Council of 15 May 2014 on markets in financial instruments and amending Directive 2002/92/EC and Directive 2011/61/EU (MiFID II). Marketing communication is not an investment recommendation or information recommending or suggesting an investment strategy within the meaning of Regulation (EU) No 596/2014 of the European Parliament and of the Council of 16 April 2014 on market abuse (market abuse regulation) and repealing Directive 2003/6/EC of the European Parliament and of the Council and Commission Directives 2003/124/EC, 2003/125/EC and 2004/72/EC and Commission Delegated Regulation (EU) 2016/958 of 9 March 2016 supplementing Regulation (EU) No 596/2014 of the European Parliament and of the Council with regard to regulatory technical standards for the technical arrangements for objective presentation of investment recommendations or other information recommending or suggesting an investment strategy and for disclosure of particular interests or indications of conflicts of interest or any other advice, including in the area of investment advisory, within the meaning of the Trading in Financial Instruments Act of 29 July 2005 (i.e. Journal of Laws 2019, item 875, as amended). The marketing communication is prepared with the highest diligence, objectivity, presents the facts known to the author on the date of preparation and is devoid of any evaluation elements. The marketing communication is prepared without considering the client’s needs, his individual financial situation and does not present any investment strategy in any way. The marketing communication does not constitute an offer of sale, offering, subscription, invitation to purchase, advertisement or promotion of any financial instruments. XTB S.A. is not liable for any client’s actions or omissions, in particular for the acquisition or disposal of financial instruments, undertaken on the basis of the information contained in this marketing communication. In the event that the marketing communication contains any information about any results regarding the financial instruments indicated therein, these do not constitute any guarantee or forecast regarding the future results.