



Global financial markets face heightened volatility as investors navigate a dense calendar of economic data and diverging Big Tech earnings. US index futures edged higher, driven by contrasting hyperscaler performance. Nasdaq 100 futures lead the rally (US100: +3.3%), followed by S&P 500 (US500: +1.4%), Russell 2000 (US2000: +1.2%) and DJIA (US30: +0.6%).
Microsoft surged on strong Azure growth and restrained capital expenditure, while Meta tumbled over weak guidance and ballooning AI costs. With earnings from Apple and Amazon on deck, market sentiment remains cautious amid Treasury yield swings and persistent scrutiny over AI returns.
Nasdaq is led by surging semiconductor and tech hardware stocks, with Lam Research (+19.2%), Sandisk (+16.4%), and Applied Materials (+10.2%) posting massive gains alongside Microsoft (+14.7%). On the downside, Alnylam Pharmaceuticals plunged 23.4%, while Meta Platforms dropped 9.5%, leading losses among software and communications names including Workday (-7.3%) and Adobe (-5.0%).
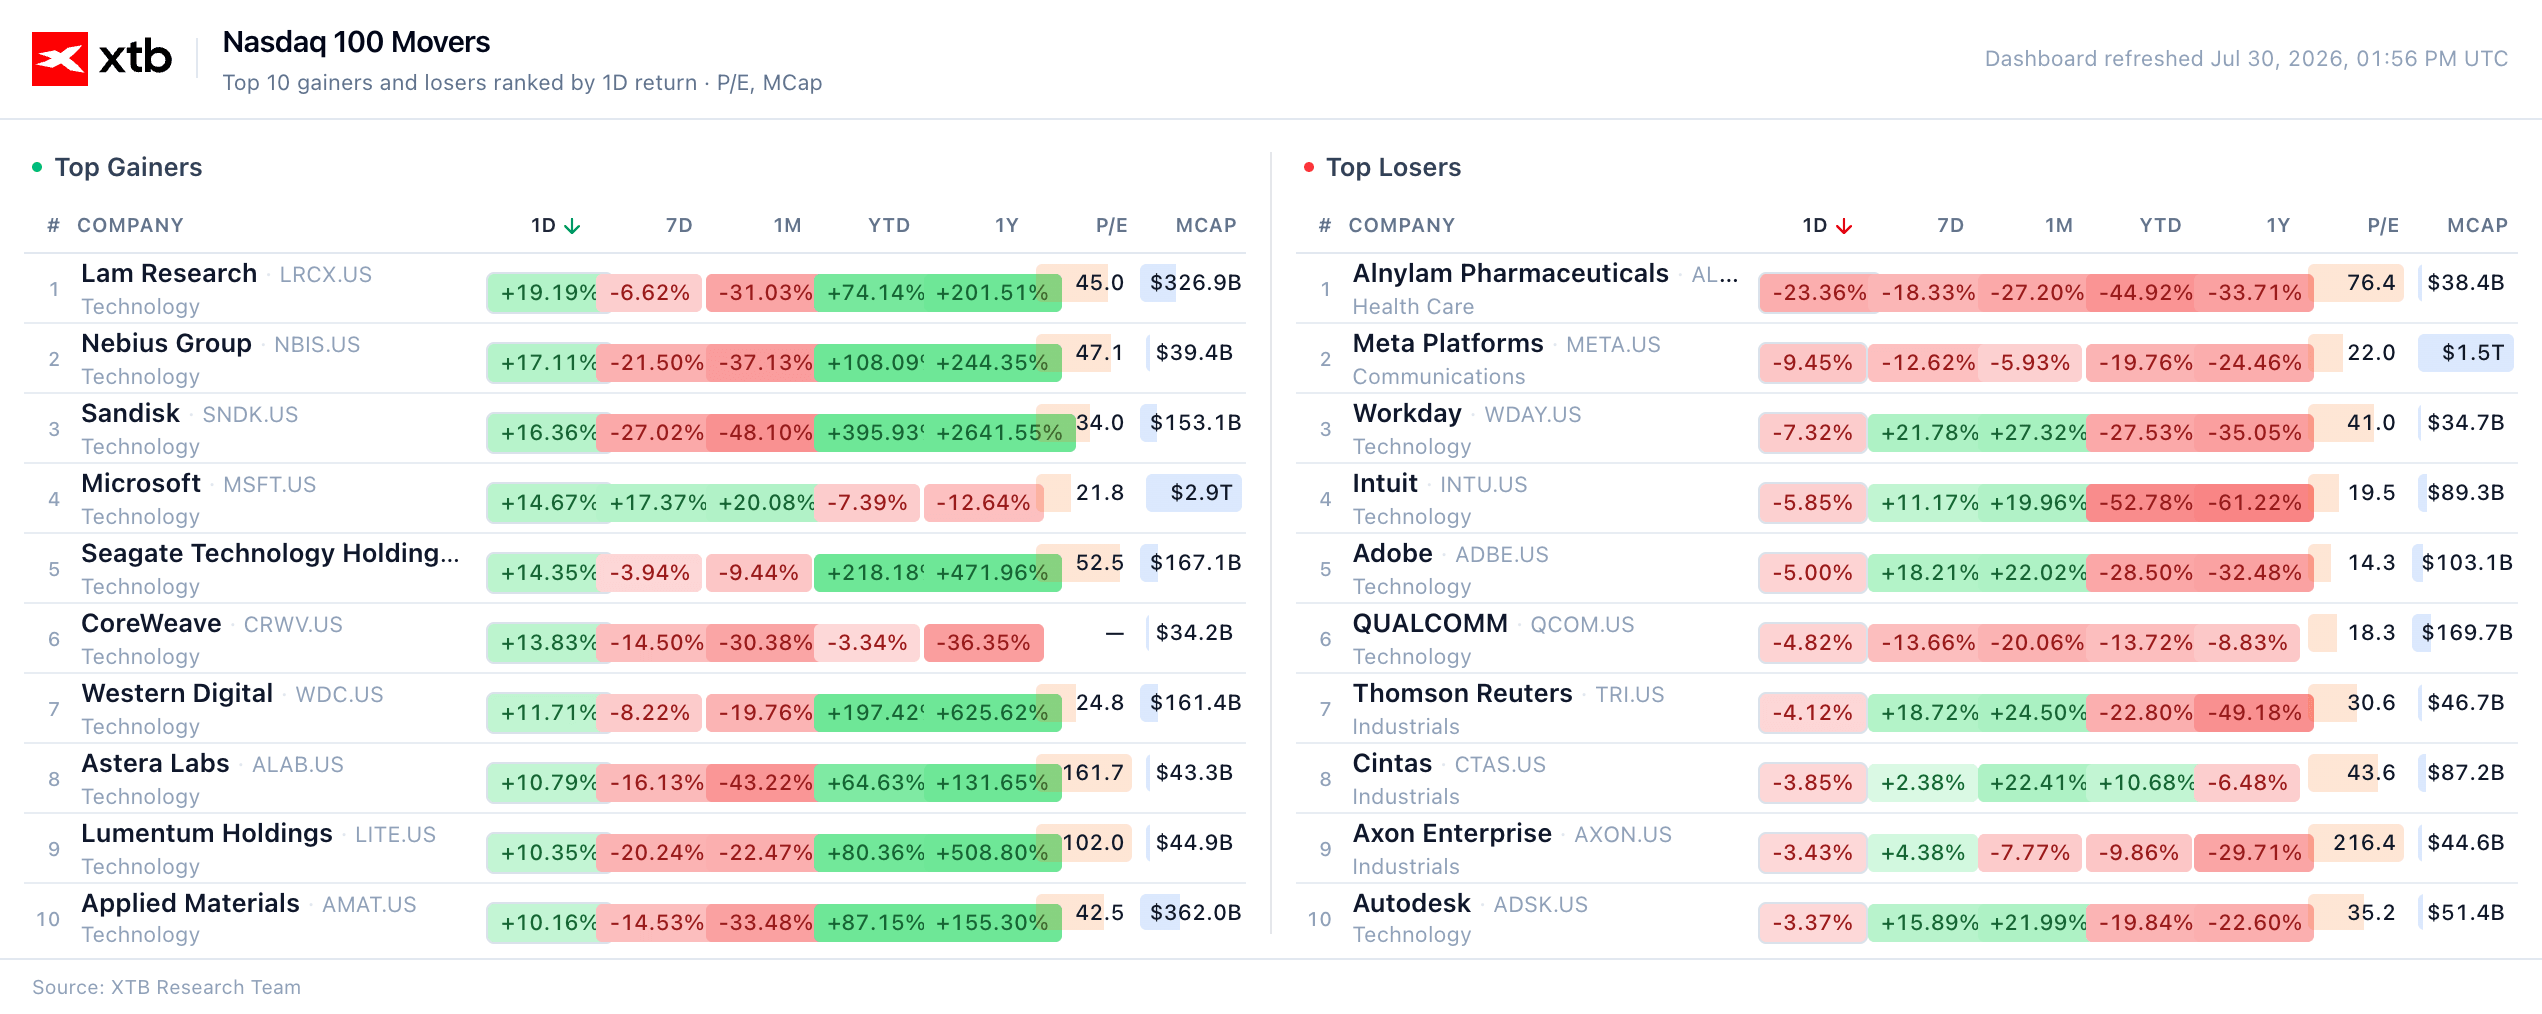
Source: XTB Research
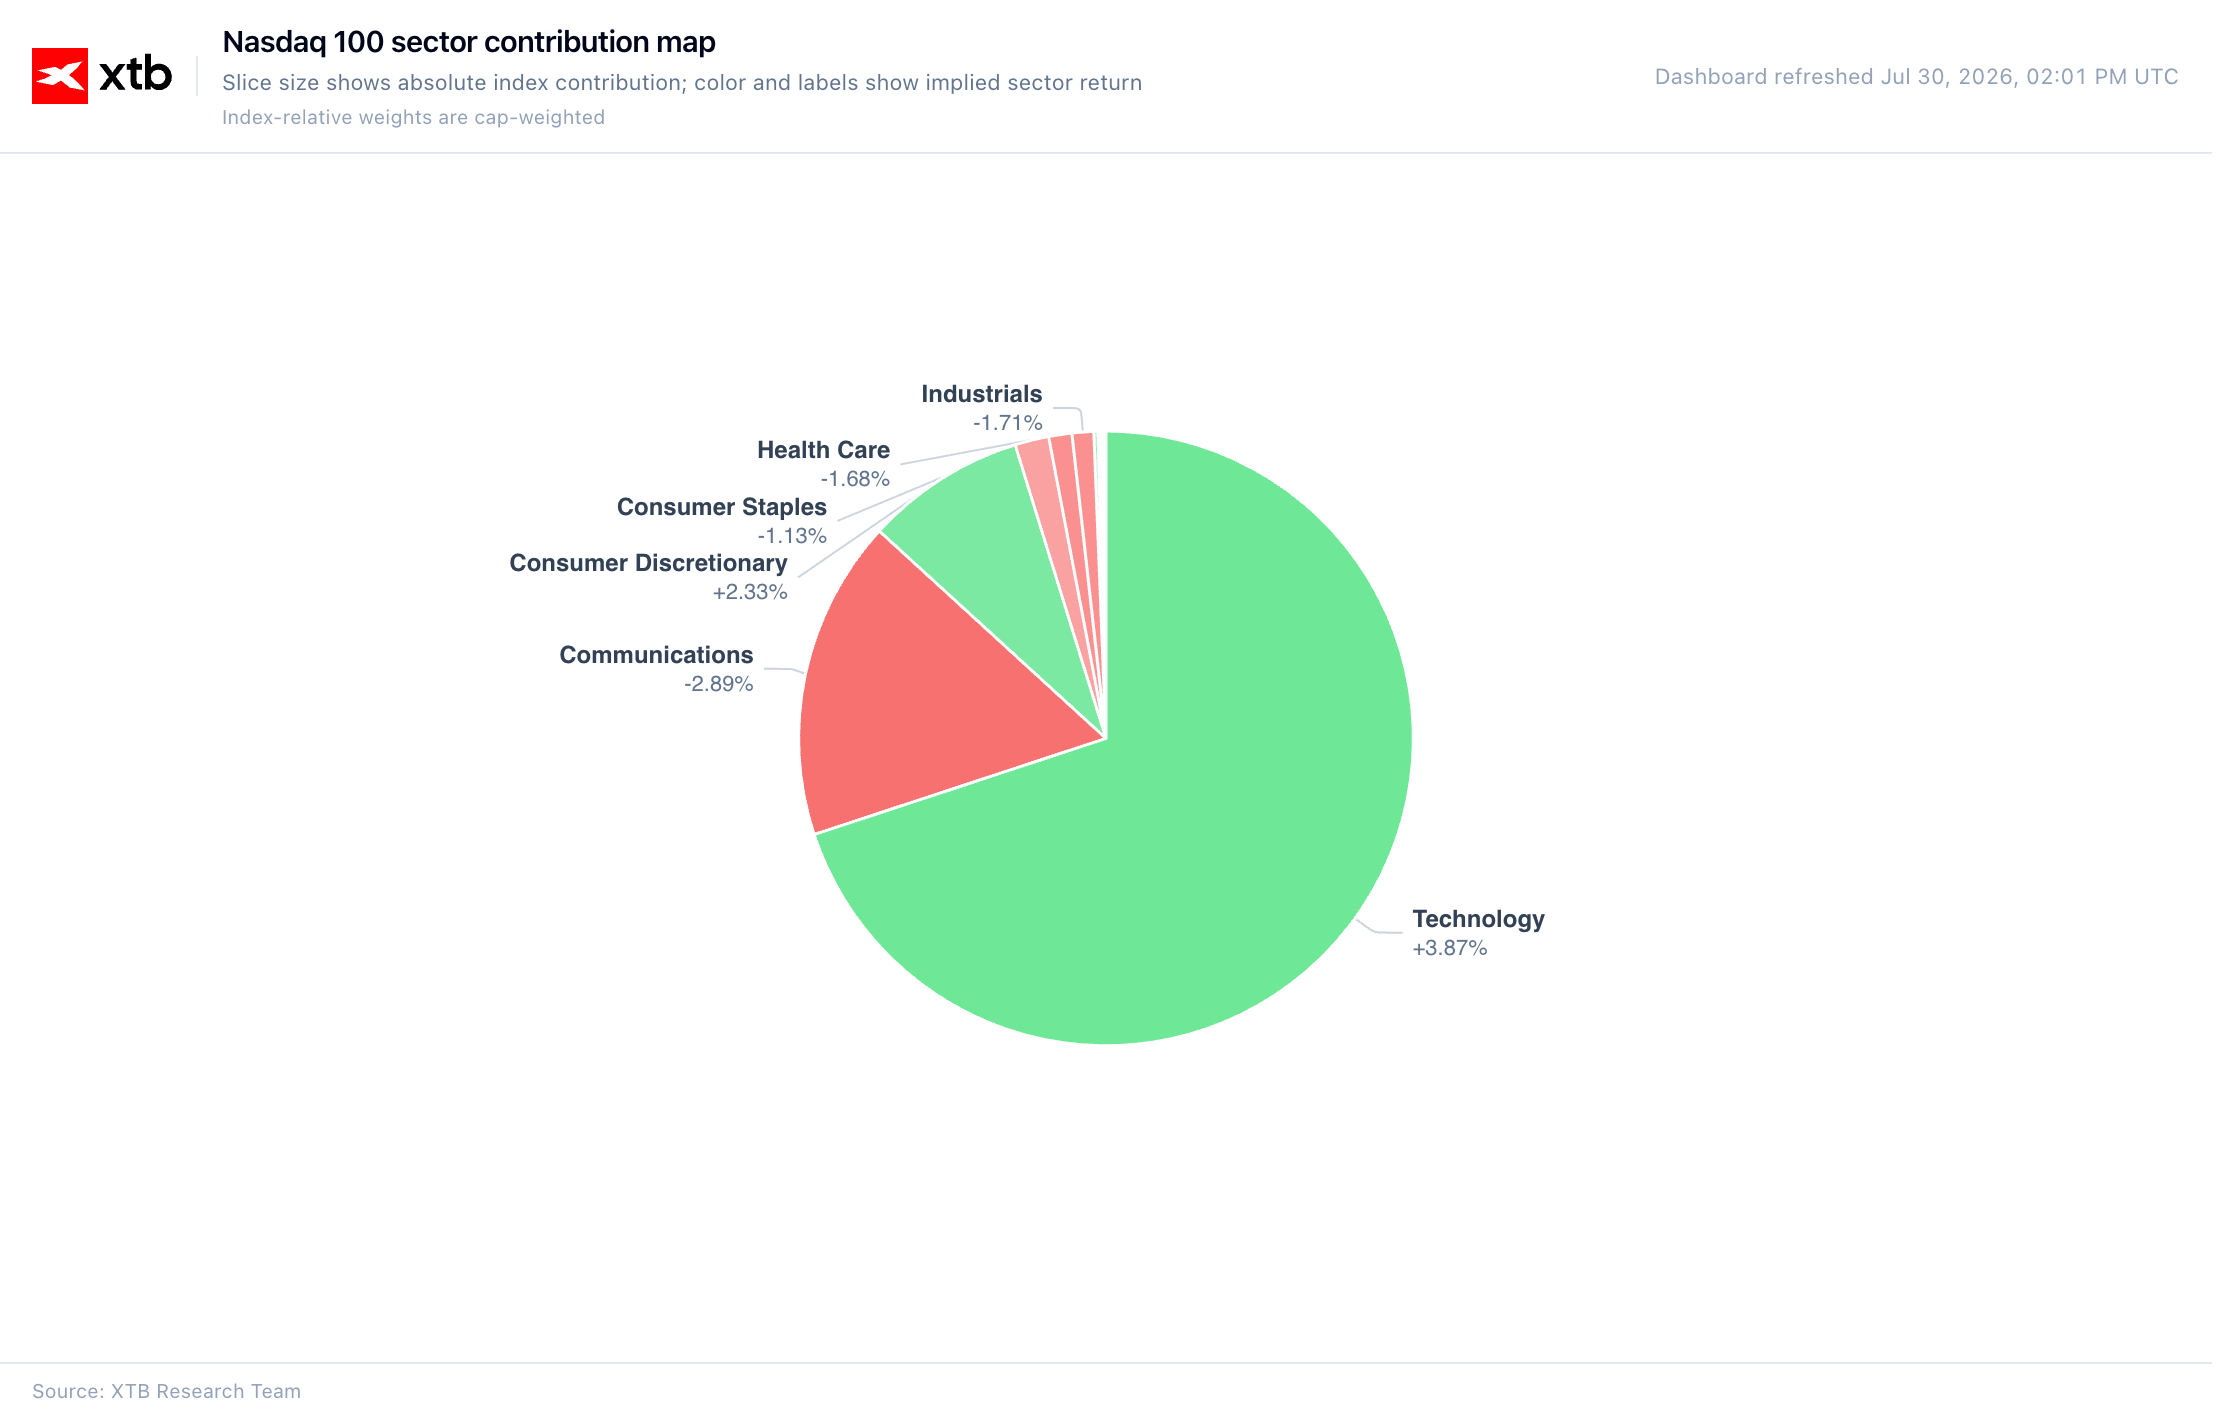
Source: XTB Research
US Macro: GDP slows down
In the second quarter of 2026, the US economy grew at a slower pace than expected, expanding by 1.5% on an annualised basis, as the Iran war weighed on confidence in the world’s largest economy. According to the BEA report, the slowdown was driven mainly by a decline in exports and government spending, as well as weaker business investment. Personal consumption also fell short of expectations, with US consumers continuing to feel the pressure from elevated fuel prices. The Core PCE numbers, Fed's preferred inflation measure, slightly missed the expectations (the monthly reading came in lower than expected, pointing to a milder, short-term inflationary pressure).
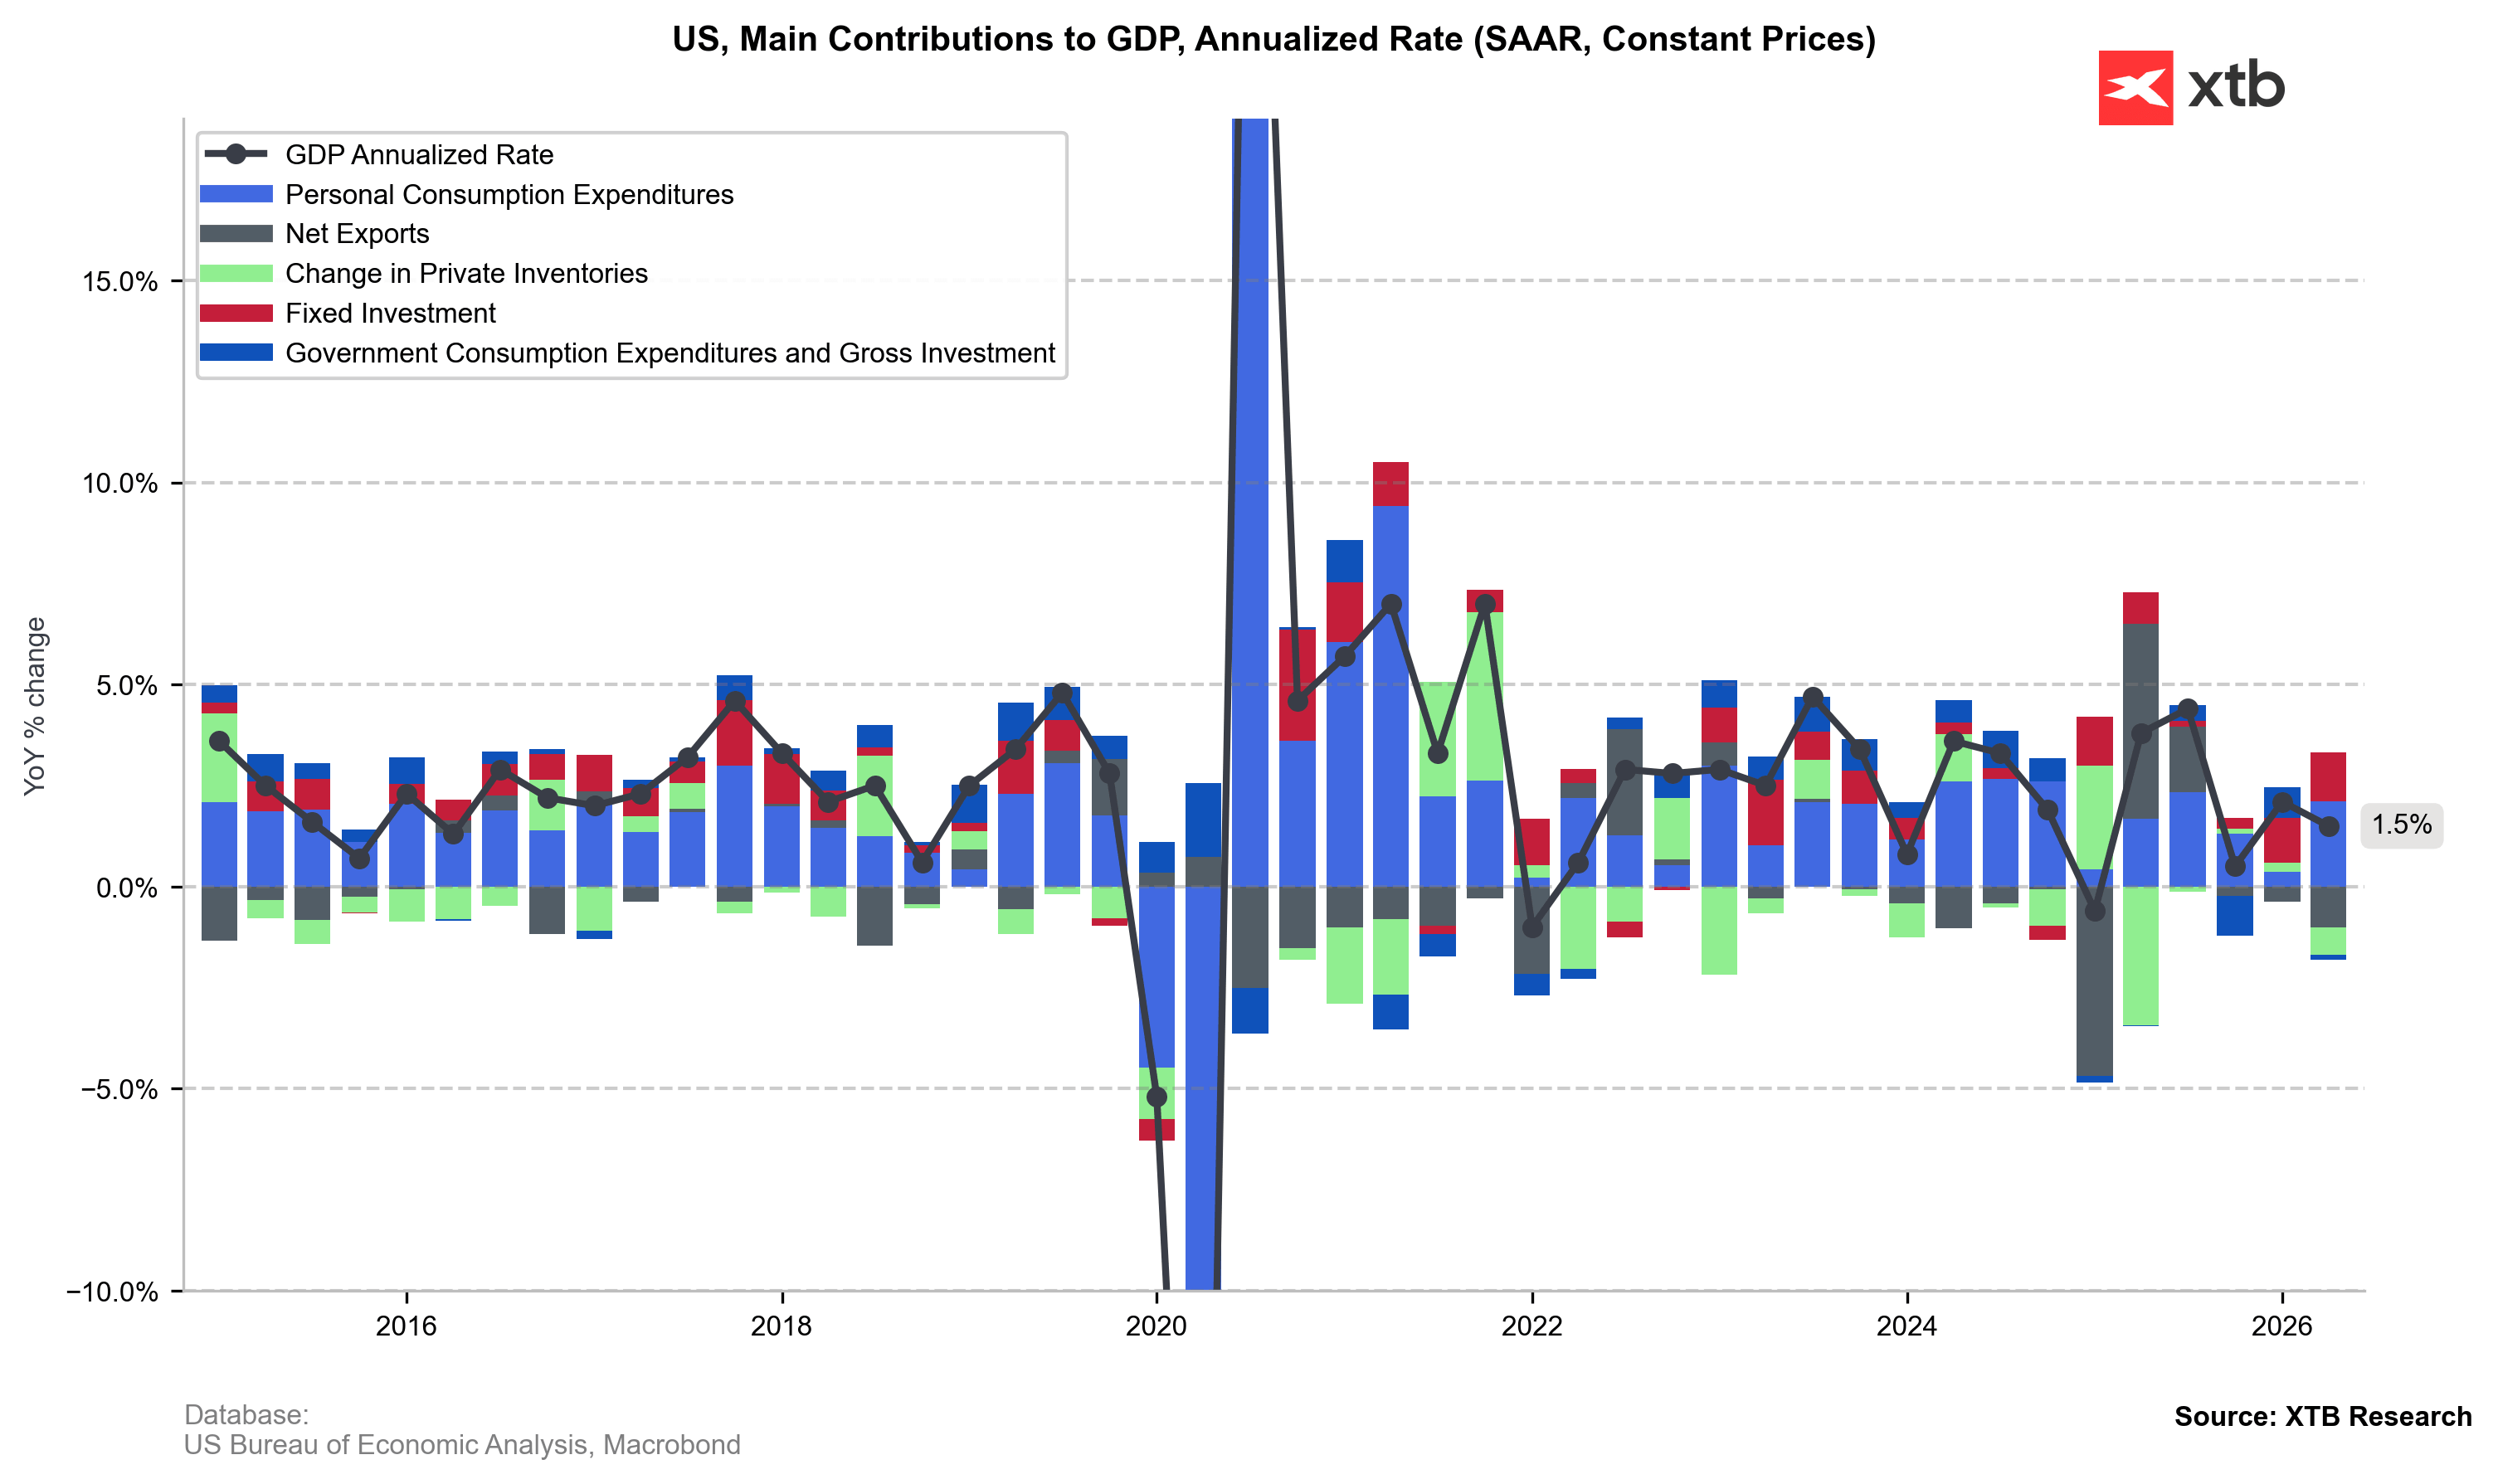
Source: XTB Research, Macrobond
Technical Analysis: US100 (Nasdaq 100 Futures)
Nasdaq 100 futures (US100) are attempting a recovery after a sharp sell-off pushed prices below the critical 100-day EMA (~28,275) and the 28,410 horizontal support (0.0% Fibonacci level). The index found temporary demand near 27,600, while the RSI at 41.2 reflects lingering bearish pressure despite early signs of stabilization.
For bulls, reclaiming the 28,275–28,410 resistance zone is essential to open the door toward the 23.6% Fibo level (28,966) and the 30-day EMA (~29,036). Conversely, a failure to break back above the 100-day EMA leaves US100 vulnerable to renewed selling toward 27,600 and deeper support around 26,860.
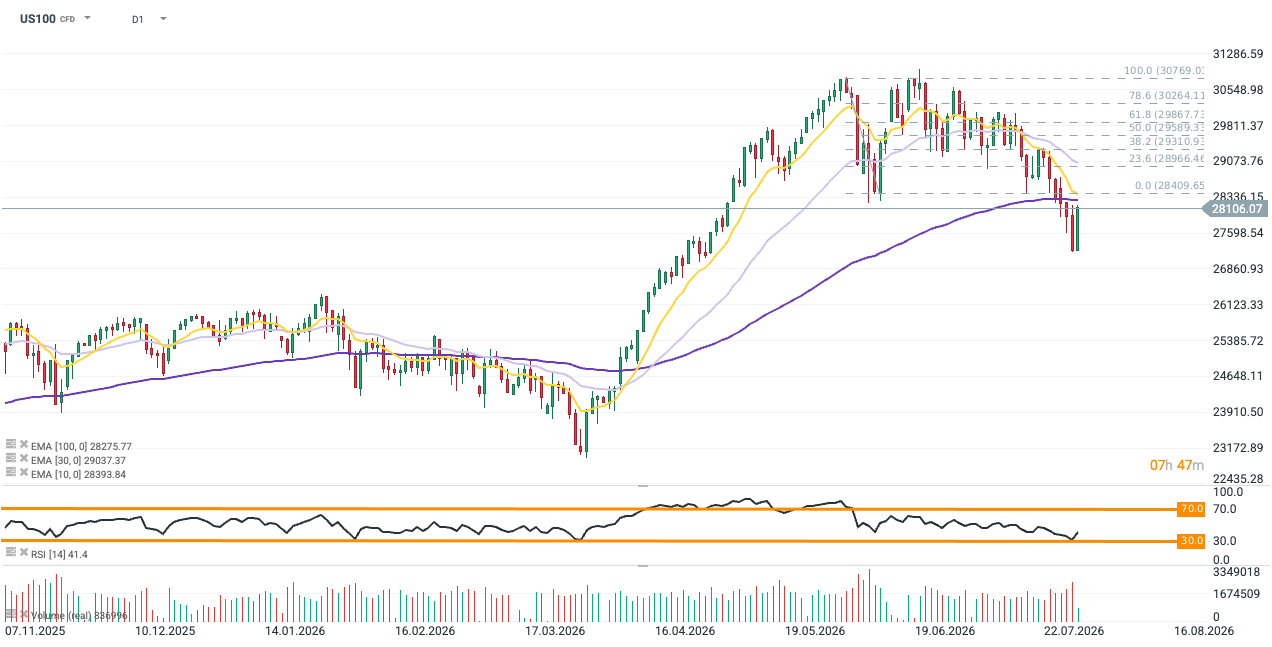
Source: xStation5
Company News
-
Microsoft (MSFT): Shares jumped 14% after Q4 revenue ($90.01B vs $87.72B est) and EPS ($4.81 vs $4.25 est) beat expectations. Azure cloud growth accelerated to 43% YoY, surpassing $100B in annual revenue. Investors were further reassured as full-year capex guidance was lowered to ~$175B from $190B due to accounting adjustments.
-
Meta Platforms (META): Shares tumbled 9% following a soft Q3 revenue outlook ($61B–$64B) and an increased low-end for FY capex guidance ($130B–$145B). Q2 revenue grew 28% YoY to $60.8B, but EPS fell to $6.18, weighed down by $2.4B in legal charges and $1.18B in severance costs.
-
Lam Research (LRCX): Shares surged 20% after Q4 results beat expectations, with revenue climbing 30% YoY to $6.72 billion (vs. $6.68B est) and adjusted EPS reaching $1.82 (vs. $1.70 est). Strong customer support revenue (+43% YoY) helped bolster margins. Looking ahead, Q1 adjusted EPS guidance of $2.00–$2.30 comfortably cleared Wall Street estimates of $1.84.
-
Starbucks (SBUX): Shares are up 1.5% after raising full-year adjusted EPS guidance ($2.55–$2.65 vs $2.39 est). Q3 US same-store sales jumped 7.9%, driving total revenue to $9.3B (vs $9.16B est), supported by menu innovations and loyalty program tweaks.
-
Baxter International (BAX): Shares surged nearly 17% following strong Q2 results (adjusted EPS $0.56 vs $0.37 est; revenue $2.96B vs $2.8B est). Management raised its full-year EPS outlook to $1.95–$2.15, boosted by operational execution and a tariff refund.
-
Crocs (CROX): Shares plunged 12% on a weak Q3 adjusted EPS forecast ($3.20–$3.30 vs $3.53 est), despite Q2 results beating estimates with revenue at $1.18B. Management raised full-year EPS guidance ($13.70–$14.00) and expanded its share buyback program to ~$2B.
-
Robinhood Markets (HOOD): Shares are down 1.8% despite Q2 revenue ($1.31B) and EPS ($0.62 vs $0.44 est) beating expectations. Strong options, equities, and prediction market trading offset a 38% YoY drop in crypto revenue, while full-year operating expense guidance was lowered.


Chart of the Day: US100 (Nasdaq 100). Rebound in AI trade vs. weakening technical picture



Macro Calendar - UK Labor Market, ZEW Sentiment, and Wall Street Giants' Reports



📈Morning Brefieng: AI sector rebound collides with still-expensive oil (20.10.2026)


Daily Summary: Nasdaq and AI Stocks Rebound Ahead of Big Tech Earnings 🚀
The content of this report has been created by XTB S.A., with its registered office in Warsaw, at Prosta 67, 00-838 Warsaw, Poland, (KRS number 0000217580) and supervised by Polish Supervision Authority ( No. DDM-M-4021-57-1/2005). This material is a marketing communication within the meaning of Art. 24 (3) of Directive 2014/65/EU of the European Parliament and of the Council of 15 May 2014 on markets in financial instruments and amending Directive 2002/92/EC and Directive 2011/61/EU (MiFID II). Marketing communication is not an investment recommendation or information recommending or suggesting an investment strategy within the meaning of Regulation (EU) No 596/2014 of the European Parliament and of the Council of 16 April 2014 on market abuse (market abuse regulation) and repealing Directive 2003/6/EC of the European Parliament and of the Council and Commission Directives 2003/124/EC, 2003/125/EC and 2004/72/EC and Commission Delegated Regulation (EU) 2016/958 of 9 March 2016 supplementing Regulation (EU) No 596/2014 of the European Parliament and of the Council with regard to regulatory technical standards for the technical arrangements for objective presentation of investment recommendations or other information recommending or suggesting an investment strategy and for disclosure of particular interests or indications of conflicts of interest or any other advice, including in the area of investment advisory, within the meaning of the Trading in Financial Instruments Act of 29 July 2005 (i.e. Journal of Laws 2019, item 875, as amended). The marketing communication is prepared with the highest diligence, objectivity, presents the facts known to the author on the date of preparation and is devoid of any evaluation elements. The marketing communication is prepared without considering the client’s needs, his individual financial situation and does not present any investment strategy in any way. The marketing communication does not constitute an offer of sale, offering, subscription, invitation to purchase, advertisement or promotion of any financial instruments. XTB S.A. is not liable for any client’s actions or omissions, in particular for the acquisition or disposal of financial instruments, undertaken on the basis of the information contained in this marketing communication. In the event that the marketing communication contains any information about any results regarding the financial instruments indicated therein, these do not constitute any guarantee or forecast regarding the future results.