



The Q3 2026 earnings season highlights strong profit growth among US companies, with earnings momentum increasingly shifting towards smaller constituents of the S&P 500. The high proportion of companies beating expectations and improving earnings estimates across most sectors support the market's fundamental outlook, although the overall magnitude of positive earnings surprises remains relatively modest.
-
As of October 30, 60% of S&P 500 companies had reported their quarterly results. Among those companies, 82% exceeded earnings-per-share (EPS) expectations, while 70% beat revenue forecasts, indicating that positive earnings surprises have been relatively widespread.
-
The blended year-over-year earnings growth rate for the S&P 500 currently stands at 30.2%. This figure combines actual results from companies that have already reported with consensus estimates for those yet to release earnings. If sustained, it would mark the third consecutive quarter of earnings growth exceeding 25%.
-
The current earnings growth rate is 1.1 percentage points higher than the 29.1% expected on September 30. Eight sectors are now reporting higher earnings growth than initially anticipated at the end of September, supported by positive earnings surprises and upward revisions to EPS estimates.
-
Among the 47 companies that have issued EPS guidance for Q4, 28 provided forecasts above analysts' expectations, while 19 issued guidance below consensus. This positive balance is an encouraging signal for the upcoming quarter, although it still represents a relatively small proportion of the index.
-
The S&P 500 is currently trading at 18.7 times expected earnings over the next 12 months, compared with a five-year average of 19.8 and a ten-year average of 19.1. This places valuations below both historical benchmarks, although the discount to the ten-year average is only around 2.1%.
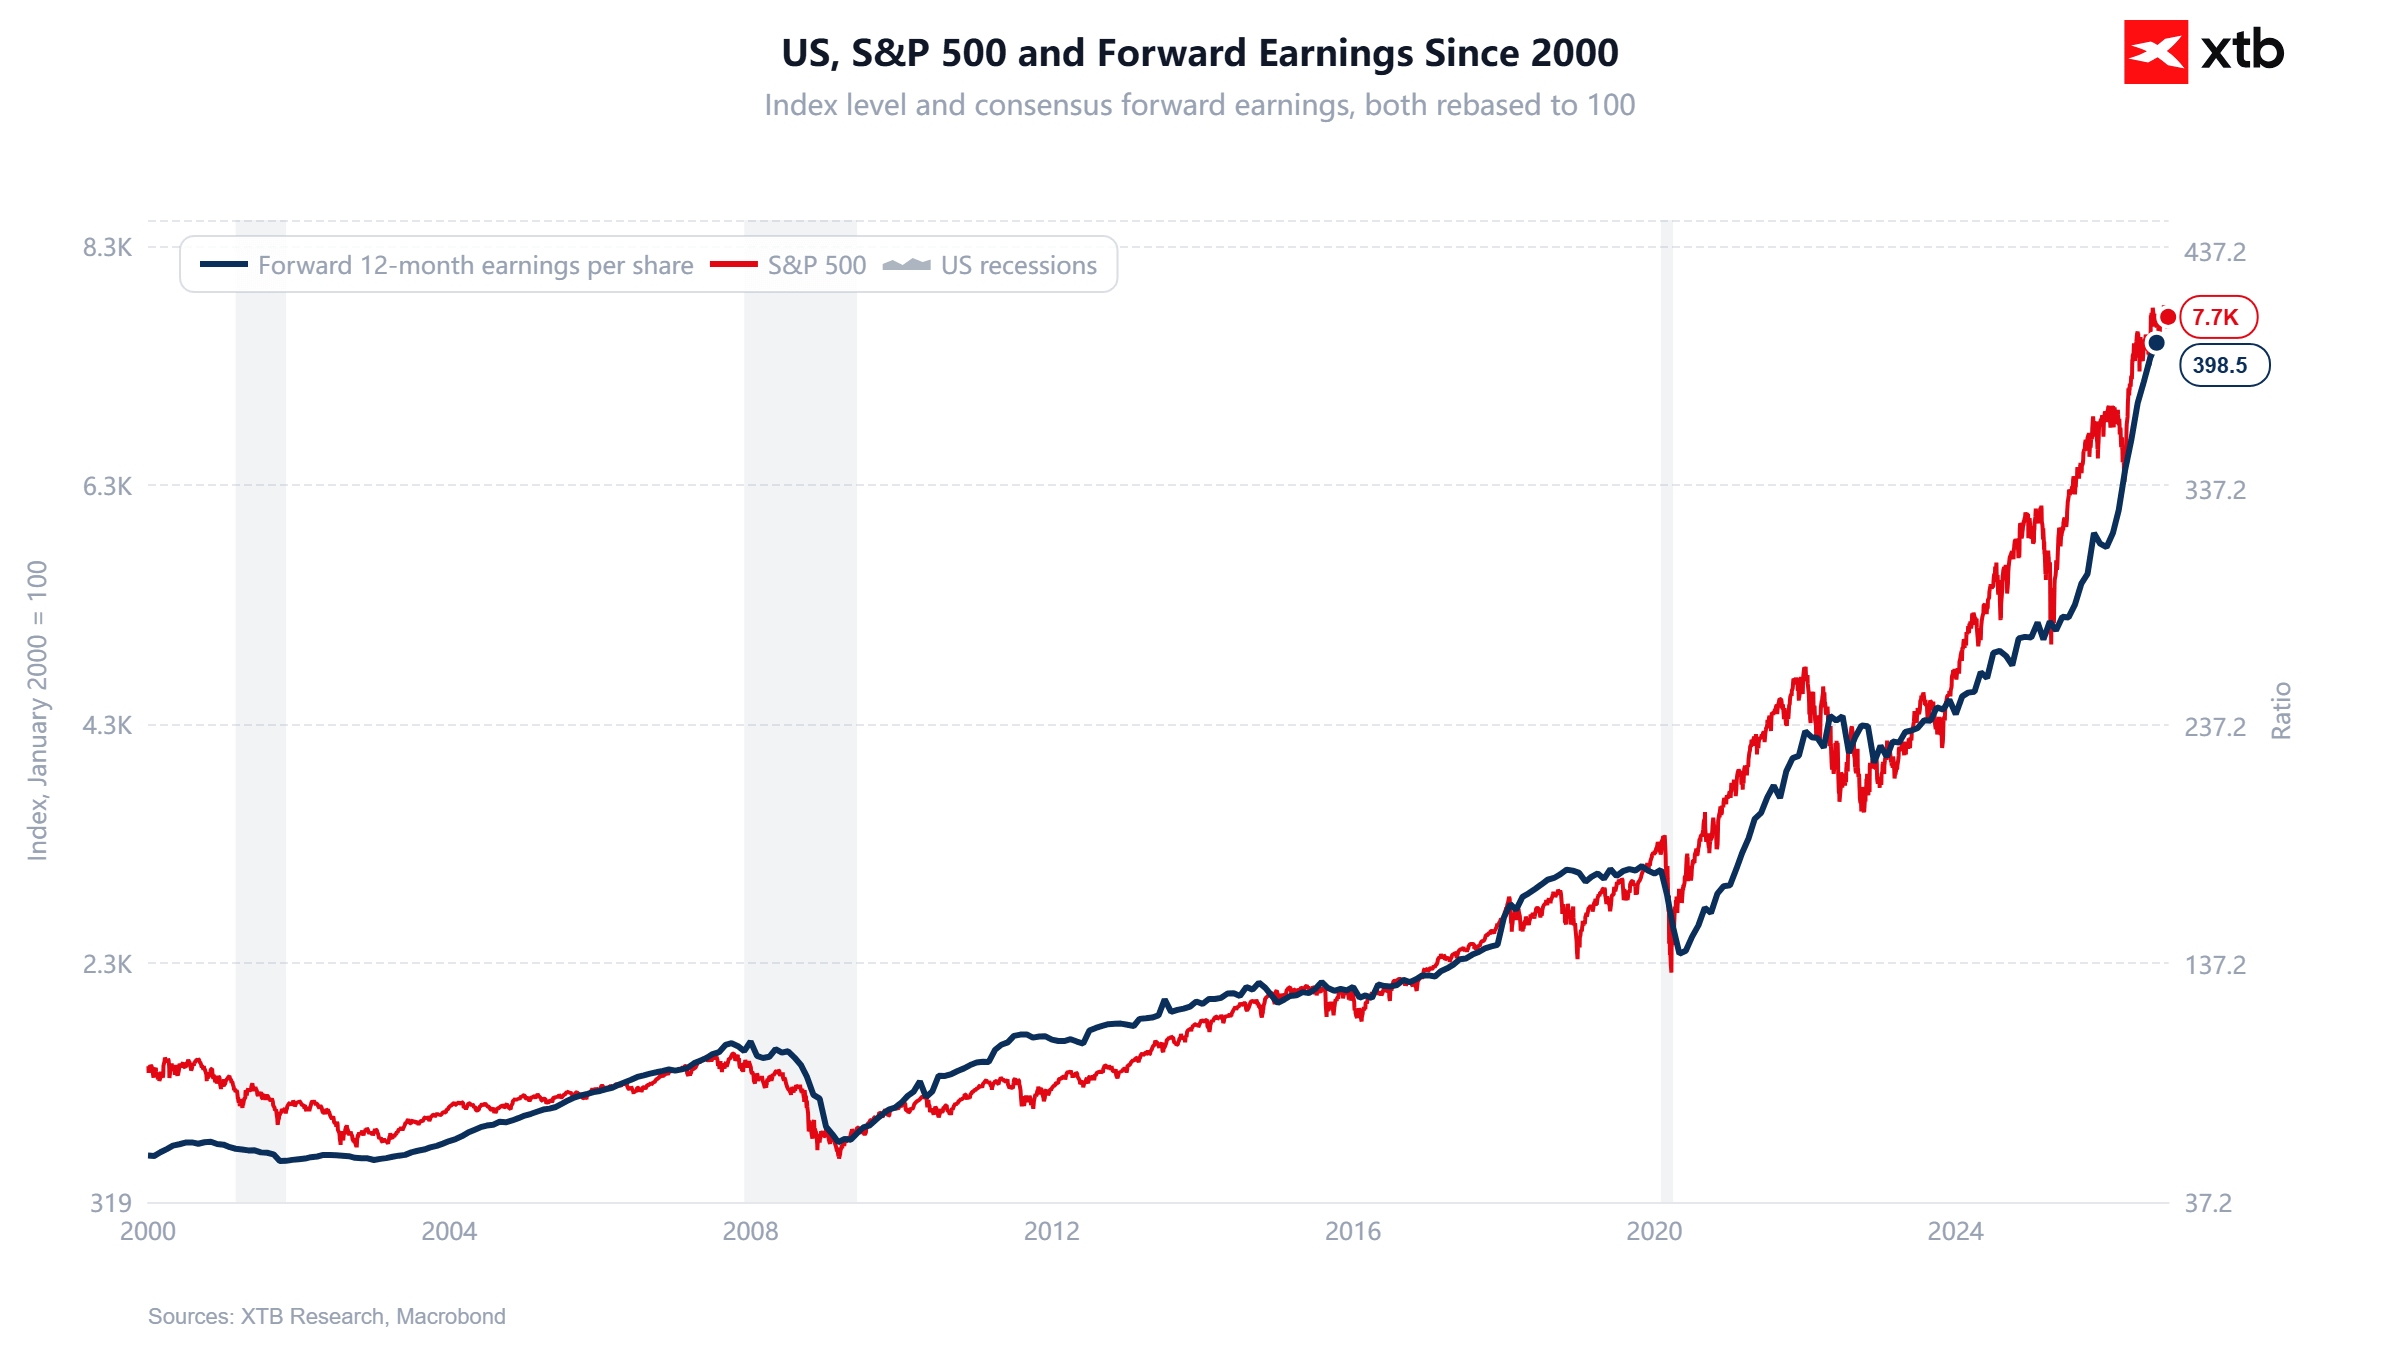
Over the long term, the S&P 500 has exhibited a strong relationship with expected corporate earnings, confirming that profit growth remains one of the fundamental drivers of Wall Street bull markets. Since 2023, both the index and forward 12-month earnings per share (EPS) have accelerated significantly, reaching historically high levels despite periodic corrections and elevated volatility. The S&P 500 currently stands above the level suggested by the historical relationship between the two series, highlighting the importance of valuations and investor expectations while increasing the market's sensitivity to potential downward revisions to earnings forecasts.
Source: XTB Research
Magnificent Seven loses its earnings growth advantage
The most important shift concerns the relationship between the largest technology companies and the rest of the index. The blended earnings growth rate for the Magnificent Seven in Q3 has declined from 33.6%, as expected on September 30, to 22.6%, while the growth rate for the remaining 493 companies has increased from 27.8% to 32.6%. The rest of the index now holds a 10-percentage-point advantage, pointing to a significant shift in the composition of earnings growth.
The difference is also visible when comparing actual results with market expectations. Of the five Magnificent Seven companies that have already reported, only two exceeded consensus EPS estimates, while their aggregate earnings came in 14.7% below expectations. By comparison, the aggregate earnings surprise for all reporting S&P 500 companies stands at positive 1.9%. This is an important distinction: a high percentage of positive earnings surprises does not necessarily translate into a substantial aggregate earnings beat, as disappointments from a handful of large companies can weigh heavily on the index's overall results.
If this relationship holds through the end of the earnings season, the Magnificent Seven will record weaker earnings growth than the remaining S&P 500 companies for the first time since Q4 2022. Consensus estimates for Q4 2026 also point to an advantage for the other 493 companies, with expected earnings growth of 30.8%, compared with 22.6% for the Magnificent Seven. This supports the view that earnings growth is becoming more broadly distributed across the market. However, at the time of the report, Apple and NVIDIA had yet to publish their results, which could still materially change the final comparison.
Do earnings quality and valuations require reassessment?
Comparing the two groups is complicated by the impact of accounting items included in the GAAP earnings of Alphabet, Amazon and Meta. Alphabet's Q3 2026 results were affected by an $8.7 billion loss related to equity investments, while Meta recorded a $9.89 billion charge associated with a legal settlement. Amazon, meanwhile, faces a challenging year-over-year comparison, as its Q3 2025 results included a $9.5 billion pre-tax gain from its investment in Anthropic.
The impact of these items means that assessing the financial health of the largest companies requires a separate examination of their underlying operations, operating margins and cash flow generation. Weaker reported earnings growth can coexist with rising revenue and improving performance across key business segments. At the same time, earnings adjustments should be applied consistently: excluding an extraordinary charge from adjusted earnings does not eliminate its economic significance for shareholders.
The S&P 500's valuation below historical averages provides some fundamental support, but the relatively small discount to the ten-year average weakens the argument that the market is significantly undervalued. The forward P/E ratio remains dependent on earnings forecasts: downward revisions would push the multiple higher even if share prices remained unchanged. For the current positive earnings backdrop to remain sustainable, investors will need confirmation that profit growth outside the Magnificent Seven is translating into recurring improvements in operating performance and cash generation.
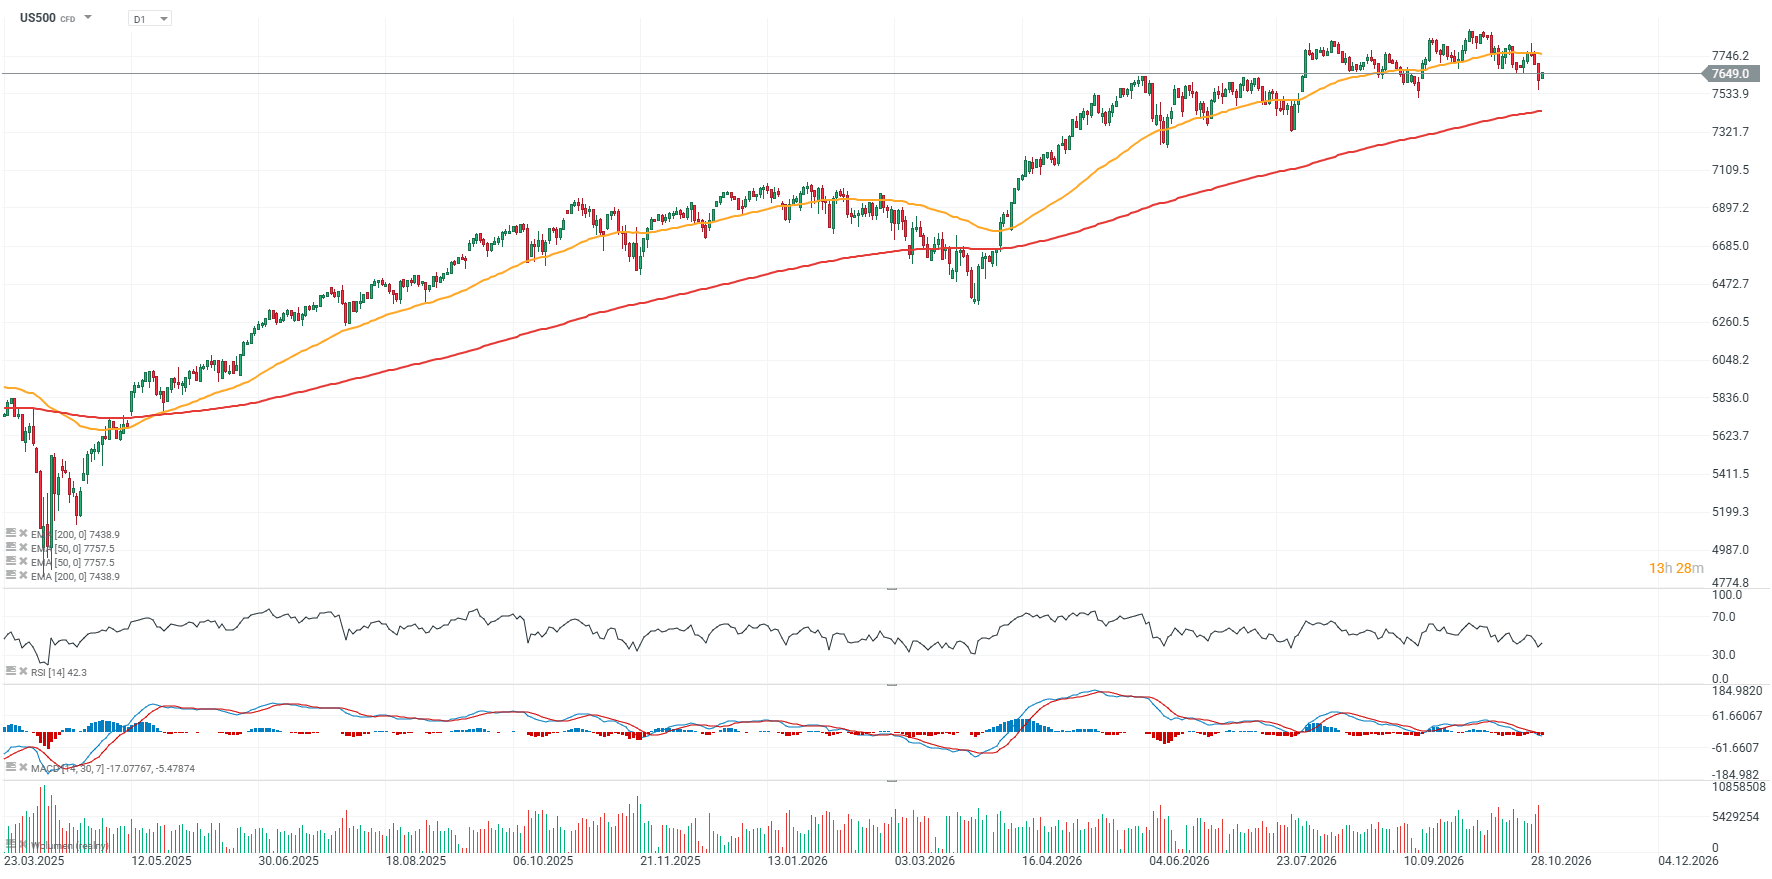
US500 chart (D1 timeframe)
Since the market sell-off in spring this year, S&P 500 futures have fallen below their 50-day exponential moving average (EMA50, orange line) on four occasions, meaning the latest decline is not particularly unusual in this respect. The RSI has dropped to 42 but remains comfortably above oversold territory. The 7,500-point area represents an important price-action support level, while the EMA50 (orange line), currently around 7,750 points, acts as a significant resistance level.
 Source: XTB Research



📊Morning Wrap: Oil falls after Qatar talks. China injects liquidity, while the US prepares for elections.


💥Daily Summary: Tech Sector Crash on Wall Street and Historic Attack on Binance



🔴Three Markets to Watch Next Week: US500, BITCOIN, EURUSD (30.10.2026)


US OPEN: Bloody end to the quarter. Intel loses nearly 1/3 of its value, and the crypto market shakes off a hack on the largest exchange.
The content of this report has been created by XTB S.A., with its registered office in Warsaw, at Prosta 67, 00-838 Warsaw, Poland, (KRS number 0000217580) and supervised by Polish Supervision Authority ( No. DDM-M-4021-57-1/2005). This material is a marketing communication within the meaning of Art. 24 (3) of Directive 2014/65/EU of the European Parliament and of the Council of 15 May 2014 on markets in financial instruments and amending Directive 2002/92/EC and Directive 2011/61/EU (MiFID II). Marketing communication is not an investment recommendation or information recommending or suggesting an investment strategy within the meaning of Regulation (EU) No 596/2014 of the European Parliament and of the Council of 16 April 2014 on market abuse (market abuse regulation) and repealing Directive 2003/6/EC of the European Parliament and of the Council and Commission Directives 2003/124/EC, 2003/125/EC and 2004/72/EC and Commission Delegated Regulation (EU) 2016/958 of 9 March 2016 supplementing Regulation (EU) No 596/2014 of the European Parliament and of the Council with regard to regulatory technical standards for the technical arrangements for objective presentation of investment recommendations or other information recommending or suggesting an investment strategy and for disclosure of particular interests or indications of conflicts of interest or any other advice, including in the area of investment advisory, within the meaning of the Trading in Financial Instruments Act of 29 July 2005 (i.e. Journal of Laws 2019, item 875, as amended). The marketing communication is prepared with the highest diligence, objectivity, presents the facts known to the author on the date of preparation and is devoid of any evaluation elements. The marketing communication is prepared without considering the client’s needs, his individual financial situation and does not present any investment strategy in any way. The marketing communication does not constitute an offer of sale, offering, subscription, invitation to purchase, advertisement or promotion of any financial instruments. XTB S.A. is not liable for any client’s actions or omissions, in particular for the acquisition or disposal of financial instruments, undertaken on the basis of the information contained in this marketing communication. In the event that the marketing communication contains any information about any results regarding the financial instruments indicated therein, these do not constitute any guarantee or forecast regarding the future results.