


- With 88% of S&P 500 companies having reported results, 86% have beaten EPS estimates, while 76% have reported revenues above expectations.
- S&P 500 earnings growth for Q2 stands at around 50% year-over-year, more than double the 23.1% expected at the end of June and marking the strongest growth since Q2 2021.
- Even excluding Alphabet and Amazon, S&P 500 earnings would still be growing by around 28.8% year-over-year, showing that the strength of the earnings season extends beyond the largest companies.

- With 88% of S&P 500 companies having reported results, 86% have beaten EPS estimates, while 76% have reported revenues above expectations.
- S&P 500 earnings growth for Q2 stands at around 50% year-over-year, more than double the 23.1% expected at the end of June and marking the strongest growth since Q2 2021.
- Even excluding Alphabet and Amazon, S&P 500 earnings would still be growing by around 28.8% year-over-year, showing that the strength of the earnings season extends beyond the largest companies.
According to FactSet data, the Q2 earnings season confirms the very strong fundamental condition of the largest US companies. Positive surprises have been widespread across both earnings and revenues, while EPS growth has significantly exceeded expectations from before the start of the reporting season. At the same time, the S&P 500's valuation remains elevated, meaning that further gains in the index will increasingly depend on companies maintaining strong earnings growth. Strong fundamentals come at a price, although at this stage we do not consider the current valuation particularly demanding.
- With 88% of S&P 500 companies having reported results, 86% have beaten EPS expectations, while 76% have reported revenues above consensus. This shows that positive surprises are not limited to cost control but are also visible on the revenue side.
- The S&P 500's Q2 earnings growth rate currently stands at 50.4% year-over-year. If this rate is maintained through the end of the reporting season, it would mark the strongest earnings growth since Q2 2021, when it reached 91.6%.
- The scale of the improvement compared with earlier expectations is exceptionally large. As recently as June 30, the market expected earnings growth of 23.1% year-over-year, compared with 50.4% currently – more than twice the initial estimate.
- Importantly, the improvement is broad-based. All 11 S&P 500 sectors are now reporting higher earnings than expected at the end of June, driven by positive earnings surprises and upward revisions to EPS estimates.
- The S&P 500's forward P/E ratio stands at around 20x, compared with a five-year average of 19.9x and a ten-year average of 19x. The market is therefore not cheap, but given the current pace of earnings growth, the elevated valuation has much stronger fundamental support than it would if the index rally were driven primarily by multiple expansion.
Record After Record – Amazon Supports Wall Street
Corporate earnings remain a strong fundamental argument for the US equity market, although part of the impressive earnings growth reflects exceptionally strong results from the largest companies. In just one week, the S&P 500 earnings growth rate increased from 38% to 47.4% year-over-year, while eight sectors are already reporting double-digit earnings growth. Importantly, even after excluding the two largest contributors, earnings growth across the index remains very strong.
- S&P 500 earnings are currently growing by 47.4% year-over-year, up from 38% just one week earlier. If this rate is maintained, it would represent the strongest growth since Q2 2021.
- Excluding Alphabet and Amazon, S&P 500 earnings growth would decline from 47.4% to 28.8% year-over-year. This would still be a very strong result, marking a second consecutive quarter of earnings growth above 20% and a seventh consecutive quarter of double-digit growth.
- As many as eight S&P 500 sectors are reporting double-digit earnings growth. Energy (+135.3% YoY), Communication Services (+109.8%), Consumer Discretionary (+90.7%), and Information Technology (+69.4%) are leading the gains.
- Amazon was the main contributor to the improvement in aggregate earnings over the past week. The company reported EPS of $5.75 versus expectations of $1.82 and accounted for 76% of the increase in the S&P 500's aggregate earnings over this period.
- Amazon's high EPS was significantly boosted by $53.4 billion in other pre-tax income, primarily related to its investment in Anthropic. This means that part of the index's spectacular earnings growth does not directly reflect an improvement in underlying operating performance.
- Amazon is now the second-largest contributor to S&P 500 earnings growth, behind only Alphabet. Alphabet's results were also significantly supported by valuation gains on its equity investments.
Source: FactSet
A Narrow Group of Companies Lifts the Average
S&P 500 companies with greater exposure to international markets are performing significantly better this earnings season than companies focused primarily on the US market. This is particularly noteworthy given the relatively strong US dollar, which in theory should reduce the value of overseas revenues and earnings when translated into dollars. Nevertheless, the data show that the internationally exposed part of the index continues to deliver very strong growth in both earnings and revenues.
- Companies generating more than 50% of their sales outside the US are reporting earnings growth of 74.7% year-over-year, compared with 35.5% for companies generating most of their revenues domestically. The corresponding figure for the entire S&P 500 is 47.4%.
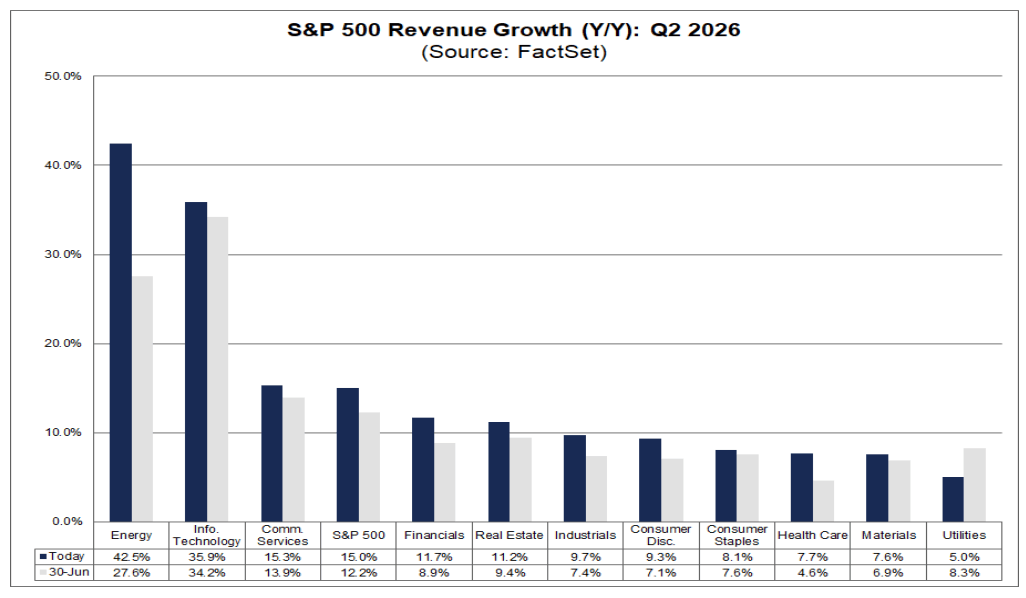
- A similar advantage can be seen in revenues. Sales among companies with greater international exposure are growing by 20.5% year-over-year, compared with 12.0% for domestically focused companies and 14.1% for the S&P 500 overall.
- So far, the strong US dollar has not translated into weaker aggregate results for globally exposed US companies. This suggests that underlying business growth has been strong enough to outweigh the potentially negative currency effect.
- However, a substantial part of this outperformance is being driven by the largest companies. Alphabet, Exxon Mobil, and Chevron rank among the top five contributors to both earnings and revenue growth within the group of companies with greater international exposure.
- Excluding Alphabet, Exxon Mobil, and Chevron, earnings growth for internationally exposed companies would fall from 74.7% to 27.5%, while revenue growth would decline from 20.5% to 16.0%.
- The data therefore point to two simultaneous trends: globally exposed S&P 500 companies remain fundamentally strong, but their exceptional earnings outperformance is heavily concentrated among a handful of major companies. The much smaller decline in revenue growth after excluding these companies suggests that sales strength is more broadly distributed than earnings growth.
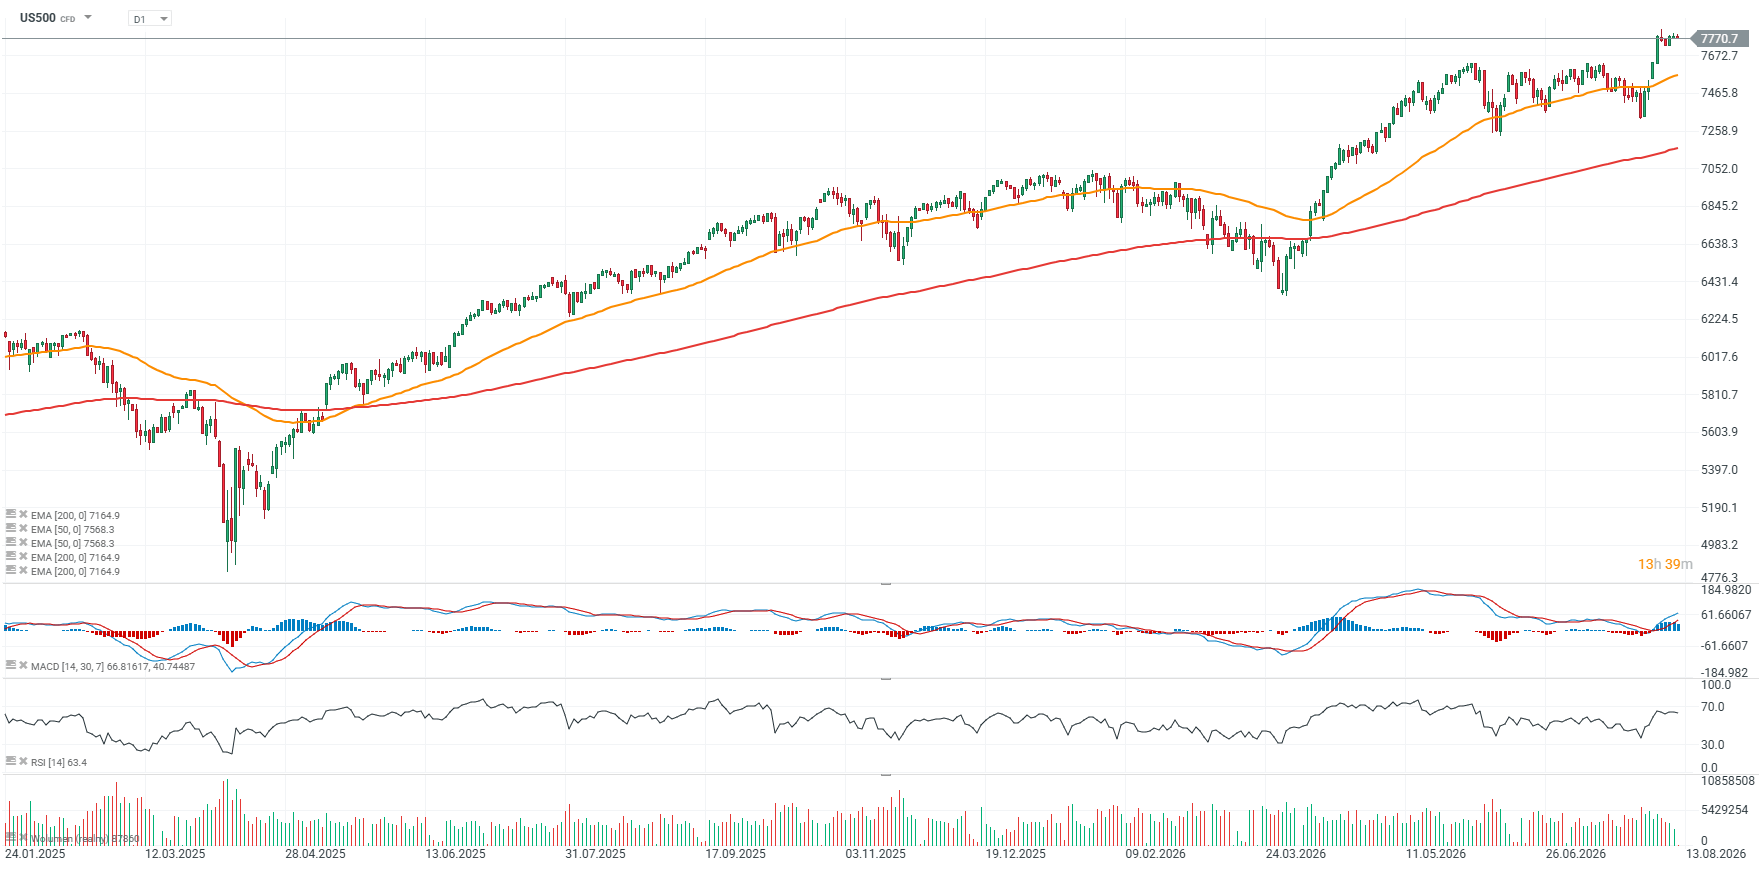
US500 Chart (D1 Interval)
The S&P 500 futures contract is trading close to its all-time highs but has struggled to break above the 7,800-point level over the past several sessions. The index is currently around 10% above its 200-day exponential moving average (EMA200), while important recent price reactions indicate potential support in the 7,250–7,350-point area.
 Source: xStation5



Morning Wrap: Oil cheaper despite attacks on Saudi Arabia, markets await CPI (12.10.2026)



Three Markets to Watch Next Week (09.10.2026)



Daily Summary: A Shallow Rebound Ahead of Earnings Season


Lumentum: Demand for AI infrastructure exceeds capacity
The content of this report has been created by XTB S.A., with its registered office in Warsaw, at Prosta 67, 00-838 Warsaw, Poland, (KRS number 0000217580) and supervised by Polish Supervision Authority ( No. DDM-M-4021-57-1/2005). This material is a marketing communication within the meaning of Art. 24 (3) of Directive 2014/65/EU of the European Parliament and of the Council of 15 May 2014 on markets in financial instruments and amending Directive 2002/92/EC and Directive 2011/61/EU (MiFID II). Marketing communication is not an investment recommendation or information recommending or suggesting an investment strategy within the meaning of Regulation (EU) No 596/2014 of the European Parliament and of the Council of 16 April 2014 on market abuse (market abuse regulation) and repealing Directive 2003/6/EC of the European Parliament and of the Council and Commission Directives 2003/124/EC, 2003/125/EC and 2004/72/EC and Commission Delegated Regulation (EU) 2016/958 of 9 March 2016 supplementing Regulation (EU) No 596/2014 of the European Parliament and of the Council with regard to regulatory technical standards for the technical arrangements for objective presentation of investment recommendations or other information recommending or suggesting an investment strategy and for disclosure of particular interests or indications of conflicts of interest or any other advice, including in the area of investment advisory, within the meaning of the Trading in Financial Instruments Act of 29 July 2005 (i.e. Journal of Laws 2019, item 875, as amended). The marketing communication is prepared with the highest diligence, objectivity, presents the facts known to the author on the date of preparation and is devoid of any evaluation elements. The marketing communication is prepared without considering the client’s needs, his individual financial situation and does not present any investment strategy in any way. The marketing communication does not constitute an offer of sale, offering, subscription, invitation to purchase, advertisement or promotion of any financial instruments. XTB S.A. is not liable for any client’s actions or omissions, in particular for the acquisition or disposal of financial instruments, undertaken on the basis of the information contained in this marketing communication. In the event that the marketing communication contains any information about any results regarding the financial instruments indicated therein, these do not constitute any guarantee or forecast regarding the future results.