
The Average True Range (ATR) indicator is a technical analysis tool that measures market volatility, shows how it is calculated from True Range values, and explains how traders use it in practice. Unlike directional indicators, ATR does not show whether price is likely to move up or down. Instead, it helps measure how much price is moving, which makes it useful for assessing market activity, setting a stop loss, and adjusting risk to current conditions.
The Average True Range (ATR) indicator is a technical analysis tool that measures market volatility, shows how it is calculated from True Range values, and explains how traders use it in practice. Unlike directional indicators, ATR does not show whether price is likely to move up or down. Instead, it helps measure how much price is moving, which makes it useful for assessing market activity, setting a stop loss, and adjusting risk to current conditions.
What Is the Average True Range (ATR) Indicator?
The Average True Range (ATR) is a technical indicator created by J. Welles Wilder Jr. in 1978 and introduced in his book New Concepts in Technical Trading Systems. ATR indicator is designed to help to understand price movements behaviour: a wider high-low gap suggests rising volatility and a possible trend, while a narrower range points to weakening momentum. Wilder saw price range as a direct measure of volatility and a useful signal of market direction. In his research analysis, a wider gap between a stock’s high and low over a given period suggested rising volatility and the emergence of a trend, while a narrower range pointed to weakening momentum and possible trend reversal
Wilder later refined this with the concept with a “true range”, which also accounts for the distance between the previous close and current price extremes. This captures overnight gaps caused by after-hours news that a standard high-low range would miss, making the indicator more accurate. ATR is a lagging indicator - it measures historical price movement, not future direction. In practice, traders use it to set stop-loss levels, size positions relative to current volatility, and compare activity across different timeframes or assets.
For beginners, it offers a straightforward way to read market conditions without relying on visual chart interpretation alone. For more advanced users, ATR works best as a supporting tool: since it generates no buy or sell signals on its own, it is typically combined with trend or momentum indicators such as Bollinger Bands. According to Sharon Yamanaka Working Money: Average True Range, J.Welles Wilder used ATR as the basis for his own volatility system called parabolic stop and reverse (SAR), which generates entry and exit signals.
❓ DID YOU KNOW
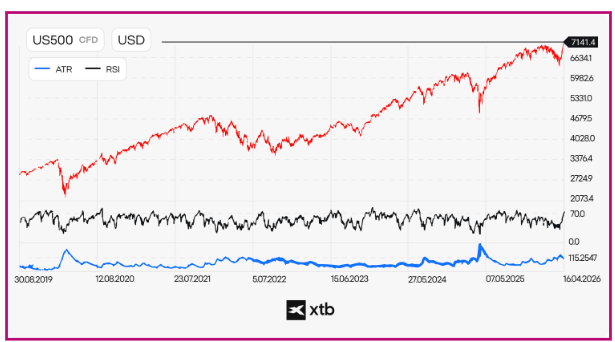
ATR reached extreme levels during stock market panics such as 2008 GFC, 2020 COVID-19 pandemic or 2025 tariff-driven sell-off.
ATR often reached unusually high levels during major market shocks, when price swings expanded far beyond normal conditions. Because ATR measures the size of price movement, it naturally increases during periods of heightened uncertainty.
In practice, ATR usually rises much faster during aggressive market declines than during bullish highs. Very high or very low ATR readings may sometimes act as a contrarian clue, but they should not be treated as a standalone signal. Remember, past performance is not an indicator of future results.
How Is the Average True Range Calculated? The ATR Formula Explained
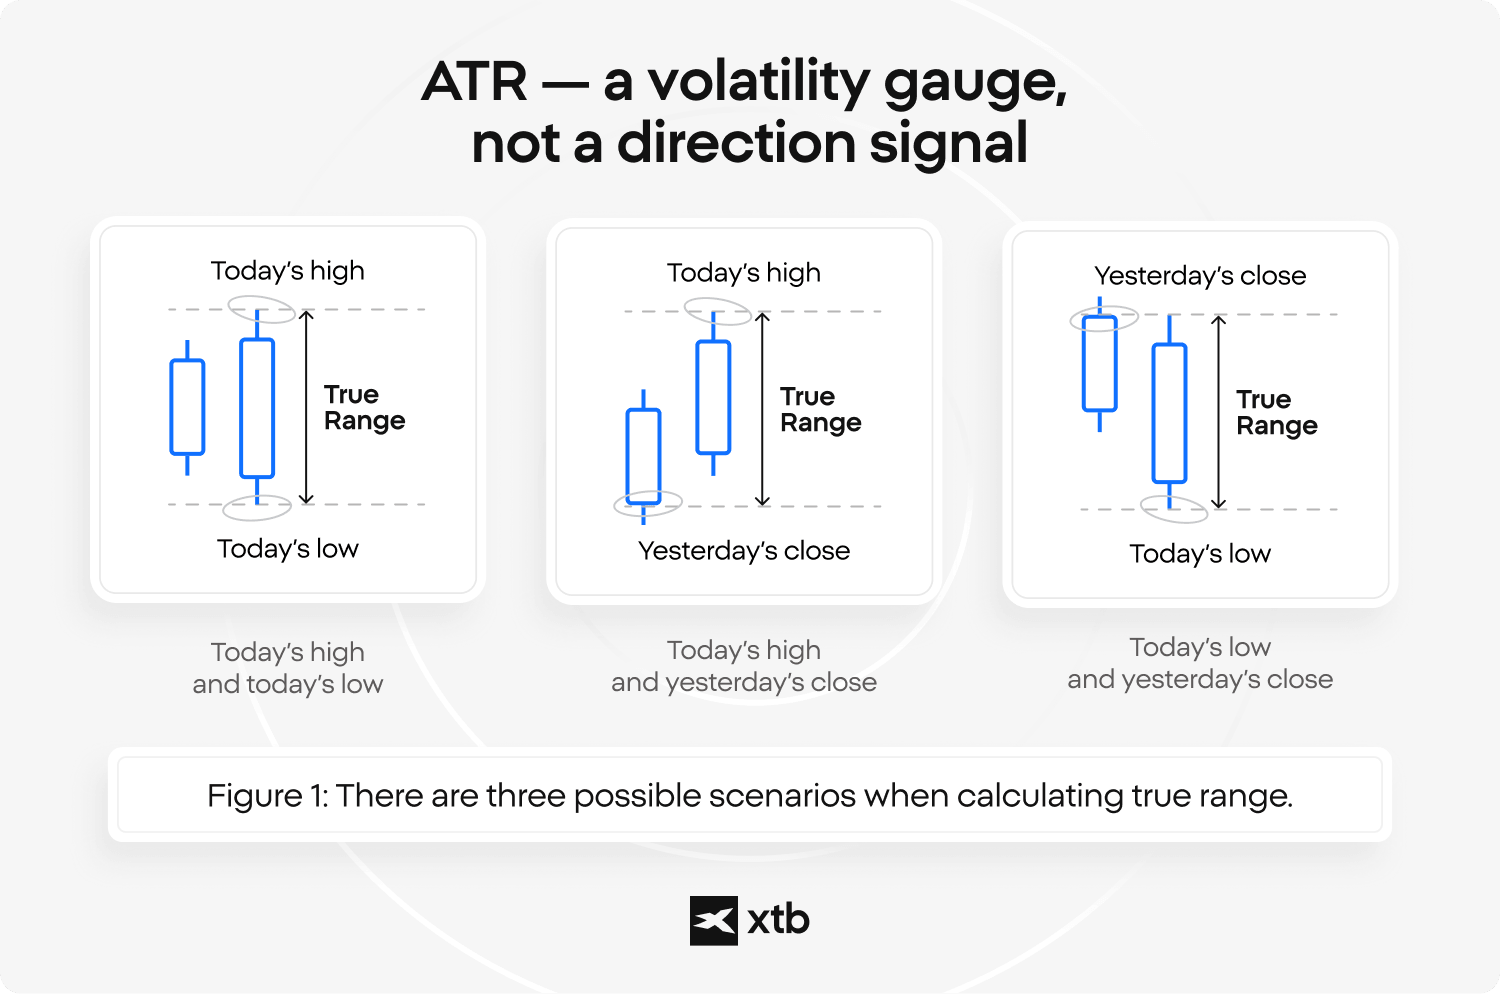
The ATR is calculated in two stages. First, the True Range (TR) is computed for each period. Then, those values are averaged over time, most commonly across 14 periods - 13 previous and the current true range. This approach allows ATR to capture not only the range within a session, but also price gaps between sessions, which a simple high–low range would ignore. Learning how to use the ATR indicator is important especially for technical-based speculators.
For each candle or session, True Range is defined as the largest of three values: the difference between the current high and low, the distance between the current high and the previous close, and the distance between the current low and the previous close. For example, if the high is 105, the low is 98, and the previous close is 100, the three values are 7, 5, and 2. The True Range is therefore 7. This value represents the actual price movement for that period, while ATR reflects volatility by smoothing these values over time.
![]()
After calculating TR for each period, the ATR formula is derived using a smoothing method introduced by Wilder. The first ATR value is a simple average of the initial 14 TR readings. Each subsequent value is then calculated using a rolling formula, which gives more stability to the indicator while still allowing it to react to new data.
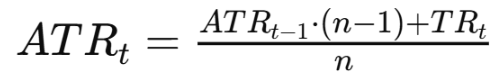
The default 14-period setting was chosen by Wilder as a balance between stability and responsiveness. It smooths out short-term fluctuations while still reflecting changes in market activity. This also explains why ATR values may differ slightly between platforms. Variations in data feeds, session definitions, or smoothing methods (such as SMA vs. Wilder’s method) can lead to small differences, even though the core calculation remains the same.
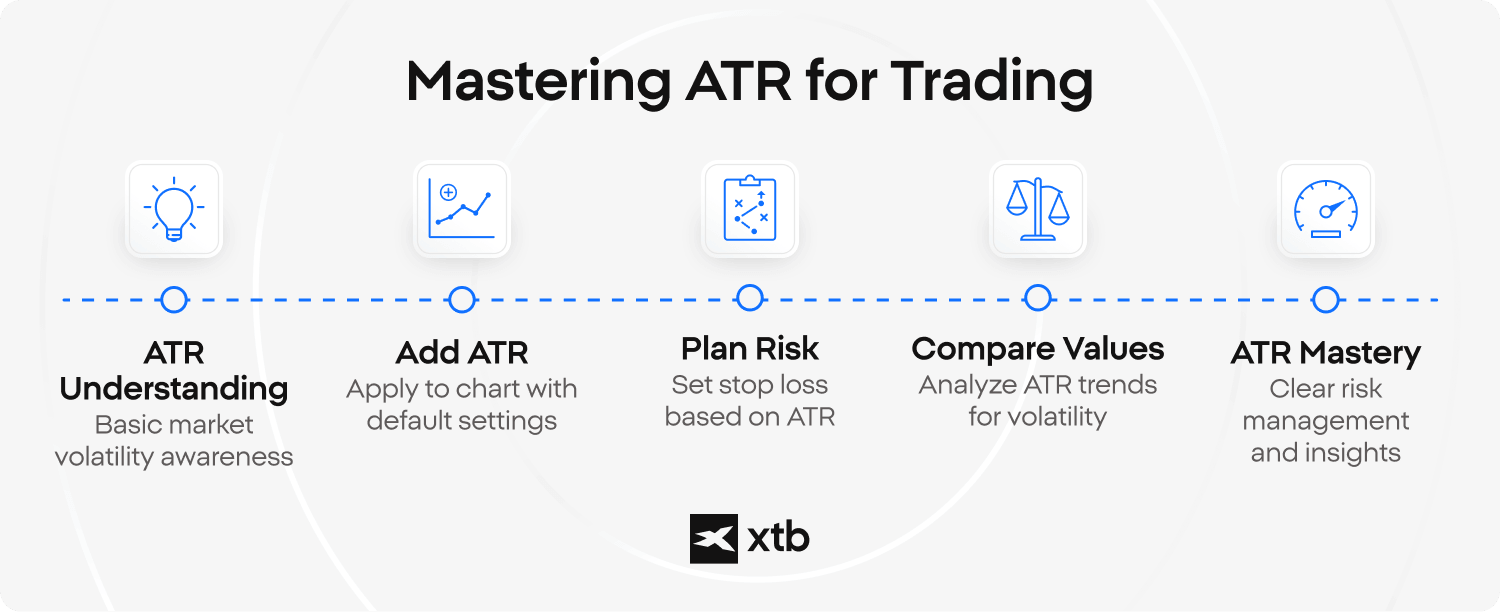
Using ATR Step by Step
- Add ATR to your chart and keep the default 14-period setting if you are a beginner. Then check the current ATR value to see how active the market is. A higher ATR means larger price swings, while a lower ATR suggests calmer conditions.
- Use ATR to plan risk more clearly. Many traders use it to set a stop loss based on current volatility instead of a fixed distance. A common approach is to place the stop at a multiple of ATR, such as 1× or 1.5× ATR, although the exact level depends on the strategy and market conditions.
- Compare the current ATR reading with recent values on the chart. If ATR is rising, volatility is increasing. If it is falling, the market is becoming quieter. ATR should not be used alone to judge direction, but it can help you size risk, place exits, and understand current conditions more clearly.
How do you read an ATR indicator?
Reading ATR comes down to tracking whether its value is rising or falling. A high ATR means price swings are expanding, which typically signals more dynamic conditions and increased risk, while a lower ATR indicates tighter price ranges and calmer market behavior. Prolonged low ATR often indicates consolidation - a phase that may resolve into either a trend continuation or reversal, with direction typically becoming clearer only when volatility expands again.
ATR does not show price direction and is not designed to signal when to buy or sell - its role is solely to measure the intensity of price movement. Importantly, ATR is an absolute value, meaning it does not account for the price level of an asset. For example, a true range of 1.0 represents a much larger percentage move for a $20 stock than for a $90 stock. This is why ATR is best used in context, often alongside indicators that provide insight into trend or momentum, helping better understanding of risk and market structure.
ATR can increase in both rising and falling markets, as long as price movements become more pronounced. Elevated ATR levels are typically associated with strong trends or periods of heightened uncertainty, while declining ATR suggests the market is losing momentum and moving into consolidation. In some cases, ATR and price may move in opposite directions. For instance, rising ATR alongside falling prices can confirm a strengthening downtrend, while falling ATR during high price levels may indicate weakening momentum. Unlike many oscillators, ATR does not signal overbought or oversold conditions, but instead provides a broader view of how active or quiet the market is at a given time.
How to use ATR indicator in market analysis
ATR indicator helps put price movements into context by showing whether current volatility is typical or unusually high. It does not predict direction, but it helps set realistic expectations for how much the market can move. The Average True Range is commonly used to:
- estimate price range by showing how far price may move within a session,
- adjust position size so risk stays more consistent in volatile and calm markets,
- filter breakouts by showing whether volatility is low (compression) or starting to expand.
When ATR is very low, the market is often quiet and breakouts may lack momentum. When ATR begins to rise, it can signal increasing activity, which may support stronger moves. In practice, ATR is often combined with tools such as MACD, which helps assess momentum and direction, or Bollinger Bands, which show whether price is moving near the edges of its recent range. Used together, these indicators can give a broader view of market conditions. ATR works best as a supporting tool, helping interpret other signals rather than generating them on its own.
⚠️ Caution
ATR expansion during a breakout
If an asset has been trading within a narrow range and ATR remains low, a sudden increase in ATR may coincide with a breakout from that range. This reflects that price movements are becoming wider, not that the direction of the move is confirmed.
How to set a stop loss and trailing stop using ATR
The ATR indicator is often used to set a stop loss based on current volatility instead of a fixed number of points or pips. This makes the distance more flexible. When the market is more volatile, the stop is placed wider, while in calmer conditions it can be set closer to the entry. A commonly used approach is to place the stop at 1.5× ATR or 2× ATR from the entry price, although the exact level depends on the trading method and market conditions.
To calculate the exact stop level, traders multiply the current ATR value by a chosen factor and then add or subtract that distance from the entry price. For example, if a long position is opened at 100 and ATR is 2, a 1.5× ATR stop loss would be placed 3 points below the entry, at 97. A 2× ATR stop would be placed at 96. In a short trade, the same logic applies in reverse, so the stop is placed above the entry price.
An ATR trailing stop uses the same principle, but it moves with the trade as price develops. Instead of staying fixed, the stop follows the market while maintaining a constant ATR-based distance. For example, if the trailing stop is set at 2× ATR, it adjusts as price moves higher in a long trade. If the market reverses, the stop does not move further away. This approach helps protect profits while still allowing room for normal price fluctuations, although it does not eliminate risk.
📌 EXAMPLE
Joe uses ATR to set a stop loss on his stock investment
Joe buys shares of a company during a consolidation phase and wants to manage his risk in a practical way. He invests $7,200 when the stock is trading at $36 per share, which gives him a position of:
- $7,200 at $36/share = 200 shares
Joe decides that he does not want to risk more than 5% of his total position. That means:
- 5% of $7,200 = $360
So, if Joe subtracts that maximum acceptable loss from the value of his investment, he gets:
- $7,200 - $360 = $6,840
To find the stop-loss level per share, he divides the remaining position value by the number of shares:
- $6,840 / 200 shares = $34.20 stop-loss
At the same time, the ATR is 0.90, which offers another way to think about where the stop could be placed. Based on ATR, the stop-loss would sit at:
- $36.00 - $0.90 = $35.10
This ATR-based stop is higher than the percentage-based stop at $34.20, so Joe may choose a compromise between the two levels. One balanced approach is to split the difference:
- Difference between the two stop levels: $35.10 - $34.20 = $0.90
- Half of that difference: $0.45
- Midpoint stop-loss: $34.20 + $0.45 = $34.65
In this case, Joe could place his stop at $34.65, which gives the trade more room than a strict ATR stop, but still keeps risk tighter than the full 5% method. ATR-based stop loss levels work best in normal market conditions, when recent volatility still reflects current price behavior. They may be less effective during news shocks, price gaps, or very unstable sessions, because past ATR readings can quickly become outdated.
What ATR period and multiplier settings mean in practice
There is no single ATR setting that works best in all situations. The right combination depends on your trading style, timeframe, and the asset you are analyzing. Instead of copying fixed numbers, it is more effective to understand how the ATR period and multiplier change the behavior of the indicator. The ATR period controls how sensitive the indicator is to recent price changes. A shorter period reacts faster and highlights sudden volatility, while a longer period moves more slowly and filters out short-term noise. The default 14-period ATR is widely used because it offers a balance between responsiveness and stability.
In practice, different styles often use different settings:
- Scalping → shorter ATR (e.g. 5–10) to react quickly to market changes
- Day trading → standard 14-period ATR for a balanced view
- Swing trading → longer ATR (e.g. 20–30) to focus on broader volatility trends
The ATR multiplier determines how much space is given to price movements, most often when setting a stop loss or trailing stop. A lower multiplier creates tighter levels, while a higher multiplier allows for wider fluctuations:
- Tighter trading styles → around 1 - 1.5× ATR
- More flexible approaches → around 1.5 - 2× ATR
- Longer-term trades → sometimes 2×+ ATR
ATR settings can work differently across markets. Forex is often more stable intraday, stocks can react sharply to news, and crypto typically shows higher volatility. The same setup may not perform the same way on every asset. Shorter and tighter settings suit faster trading, while longer and wider settings work better for holding positions through normal fluctuations. The goal is not to find one perfect setting, but to match ATR to the market and your trading style.
Key takeaways
- The Average True Range measures volatility, not direction, so it helps show whether price movements are becoming larger or smaller without giving a buy or sell signal.
- This indicator is built from True Range and usually uses a 14-period setting, which helps capture both daily price movement and gaps between sessions.
- ATR indicator is mainly used as a practical risk tool, especially for setting stop loss levels, estimating market range, and adjusting position size to volatility.
FAQ
The Average True Range (ATR) shows how much price typically moves over a given period. It does not show direction, only the size of price changes. In simple terms, it helps answer whether the market is moving more or less than usual.
A high ATR means price movements are larger and the market is more volatile. A low ATR suggests smaller movements and calmer conditions. These values help assess how active the market is, but not where it will move next.
ATR does not identify trends or reversals. While trend indicators focus on direction, ATR only measures the strength of price movement. It works as a supporting tool th
ATR is a lagging indicator because it is based on past price data. It reacts to changes in volatility after they happen and does not predict future market direction.
Yes, ATR can be used on stocks, forex, indices, and cryptocurrencies. However, its values should always be interpreted in the context of the specific asset, as volatility differs between markets.
ATR increases when price movements become larger than usual. This often happens during breakouts, news events, or periods of uncertainty. ATR reflects the result of these changes, not their cause.
ATR is often used to set a stop loss based on volatility instead of a fixed distance. A common approach is to place the stop at a multiple of ATR (for example 1.5× or 2× ATR), which adjusts the distance to current market conditions.
There is no universal “good” ATR value. What matters is how the current reading compares to the asset’s recent history. The same ATR value can mean different things depending on the market and timeframe.

This content has been created by XTB S.A. This service is provided by XTB S.A., with its registered office in Warsaw, at Prosta 67, 00-838 Warsaw, Poland, entered in the register of entrepreneurs of the National Court Register (Krajowy Rejestr Sądowy) conducted by District Court for the Capital City of Warsaw, XII Commercial Division of the National Court Register under KRS number 0000217580, REGON number 015803782 and Tax Identification Number (NIP) 527-24-43-955, with the fully paid up share capital in the amount of PLN 5.869.181,75. XTB S.A. conducts brokerage activities on the basis of the license granted by Polish Securities and Exchange Commission on 8th November 2005 No. DDM-M-4021-57-1/2005 and is supervised by Polish Supervision Authority.