

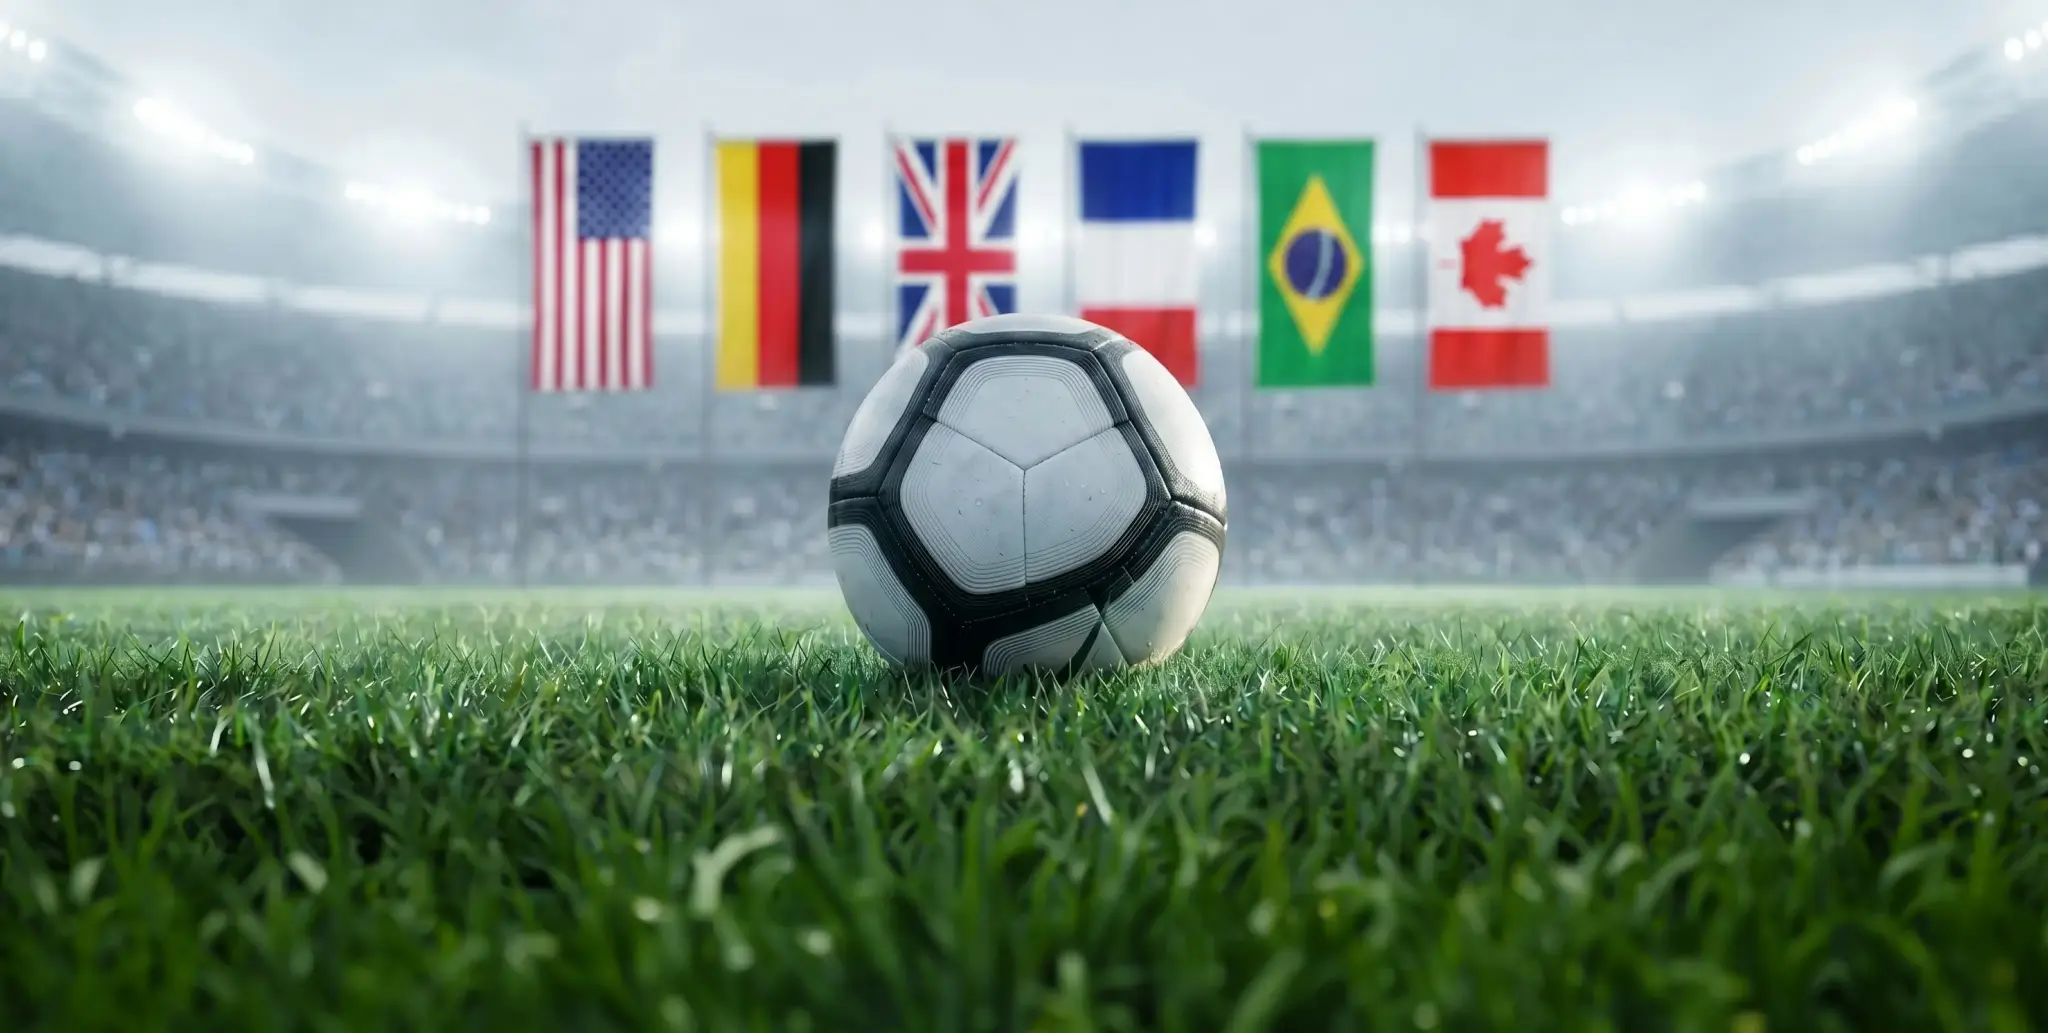
The 2026 FIFA World Cup brings together 48 nations spanning six continents and between them, they represent some of the world's most powerful, fastest-growing, and most intriguing economies. Beyond football, the tournament offers a useful lens through which to examine global economic diversity: host nations investing billions in infrastructure, emerging markets showcasing their potential, and established superpowers asserting their commercial dominance.
So which World Cup nation has the strongest economy? The answer depends on how you measure it, but here is a breakdown of the key contenders.Starting a quarterly audit
The 2026 FIFA World Cup brings together 48 nations spanning six continents and between them, they represent some of the world's most powerful, fastest-growing, and most intriguing economies. Beyond football, the tournament offers a useful lens through which to examine global economic diversity: host nations investing billions in infrastructure, emerging markets showcasing their potential, and established superpowers asserting their commercial dominance.
So which World Cup nation has the strongest economy? The answer depends on how you measure it, but here is a breakdown of the key contenders.Starting a quarterly audit
By GDP: The USA Wins Comfortably
On the most commonly used measure, nominal Gross Domestic Product — the answer is straightforward. The United States remains the world's largest economy in 2026, with a nominal GDP estimated at $32.38 trillion and a GDP per capita reaching $94,430, one of the highest levels globally.
As a co-host of the 2026 tournament alongside Canada and Mexico, the US is both the economic and commercial centre of gravity for this edition. FIFA estimates the tournament could contribute as much as $17.2 billion to US GDP, with Deutsche Bank forecasting approximately 1.2 million international visitors to North America, though this represents a relatively modest contribution relative to the scale of the US economy.
The Top Economies at the 2026 World Cup
Here is how the major participating nations rank by nominal GDP:
|
|
|
|
|
|
|
|
|
|
|
|
|
|
|
|
|
|
|
|
|
|
|
|
|
|
|
|
|
|
|
|
|
|
|
|
|
|
|
|
|
|
|
|
Sources: IMF, World Economic Outlook 2025/26 projections
Germany: Europe's Economic Anchor
Germany holds third place in the global GDP ranking in 2026 and is the largest economy in the European Union by a significant margin. Despite facing structural headwinds including an energy transition, demographic challenges, and sluggish industrial output — Germany remains a global exporting powerhouse with leading positions in automotive manufacturing, industrial engineering, and enterprise software.
For markets, Germany's World Cup participation also carries specific commercial weight: as the home of Adidas and Puma, a strong German tournament run historically correlates with increased brand salience and consumer demand for German-made sportswear. Traders tracking German equities can access the DE 40 — Germany's benchmark index of 40 leading companies — via XTB's indices offering.
Brazil: Currency Risk and Commodity Exposure
Brazil presents the most interesting case among the emerging economies. With a GDP of around $2.2 trillion, it ranks among the world's top 10 economies and is by far the largest in Latin America. But its economic trajectory is characterised by volatility, structural inequality, and currency risk that stand in contrast to the more stable developed market economies.
Brazil is also one of the world's largest commodity exporters, with major positions in iron ore, crude oil, soybeans, and sugar. Traders looking to gain exposure to the commodities markets underpinning Brazil's economy can explore XTB's commodities offering, which covers energy, metals, and agricultural products.
From a financial markets perspective, Brazil is the highest-profile emerging market represented at the tournament. Its currency (the real) and equity market often react to World Cup performance — a phenomenon that has attracted academic interest as an example of sentiment-driven market movement. Forex traders can track the Brazilian real and other major and exotic currency pairs via XTB's forex markets.
The Co-Hosts: USA, Canada and Mexico - A $35 Trillion Bloc
Taken together, the three co-hosting nations represent a combined GDP of over $35 trillion — an unprecedented concentration of economic power in a single World Cup host partnership. This creates an unusually favourable commercial environment for the tournament, with large, wealthy consumer markets across all three nations and a unified time zone that maximises advertising and broadcast revenues.
The expanded 48-team format and 104-match schedule are expected to drive incremental growth through increased international visitors and global viewership, with companies in online travel, airlines, hotels, food and beverage, sportswear, advertising, and payment services all positioned to benefit. Tradingkey
Investors looking for diversified exposure to North American markets rather than individual stock picks may find ETFs a useful vehicle, with broad market funds tracking the US, Canadian, and Mexican economies available through XTB's platform.
GDP Per Capita: A Different Picture
Nominal GDP favours large countries by population. Measured by GDP per capita, a better proxy for individual wealth and living standards — the rankings shift. Nations like Australia, Canada, and the Netherlands perform strongly, while Brazil, Mexico, and Argentina despite their large economies in aggregate — sit significantly lower.
For investors, GDP per capita is a useful indicator of consumer purchasing power and domestic demand relevant when assessing which nations' companies are best positioned to capitalise on tournament-related consumer spending. Traders interested in individual company exposure can explore shares offering, which covers thousands of global stocks across major exchanges.
What Does This Mean for Markets?
The World Cup is increasingly viewed not just as a sporting event but as a macroeconomic signal and a catalyst for short-term market movements. Sectors with direct exposure include sportswear, broadcasting, travel and tourism, digital payments, and consumer goods.
Whether you want to trade individual companies through shares CFDs, track broader market movements via indices, gain exposure to commodity-driven economies through commodities, or monitor currency impacts across forex markets — XTB offers access to all of these in one platform. For those looking to build longer-term positions rather than trade short-term price movements, Investment Plans allow you to invest in a curated basket of assets aligned to specific themes and sectors.
CFDs are complex instruments and come with a high risk of losing money rapidly due to leverage. 72% of retail investor accounts lose money when trading CFDs with this provider. You should consider whether you understand how CFDs work and whether you can afford to take the high risk of losing your money.

Indices Trading
How to Take Advantage from Falling Prices

Keir Starmer Resigns: What It Means for GBP, Gilts and UK Markets
This content has been created by XTB S.A. This service is provided by XTB S.A., with its registered office in Warsaw, at Prosta 67, 00-838 Warsaw, Poland, entered in the register of entrepreneurs of the National Court Register (Krajowy Rejestr Sądowy) conducted by District Court for the Capital City of Warsaw, XII Commercial Division of the National Court Register under KRS number 0000217580, REGON number 015803782 and Tax Identification Number (NIP) 527-24-43-955, with the fully paid up share capital in the amount of PLN 5.869.181,75. XTB S.A. conducts brokerage activities on the basis of the license granted by Polish Securities and Exchange Commission on 8th November 2005 No. DDM-M-4021-57-1/2005 and is supervised by Polish Supervision Authority.