
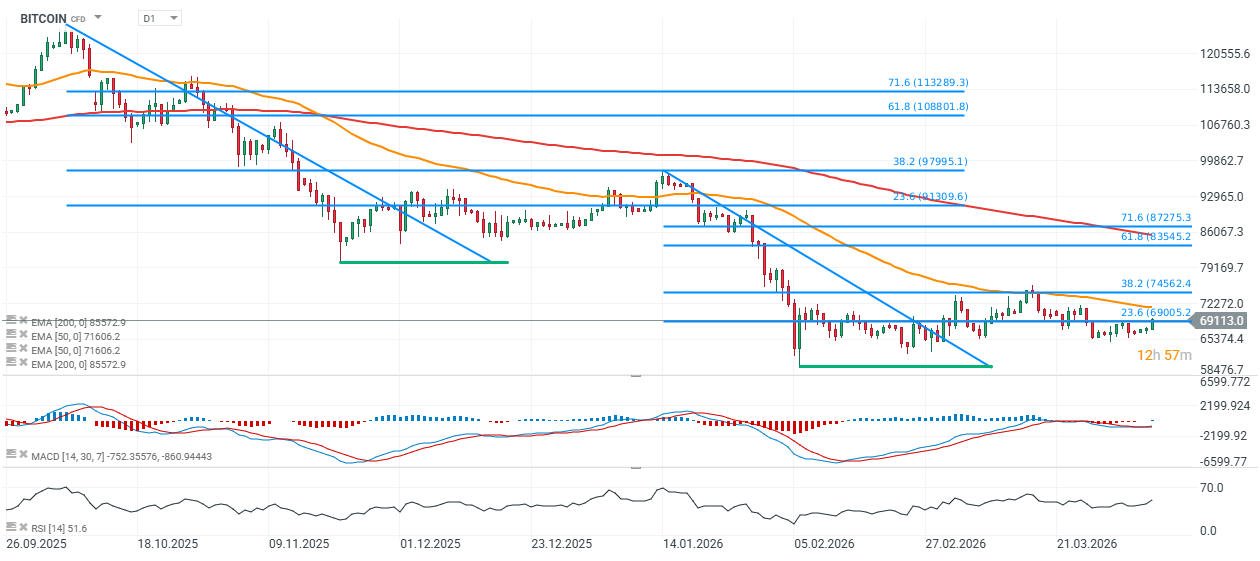
Bitcoin chart (D1 timeframe)
Looking at the last two downward price impulses, BTC has behaved similarly in both cases. Currently, as well as at the turn of November and December 2025, the price declined by around 10% below the 23.6% Fibonacci retracement of the downward move—previously around $91,000, and currently near $69,000. As in the previous move, the price has also rebounded from resistance at the 38.2% Fibonacci retracement - earlier around $98,000, and now approximately $74,600.
The key support level is currently located around $65,000. A break below this threshold could trigger a decisive third downward impulse. If such a move were to mirror the scale of the previous two declines (roughly 1:1), Bitcoin could potentially fall toward the $45,000 area. On the other hand, upward move above $70k makes the retest of $74.600 more probable.
Source: xStation5

Daily Summary: A sell-off with a spin-off

Three Markets Worth Watching Next Week (17.07.2026)

Iran Escalation: What to Watch and What to Expect

US OPEN: The market extends losses as investor concerns grow
This content has been created by XTB S.A. This service is provided by XTB S.A., with its registered office in Warsaw, at Prosta 67, 00-838 Warsaw, Poland, entered in the register of entrepreneurs of the National Court Register (Krajowy Rejestr Sądowy) conducted by District Court for the Capital City of Warsaw, XII Commercial Division of the National Court Register under KRS number 0000217580, REGON number 015803782 and Tax Identification Number (NIP) 527-24-43-955, with the fully paid up share capital in the amount of PLN 5.869.181,75. XTB S.A. conducts brokerage activities on the basis of the license granted by Polish Securities and Exchange Commission on 8th November 2005 No. DDM-M-4021-57-1/2005 and is supervised by Polish Supervision Authority.