



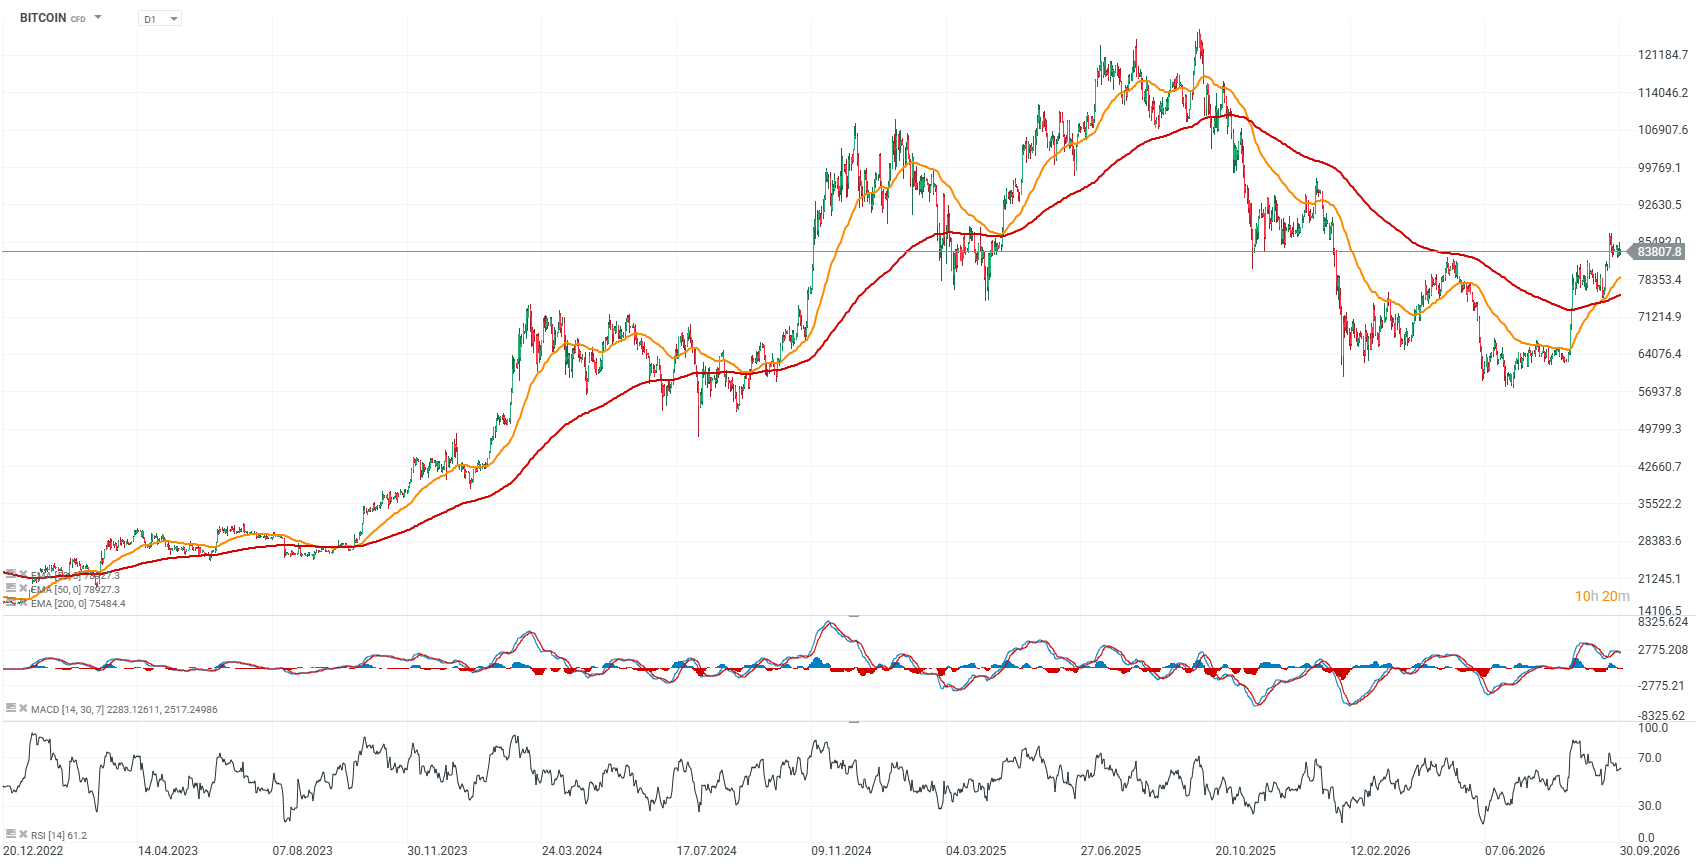
Cryptocurrencies have entered a more challenging phase and given back part of the gains seen after last week’s breakout, with Bitcoin trading back near $83,000 compared with around $87,000 last week. Unfortunately, demand in spot markets is still failing to keep pace with ETF buying and stronger activity in derivatives markets. A stronger US dollar and higher bond yields appear to be exerting only limited pressure on Bitcoin prices so far.
Bitcoin chart (D1 interval)
Looking at the chart, Bitcoin has already delivered two impressive bullish impulses and, although momentum has weakened, a return toward the $87,000–$90,000 area remains possible. The EMA200 and EMA50 have formed a “golden cross” for the first time since 2023. From a price action perspective, important resistance levels are located around $92,000 and $97,000, respectively.
Source: xStation5
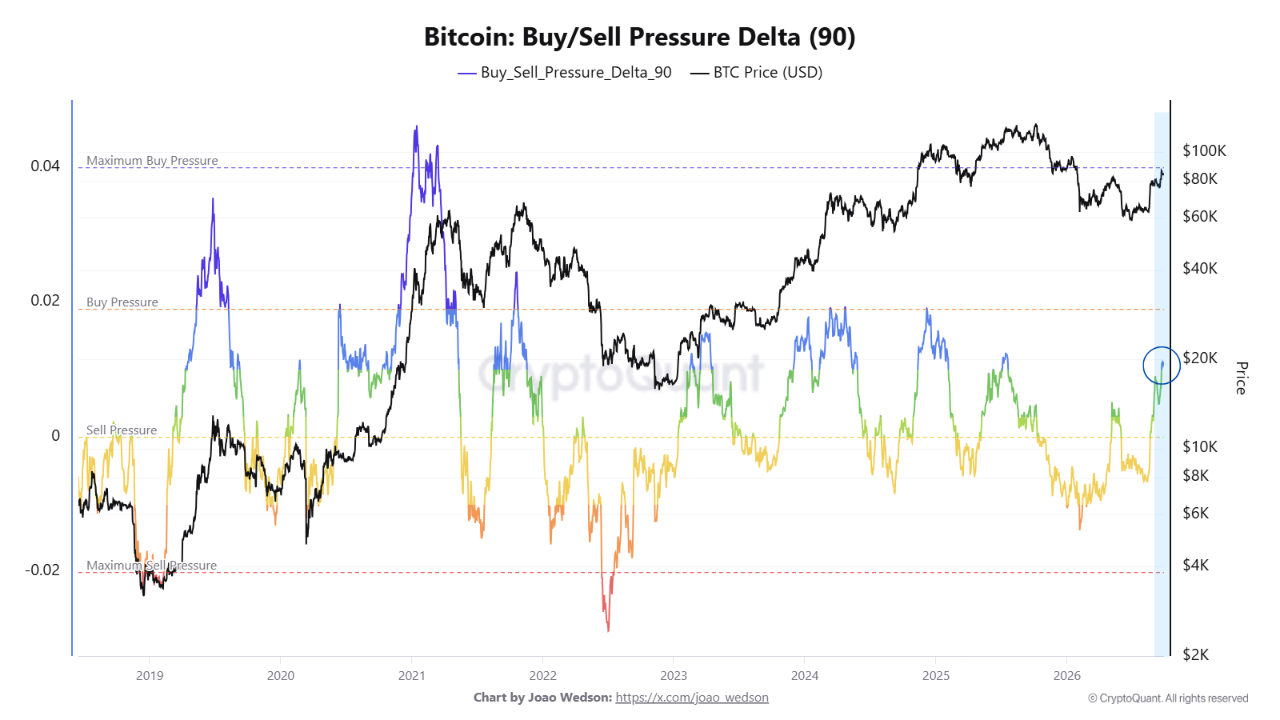
Bitcoin buy pressure is returning, but the market is approaching a key inflection point
Bitcoin’s 90-day Buy/Sell Pressure Delta has rebounded sharply from negative territory and returned to a zone where buyers are beginning to regain the upper hand. BTC price has recovered alongside it, making the current signal look constructive. However, the indicator is still below the levels that historically accompanied the strongest phases of demand expansion.
The durability of this move remains the key issue. A similar shift into positive territory in early 2023 was followed by a prolonged period of price appreciation, while a comparable improvement in mid-2025 proved less durable and eventually faded. This highlights that a positive reading alone does not confirm a new trend. Rather, it indicates that the balance between buying and selling pressure over the 90-day window is once again shifting in favor of buyers.
From an on-chain perspective, the market has therefore reached a point where further confirmation matters. If the delta continues to rise and moves into higher buy-pressure zones while Bitcoin holds its recent price recovery, it would provide a much stronger signal of a sustained improvement in demand. If, however, the indicator stalls around current levels or begins to roll over while price continues higher, a negative divergence could emerge, suggesting that the rally is losing support from underlying demand.
The key issue is therefore not simply whether the delta remains positive, but whether buying pressure continues to expand. The current reading points to a recovery in demand, but the coming weeks will show whether buyers can turn this rebound into a more durable trend.
Source: CryptoQuant
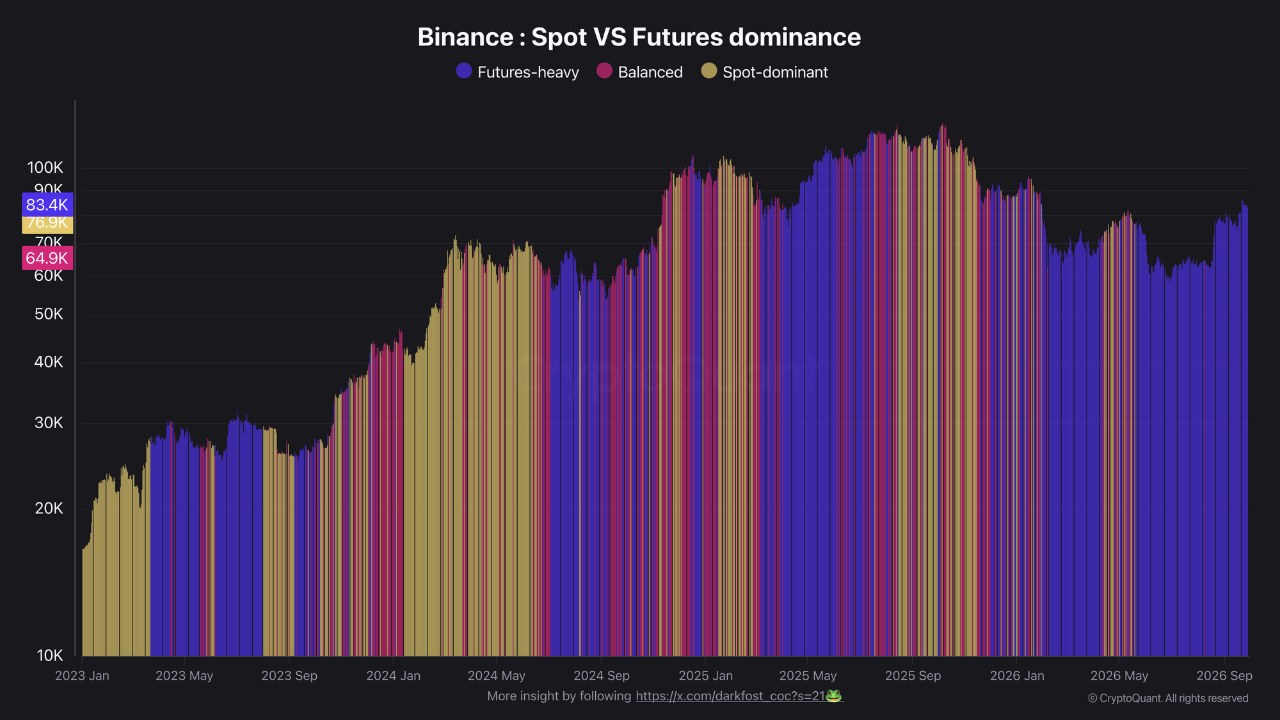
Is spot demand still failing to keep pace with futures?
Bitcoin’s market structure remains heavily tilted toward derivatives. On Binance, where a large share of both spot and futures trading is concentrated, the spot-to-futures volume ratio currently stands at around 0.12. This means that market activity is now roughly 90% driven by futures, with approximately $9 of futures volume for every $1 traded in the spot market.
Futures dominance is not necessarily a bearish signal on its own. In many previous bullish phases, speculative capital returning to derivatives was the first impulse behind a stronger price move. The problem arises when this initial impulse is not followed by sustained spot demand, because such a setup increases the market’s dependence on leverage and short-term positioning.
For now, that confirmation is still missing. Open interest on Binance has fallen from around $10.6 billion to $9.2 billion over the past week, suggesting some cooling in leveraged positioning, but spot volumes remain too weak for the market structure to improve meaningfully. In other words, part of the excess leverage has been reduced, but it has not yet been replaced by a decisive inflow of capital into the spot market.
This distinction is important when assessing the quality of the current rebound. If price gains continue to rely mainly on futures without a clear acceleration in spot volume and demand, the move will remain more vulnerable to sharp pullbacks, liquidations and shifts in sentiment. A healthier signal would be for Bitcoin to hold its price recovery while spot activity rises and the dominance of futures gradually declines.
Source: CryptoQuant
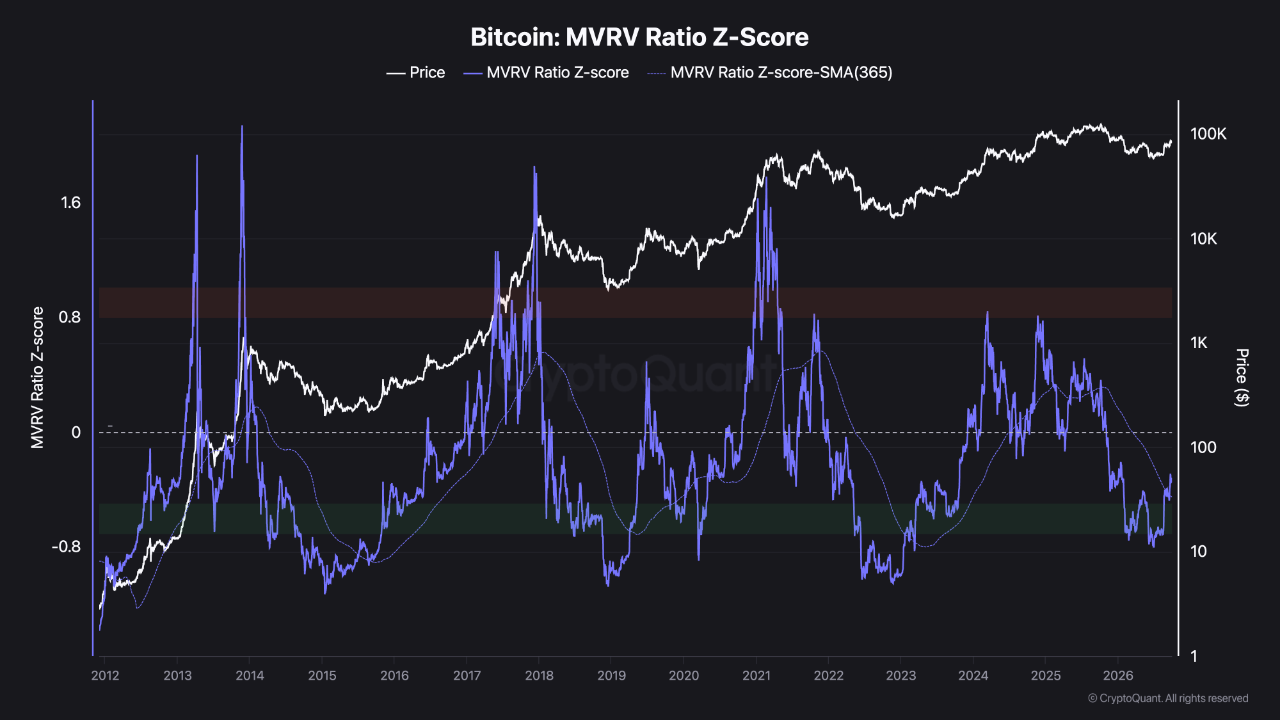
MVRV Z-Score remains above its annual average. Does the structure still support the bullish scenario?
The MVRV Z-Score shows how stretched Bitcoin’s market valuation is relative to the average on-chain acquisition price of BTC and its own historical range. Extremely high readings have historically appeared near overheated phases of the cycle, while deeply negative readings have often coincided with the formation of long-term market bottoms. In the current setup, however, the relationship between the MVRV Z-Score and its 365-day moving average appears particularly important.
Historically, after the indicator moved decisively above this average, the 365-day line often acted as support during broader bull-market phases. This does not mean that Bitcoin should rise without corrections. Even during strong uptrends, deep short-term pullbacks have occurred while the broader on-chain structure remained intact.
The key signal therefore comes not from price volatility itself, but from the behavior of the MVRV Z-Score relative to the 365-day average. As long as the indicator remains above it, long-term valuation momentum continues to look relatively supportive of further upside. A much more meaningful warning would emerge if the Z-Score were to fall decisively below the average and fail to reclaim it quickly.
The current setup therefore continues to suggest that the long-term bullish structure remains intact, while still leaving room for shorter-term corrections. The key risk would be a situation in which a correction begins to undermine the longer-term valuation structure visible in the on-chain data.
Source: CryptoQuant


RBA turns increasingly hawkish as markets reprice November rate hike expectations ⚔️



Daily Summary: Buyers Refuse to Give In

US Natural gas extends declines 🔥📉



US OPEN: The wave of AI concerns is building again, oil returns near highs
This content has been created by XTB S.A. This service is provided by XTB S.A., with its registered office in Warsaw, at Prosta 67, 00-838 Warsaw, Poland, entered in the register of entrepreneurs of the National Court Register (Krajowy Rejestr Sądowy) conducted by District Court for the Capital City of Warsaw, XII Commercial Division of the National Court Register under KRS number 0000217580, REGON number 015803782 and Tax Identification Number (NIP) 527-24-43-955, with the fully paid up share capital in the amount of PLN 5.869.181,75. XTB S.A. conducts brokerage activities on the basis of the license granted by Polish Securities and Exchange Commission on 8th November 2005 No. DDM-M-4021-57-1/2005 and is supervised by Polish Supervision Authority.