
Bitcoin’s move back above $74,000 looks like a genuine relief rally, but not one investors should treat as a confirmed breakout. What we’re seeing is a broader return of risk appetite, helped by a softer geopolitical tone around Iran and the Strait of Hormuz. That shift was enough to pull capital back into crypto, equities, and other higher-beta assets. Still, this remains a headline-driven market, so the rebound looks constructive—but not fully secure.
Market structure: broad-based rebound, not just Bitcoin
- Bitcoin surges 1.7% today to $74,500, after dipping near $70,600, showing a quite strong reversal.
- This upward move is not a crypto-only move; U.S. equities and risk assets also rebounded, reinforcing the macro nature of the rally.
- Ethereum led gains (+7.9% to $2,365), with XRP +3.2%, Solana +4.9%, GMCI 30 +4.9%, pointing to broad risk appetite.
- Crypto equities confirmed the move with shares of Circle +12%, Bullish +7.5%, Coinbase +3.9%.
Macro driver: geopolitics and oil easing pressure
- The key catalyst was a partial unwind of geopolitical risk, after signals of progress in U.S.-Iran talks.
- Markets reacted to the idea that a reopening of the Strait of Hormuz may still be achievable.
- This matters because Hormuz impacts oil, inflation expectations, and global risk sentiment.
- Oil fell easing macro pressure and supporting risk assets.
What matters next: flows, levels, and risks
- ETF inflows and whale accumulation remain critical in stabilizing the market and supporting the rebound.
- $70,000 is key support, defining whether the structure remains intact.
- $72,000–$75,000 is the key resistance zone—holding above it would strengthen the bullish case.
- Upside drivers: improving macro tone, falling oil, strong flows, and cross-asset momentum.
- Downside risks: no final geopolitical resolution and high sensitivity to new headlines.
- Investors should watch closely Bitcoin dominance, Fed signals, macro data, and energy markets for confirmation or reversal.
- Momentum has returned and the rebound is broad, but until the macro backdrop stabilizes, this remains a fragile, event-driven market rather than a clean trend continuation.
Bitcoin (D1 chart)
Looking at the Bitcoin chart, we can see a geometric 1:1 structure, which means that $75k - $76k level may be crucial for a rebound, while falling from this level may lead to another long positions liquidation and sell-off even below $60k.
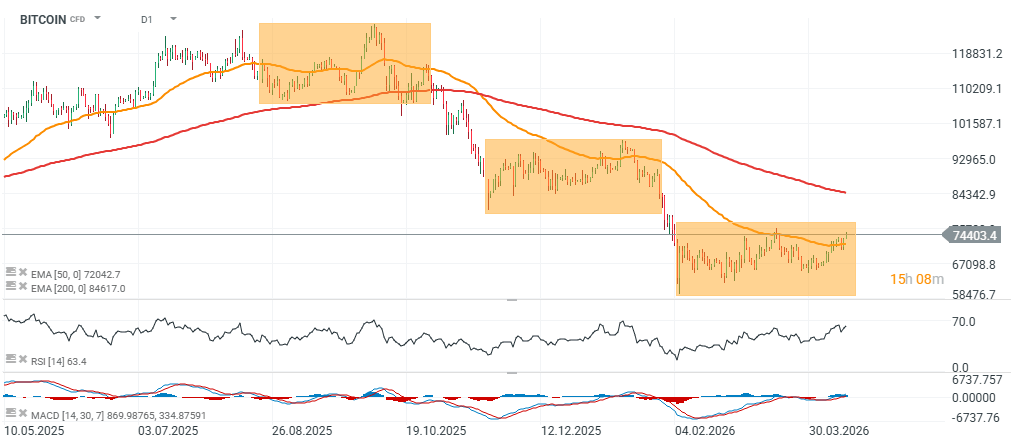
Source: xStation5
ETFs are buying Bitcoins again? Bloomberg data shows that the answer is - yes. We can see quite large improvement in investors' sentiments confirmed by Bitcoin ETFs activity.
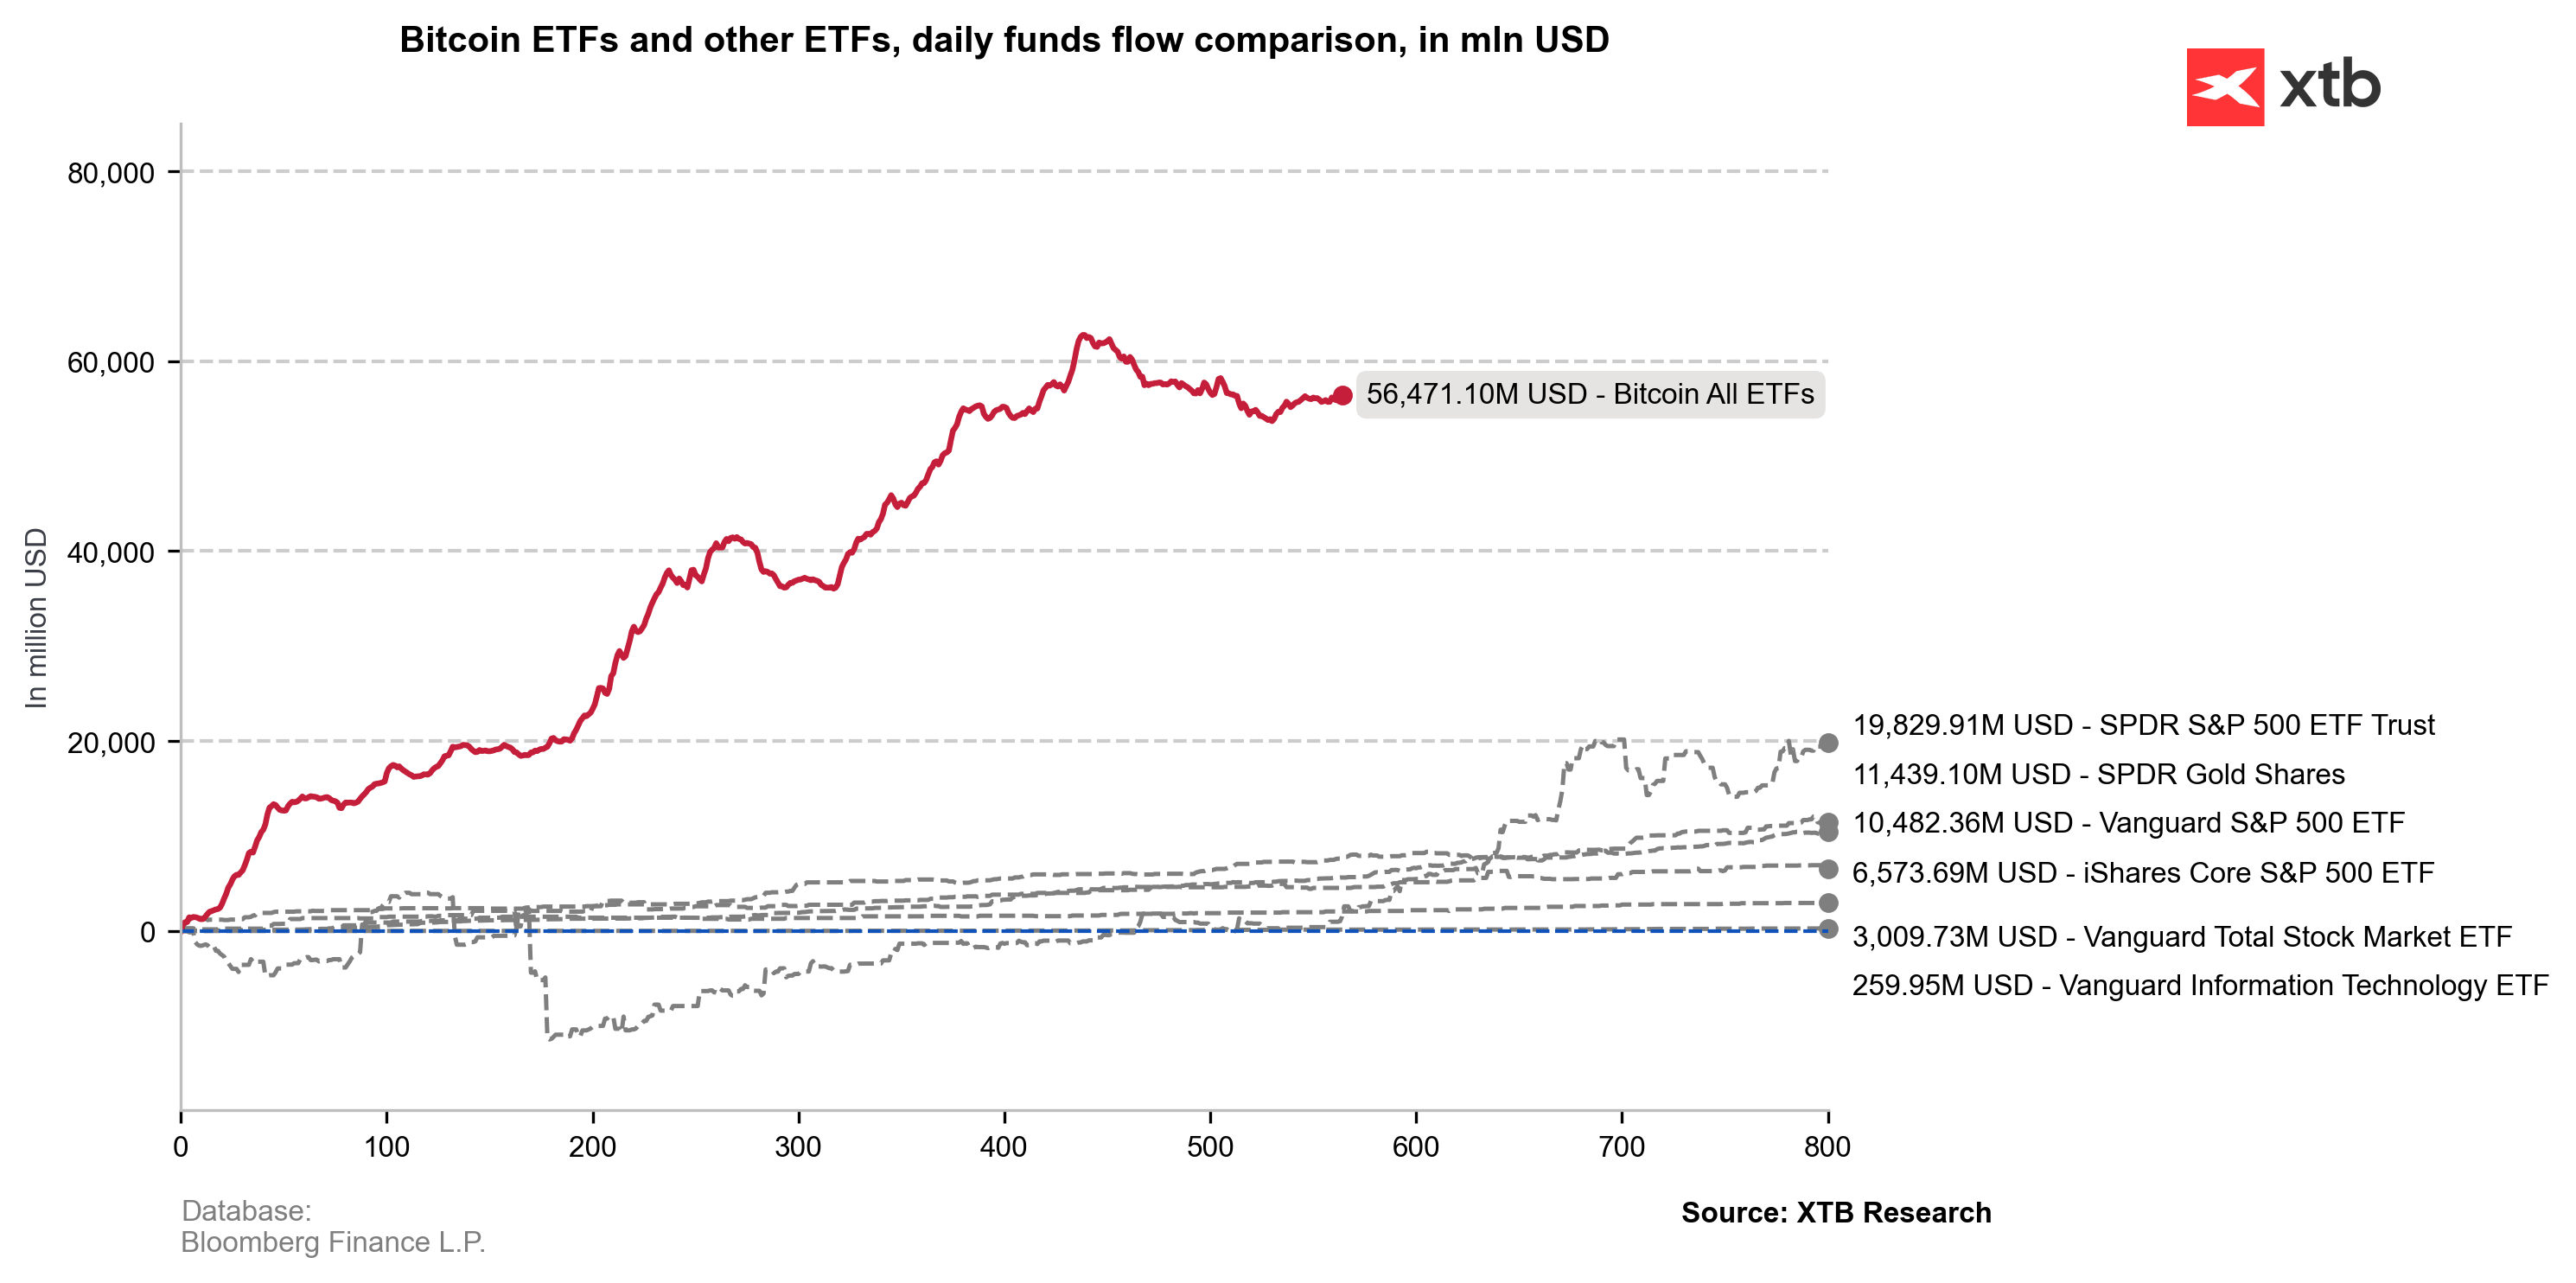
Source: XTB Reserach, Bloomberg Finance LP
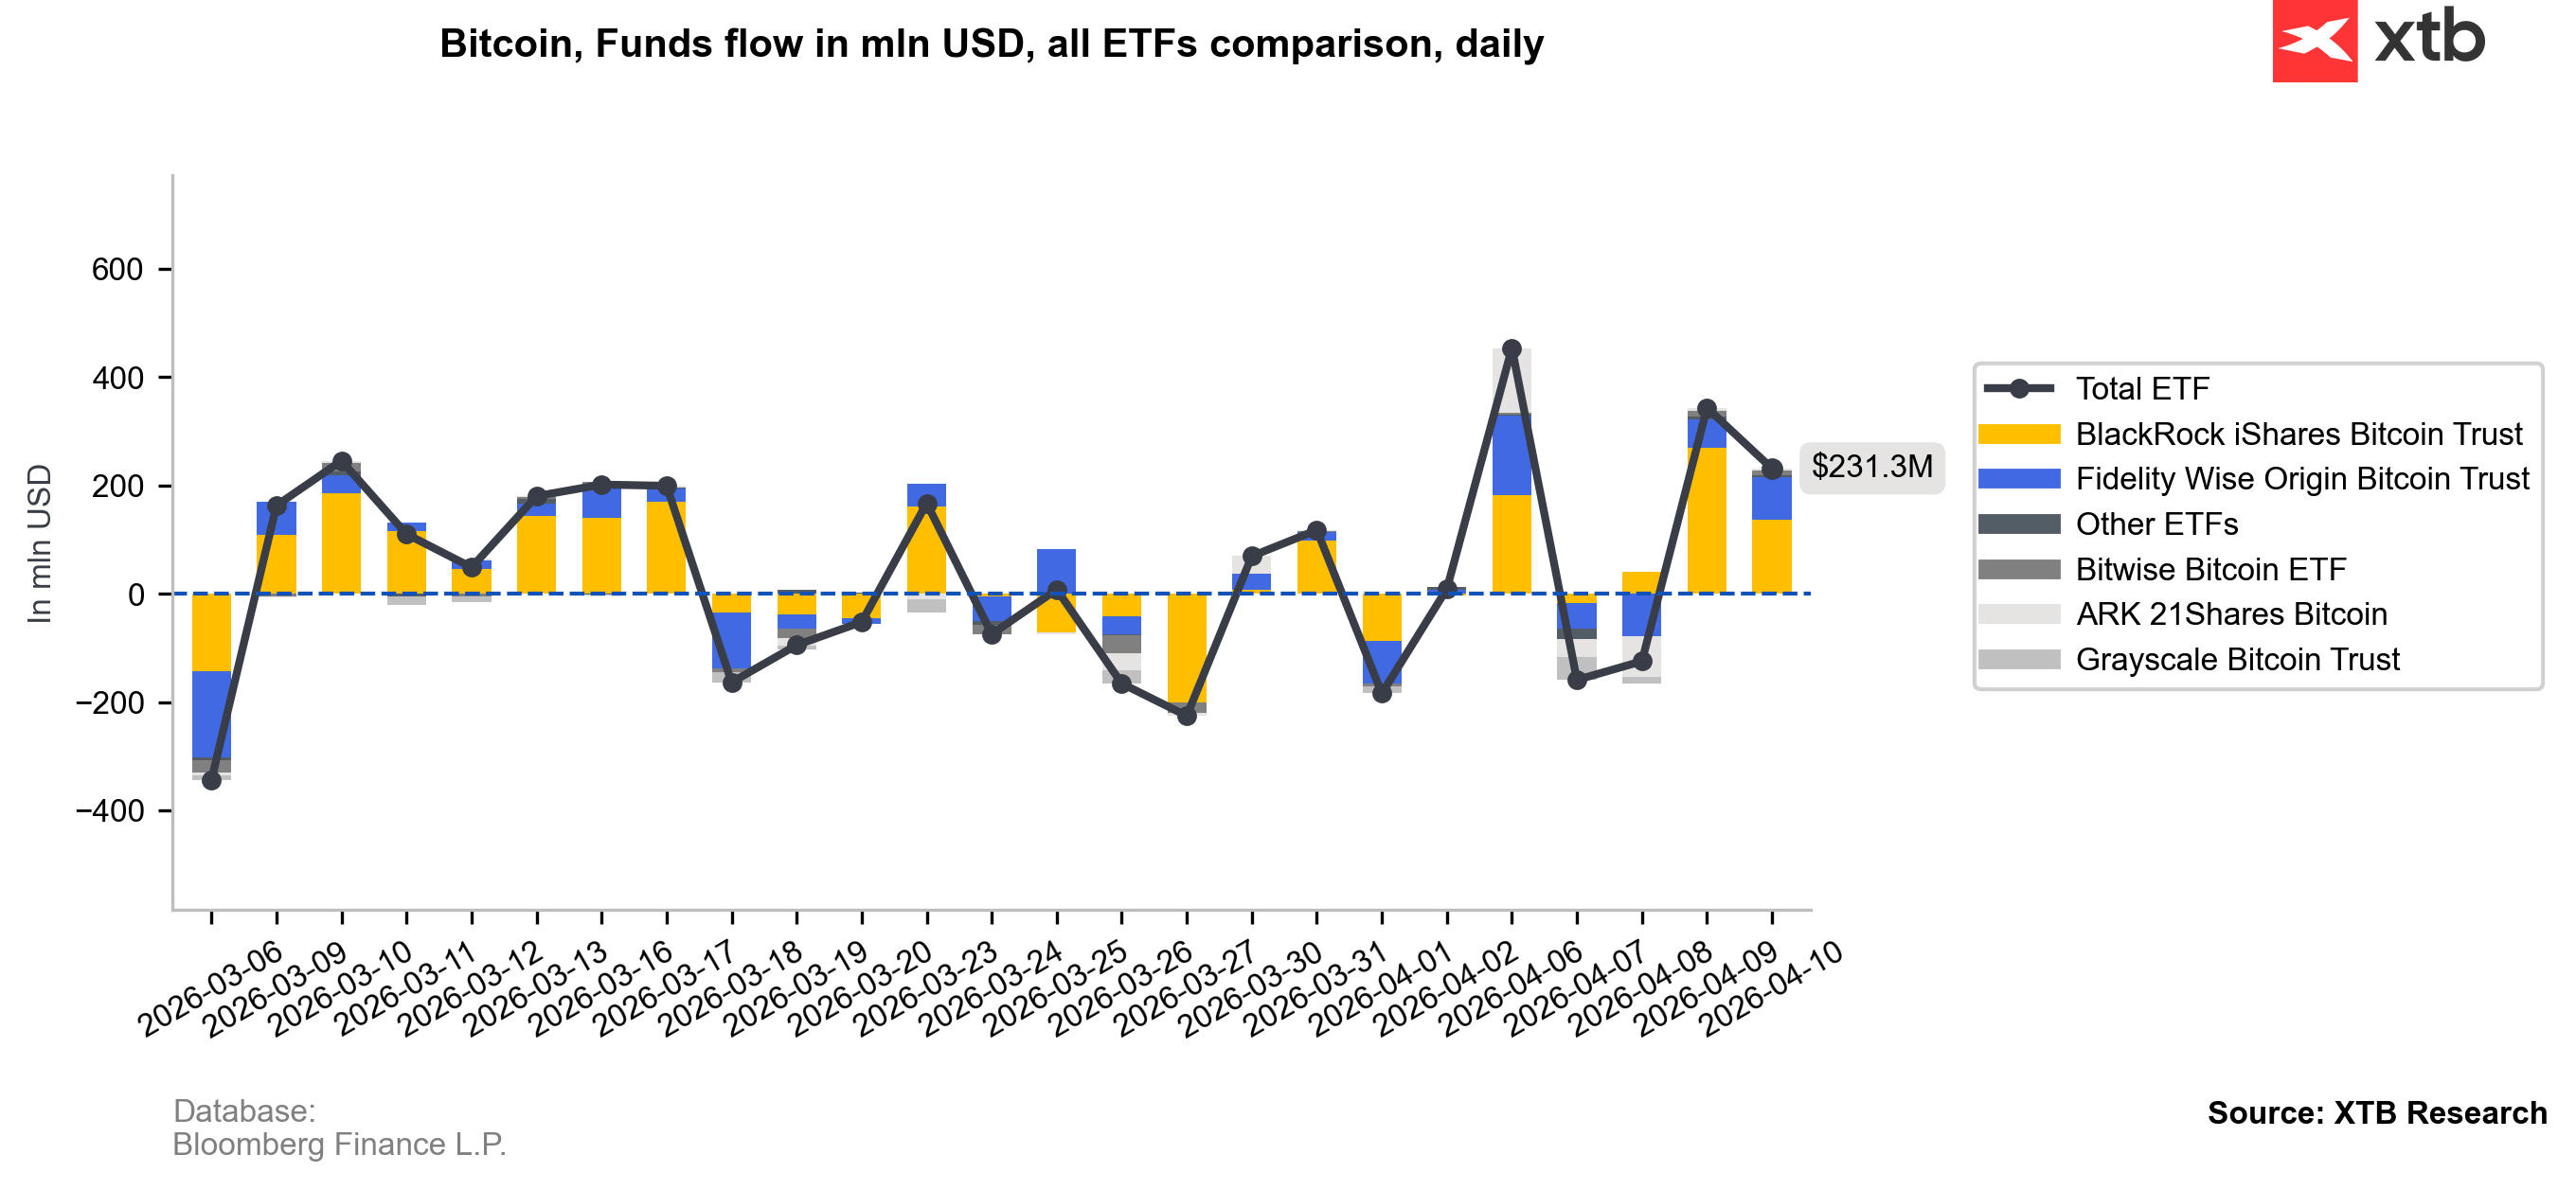
Source: XTB Reserach, Bloomberg Finance LP

Daily Summary: Semiconductors Rise in the Shadow of Geopolitical Turmoil

Tech sector catches its breath 🚀

Red Sea, but not the indices : The effects of the Bab al-Mandab blockade.

US OPEN: Semiconductors drive a rebound
This content has been created by XTB S.A. This service is provided by XTB S.A., with its registered office in Warsaw, at Prosta 67, 00-838 Warsaw, Poland, entered in the register of entrepreneurs of the National Court Register (Krajowy Rejestr Sądowy) conducted by District Court for the Capital City of Warsaw, XII Commercial Division of the National Court Register under KRS number 0000217580, REGON number 015803782 and Tax Identification Number (NIP) 527-24-43-955, with the fully paid up share capital in the amount of PLN 5.869.181,75. XTB S.A. conducts brokerage activities on the basis of the license granted by Polish Securities and Exchange Commission on 8th November 2005 No. DDM-M-4021-57-1/2005 and is supervised by Polish Supervision Authority.