
Upbeat moods during yesterday's session on Wall Street have pushed major US indices to a fresh all-time highs. S&P 500 reached new record high but a pullback could have been spotted on the futures markets during the Asian session. US 10-year yields jumped back towards 1.60% as bonds resumed sell-off. In case a pullback continues and deepens, the first support to watch can be found in the 3,888 pts area, where the lower limit of the local market geometry as well as the earlier-broken downward trendline are located.
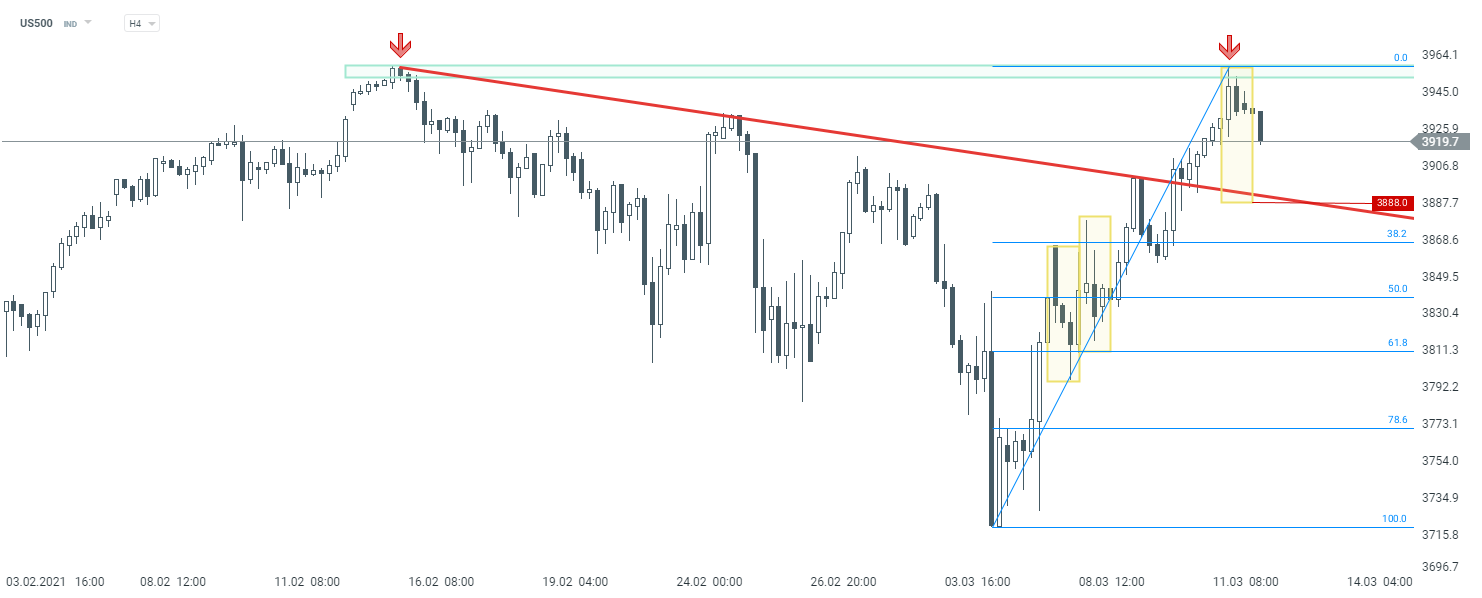 US500 at H1 interval. Source: xStation5

Daily Summary: Wall Street Regains Ground; Another Intervention in the Yen Market❓

Three Markets to Watch Next Week (July 31, 2026)

What July can tell us about where stocks go next

Market Wrap: European equities at 3-week highs! Apple dips in US premarket!
This content has been created by XTB S.A. This service is provided by XTB S.A., with its registered office in Warsaw, at Prosta 67, 00-838 Warsaw, Poland, entered in the register of entrepreneurs of the National Court Register (Krajowy Rejestr Sądowy) conducted by District Court for the Capital City of Warsaw, XII Commercial Division of the National Court Register under KRS number 0000217580, REGON number 015803782 and Tax Identification Number (NIP) 527-24-43-955, with the fully paid up share capital in the amount of PLN 5.869.181,75. XTB S.A. conducts brokerage activities on the basis of the license granted by Polish Securities and Exchange Commission on 8th November 2005 No. DDM-M-4021-57-1/2005 and is supervised by Polish Supervision Authority.