-
US indices rallied today, led by tech stocks. S&P 500 gains 1.1%, Dow Jones adds 0.7% and Nasdaq jumps 1.6%. Russell 2000 rallies 1.8%
-
European stock market indices traded higher today. German DAX added 0.2%, UK FTSE 100 moved 0.1% higher while French CAC40 and Dutch AEX gained 0.4%. Polish WIG20 was a laggard with 1.4% drop
-
Hopes for new Chinese stimulus sparked by comments by Chinese Primer triggered gains on industrial metals markets
-
ECB President Lagarde hinted that recent data supports a rate hike in July
-
Reuters reported that majority of ECB members expect rates to be raised at July and September meetings as inflation remains an issue
-
Goldman Sachs increased its US Q2 GDP forecast from 1.8 to 2.2% QoQ
-
HSBC warns that US will fall into recession this year while Europe will follow in 2024
-
OPEC denied media reports saying that it has invited Guyana to join the group
-
Cryptocurrencies traded higher following reports that Fidelity is preparing to file for the Bitcoin ETF
-
US durable goods order surprised to the upside in May. Headline orders increased 1.7% MoM (exp. -1.1% MoM) while core orders were 0.6% MoM higher (exp. -0.1% MoM)
-
Headline Canadian CPI inflation slowed from 4.4 to 3.4% YoY in May, in-line with market expectations. However, core CPI slowed more-than-expected, from 4.1 to 3.7% YoY (exp. 3.9% YoY)
-
Conference Board consumer sentiment index jump from 102.3 to 109.7 in June (exp. 103.6). Present Situation subindex moved from 148.6 to 155.3 while Expectations subindex jumped from 71.5 to 79.3
-
US new home sales 12.2% MoM in May to 763k (exp. 670k)
-
Energy commodities trade lower - oil drops 1.9% while US natural gas prices decline 0.9%
-
Precious metals trade mixed - gold drops 0.6%, silver gains 0.2% and platinum trades flat
-
EUR and GBP are the best performing G10 currencies while JPY and CAD lag the most

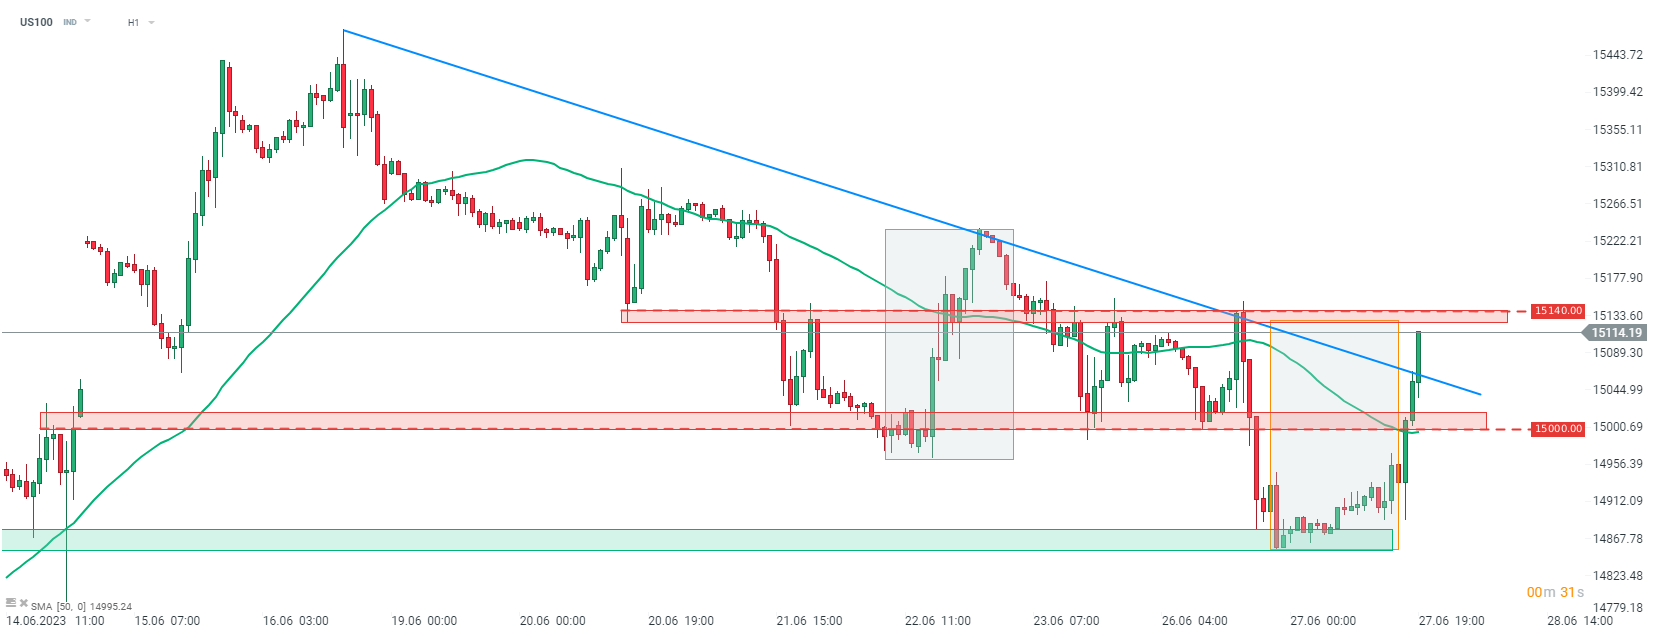
Nasdaq-100 (US100) broke above the 50-hour moving average (green line), 15,000 pts resistance zone and bearish trendline today. The index is closing in on the 15,140 pts resistance zone, marked with previous price reactions and the upper limit of market geometry. Source: xStation5

NFP preview

Daily summary: Weak US data drags markets down, precious metals under pressure again!

US Open: Wall Street rises despite weak retail sales

US2000 near record levels 🗽 What does NFIB data show?
This content has been created by XTB S.A. This service is provided by XTB S.A., with its registered office in Warsaw, at Prosta 67, 00-838 Warsaw, Poland, entered in the register of entrepreneurs of the National Court Register (Krajowy Rejestr Sądowy) conducted by District Court for the Capital City of Warsaw, XII Commercial Division of the National Court Register under KRS number 0000217580, REGON number 015803782 and Tax Identification Number (NIP) 527-24-43-955, with the fully paid up share capital in the amount of PLN 5.869.181,75. XTB S.A. conducts brokerage activities on the basis of the license granted by Polish Securities and Exchange Commission on 8th November 2005 No. DDM-M-4021-57-1/2005 and is supervised by Polish Supervision Authority.


