
Delta Air Lines (DAL.US) shares plunged over 4,0% on Friday after the airline maintained its full-year financial outlook despite upbeat quarterly profit, which were supported by robust travel demand.
-
Company earned $1.48 per share versus a Refinitiv estimate of $1.33.
-
Revenue of $13.44 billion also topped market projections of $12.23 billion.
-
Company recorded operating cash flow of $6.2 billion for the year, ending 2022 with $9.4 billion in liquidity
-
Delta Air Lines maintained an outlook for "significant" growth in 2023, including EPS of $5-$6 and free cash flow of more than $2 billion.
-
Full year revenue is expected to increase in the region 15%-20%.
-
Company forecasts Q1 2023 earnings of 15 cents to 40 cents a share, well below FactSet analysts, which were expecting earnings of 59 cents a share.
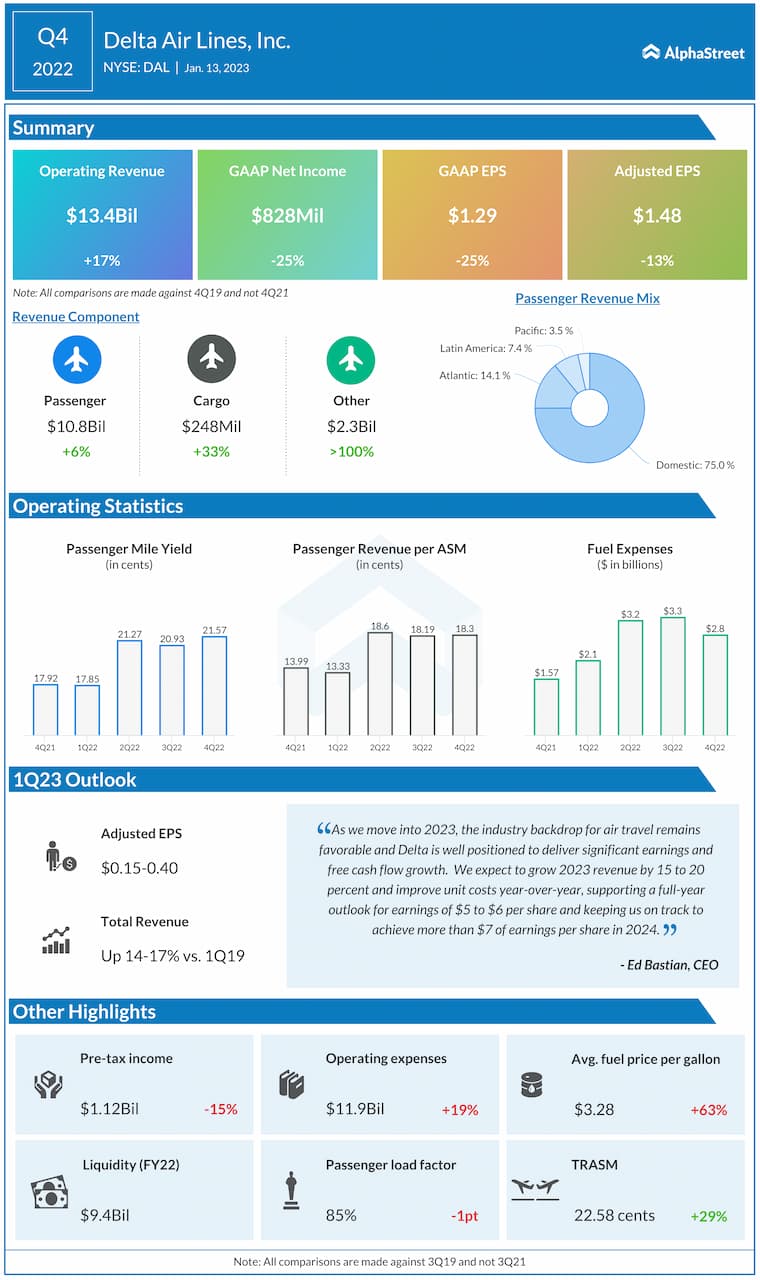 Key quarterly highlights from Delta Airlines. Source: Alpha Street
-
"As we move into 2023, the industry backdrop for air travel remains favorable and Delta is well positioned to deliver significant earnings and free cash flow growth" CEO Ed Bastian said in a statement. Bastain also mentioned that Delta is aiming to achieve EPS of more than $7 in 2024.
-
On the other hand, CFO Dan Janki tempered expectations for the first quarter of 2023. "For the March quarter, we expect non-fuel unit costs to increase 3% to 4% year-over-year, including a full quarter impact from labor cost increases and finalizing the rebuild of our network for the peak summer period," he said.
-
Airline industry is still recovering from the pandemic shock, however recent data from Delta look optimistic. Solid demand in the final quarter of 2022 increased domestic total passenger revenue by 7.0% above pre-pandemic level. International passenger revenue jumped 5.0 % in Q4, compared with the fourth quarter of 2019. If demand remains robust in the upcoming quarters, airline stocks could potentially launch a bigger recovery move towards pre-pandemic highs.

Delta Air Lines (DAL.US) stock is still trading over 40.0% below 2020 highs, so there is definitely an upside potential, however earlier buyers will need to overcome resistance at $39.85, which coincides with 50.0% Fibonacci retracement of the downward wave launched in January 2020 and long-term downward trendline. Only breaking higher would point to a shift of market sentiment to more bullish. On the other hand, if sellers regain control, then nearest support to watch is located around $34.45 and coincides with 38.2% retracement, 50 SMA (green line) and 200 SMA (red line). Source: xStation5

Market Wrap: Indices gain on technology stocks rise and lower US PPI data

Micron vs. Nvidia: Wall Street's New AI Darling Has Soared 18-Fold Since ChatGPT

Morgan Stanley delivers a blockbuster quarter. Record earnings spark Wall Street rally
BlackRock shares jump 5% after earnings 🔼 What did the Wall Street giant report?
This content has been created by XTB S.A. This service is provided by XTB S.A., with its registered office in Warsaw, at Prosta 67, 00-838 Warsaw, Poland, entered in the register of entrepreneurs of the National Court Register (Krajowy Rejestr Sądowy) conducted by District Court for the Capital City of Warsaw, XII Commercial Division of the National Court Register under KRS number 0000217580, REGON number 015803782 and Tax Identification Number (NIP) 527-24-43-955, with the fully paid up share capital in the amount of PLN 5.869.181,75. XTB S.A. conducts brokerage activities on the basis of the license granted by Polish Securities and Exchange Commission on 8th November 2005 No. DDM-M-4021-57-1/2005 and is supervised by Polish Supervision Authority.