
The beginning of this week (and the new month) is being marked by USD weakness against the major currencies.
However, the EUR/USD pair continues to struggle to break above the Fibonacci levels as we will see below.
4-hour time frame chart.
On the 4-hour chart, we can see that buyers are still struggling to break above the Fibonacci levels marked by 61.8% which coincides with the upper limit of the range.
Although the medium and long term trend is bearish, in the short term it seems that evidence is starting to emerge that a bullish recovery of the euro against the US dollar could emerge.

EUR/USD, 4 hour time frame chart. Source: xStation
In the dollar index, we can see that sellers are regaining control of the price after the breakout of the downtrend line has emerged.
This scenario ends up supporting the possibility of the euro recovering against the dollar.

Dollar INDEX, Daily Time frame chart. Source: xStation 5
During this session, JPY is leading the gains!
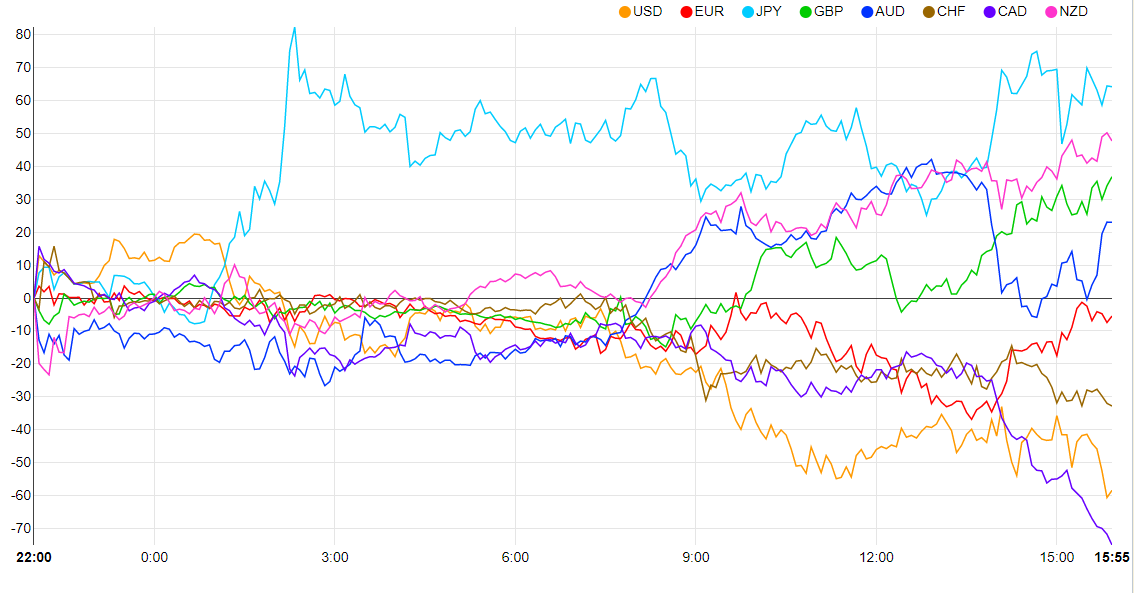
Source: currency-strength.com
Henrique Tomé, XTB Portugal

Week Ahead

Daily Summary: Equities Diverge as Tech Lags, Europe Rallies on Earnings & PMIs (24.07.2026)

Three markets to watch next week (24.07.2026)

BREAKING: Eurozone recovery? Positive PMI data tempered by high oil and gas prices
This content has been created by XTB S.A. This service is provided by XTB S.A., with its registered office in Warsaw, at Prosta 67, 00-838 Warsaw, Poland, entered in the register of entrepreneurs of the National Court Register (Krajowy Rejestr Sądowy) conducted by District Court for the Capital City of Warsaw, XII Commercial Division of the National Court Register under KRS number 0000217580, REGON number 015803782 and Tax Identification Number (NIP) 527-24-43-955, with the fully paid up share capital in the amount of PLN 5.869.181,75. XTB S.A. conducts brokerage activities on the basis of the license granted by Polish Securities and Exchange Commission on 8th November 2005 No. DDM-M-4021-57-1/2005 and is supervised by Polish Supervision Authority.