



The gold price has had a tough year so far. After peaking in January, it has fallen more than 4% year to date, and is down 7 % in the past month.
It is stabilising on Thursday around $4140, however, the outlook remains bleak. The gold price is coming under pressure as bonds struggle. Yields are rising sharply across the developed world. The 10-year Treasury yield is trading around 5.33% this week, a rise of more than 8bps in the past week, and more than 50 bps in the past month.
The problem is that bonds pay interest and gold doesn't. So in an environment of rising yields, gold is less attractive. Gold is also a victim of the Fed raising interest rates, and it is also a victim of its own success. The gold price reached a record high on 29th January, when it reached $5,595. Since then, geopolitics have deteriorated and financial market volatility has risen, which is why investors have booked profits in gold in recent months to boost their cash positions.
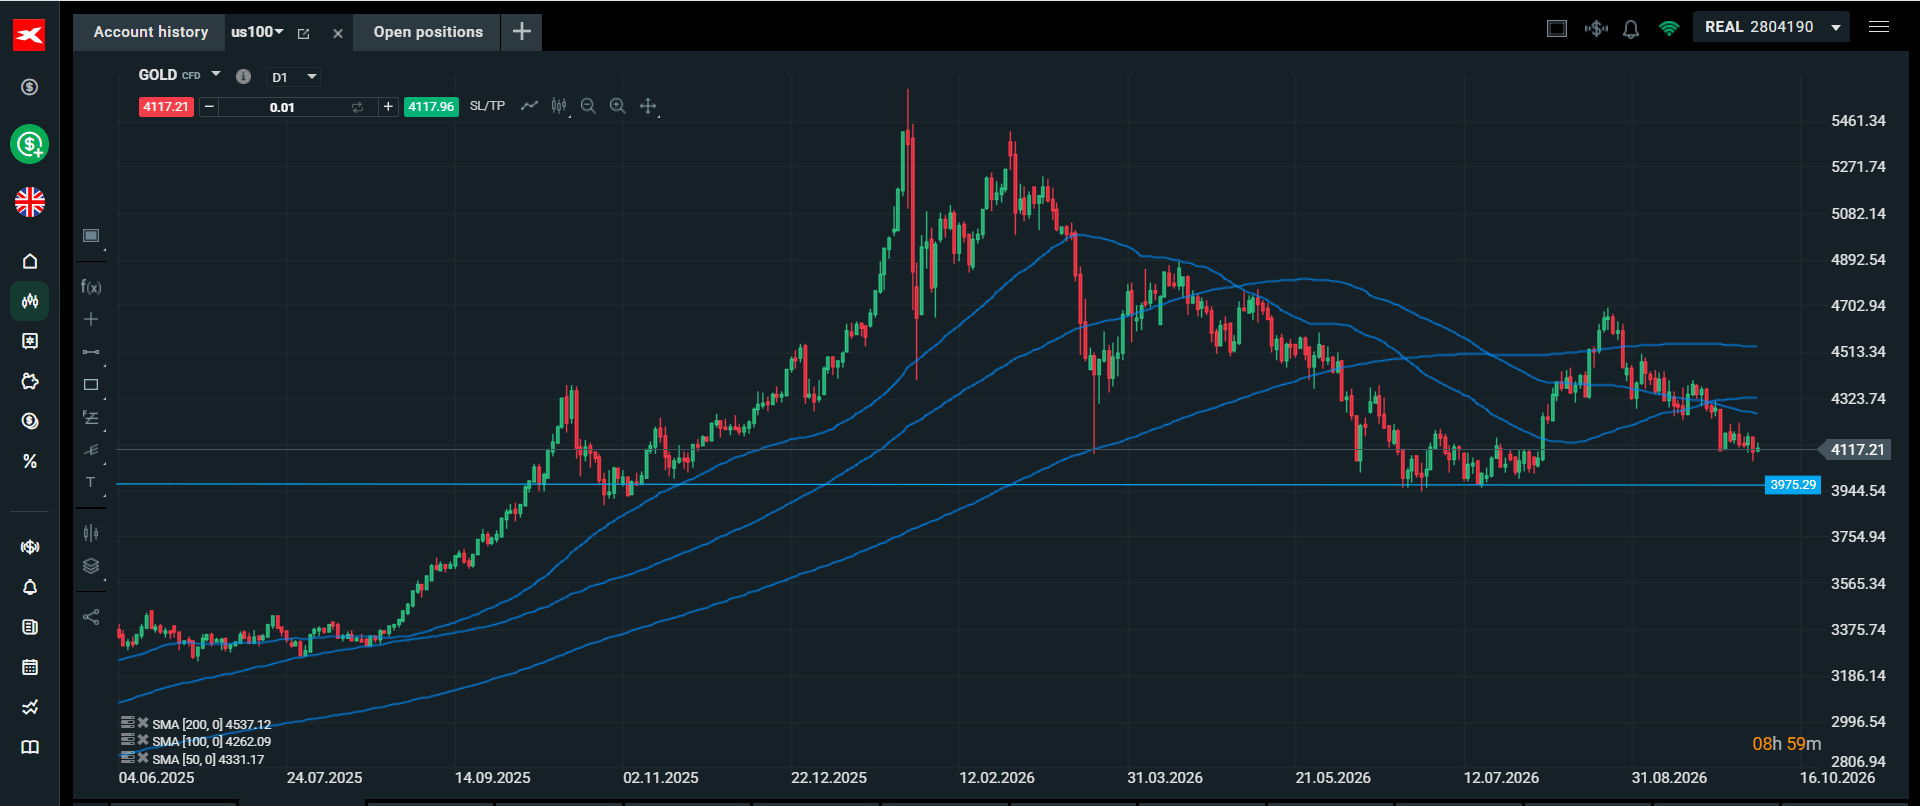
From a technical standpoint, there is a strong bearish outlook for gold. It is trading below its 50-day and 200-day smas, which suggests that the structural bias remains to the downside. The longer term outlook remains bullish, but it is still tricky to hold a long position in gold right now.
In the immediate term, support lies at $4,100, and then the key psychological level of $4,000, ahead of formal support at $3975, as you can see in the chart below. A break below this level could change the long term bullish set up for the gold price.
To make a bullish case for gold, the price of the yellow metal needs to head back to $4,200 - $4,220, which is an immediate resistance zone. Above here, strong resistance lies at $4,331, the 50-day sma, ahead of $4537, the 200-day sma.
These levels will be tough to reach in the current environment, and we think that, on balance, the path of least resistance is for more weakness in the coming weeks. However, if the Fed strikes a less hawkish tone when it meets later this week, it could trigger a deeper recovery. For now, we see more downside, and a mini recovery on Thursday could lead to another wave of selling, as traders attempt to test $4,000 support.
Chart 1: Gold price with daily moving averages
Source: XTB. Past performance is not a reliable indicator of future results.



U.S. attacks on Iran suspended 💥



Market Wrap: A 4% surge in oil prices weighs on indices (08.10.2026)


Oil crashes the stock market party
Morning wrap: Wall Street and precious metals attempt to stabilize as oil gains nearly 2%
This content has been created by XTB S.A. This service is provided by XTB S.A., with its registered office in Warsaw, at Prosta 67, 00-838 Warsaw, Poland, entered in the register of entrepreneurs of the National Court Register (Krajowy Rejestr Sądowy) conducted by District Court for the Capital City of Warsaw, XII Commercial Division of the National Court Register under KRS number 0000217580, REGON number 015803782 and Tax Identification Number (NIP) 527-24-43-955, with the fully paid up share capital in the amount of PLN 5.869.181,75. XTB S.A. conducts brokerage activities on the basis of the license granted by Polish Securities and Exchange Commission on 8th November 2005 No. DDM-M-4021-57-1/2005 and is supervised by Polish Supervision Authority.